Multiband One-Dimensional Electronic Structure and Spectroscopic
Signature of Tomonaga-Luttinger Liquid Behavior in
K2Cr3As3
M. D. Watson,1,* Y. Feng,2C. W. Nicholson,3 C. Monney,4 J. M. Riley,1,5 H. Iwasawa,1 K. Refson,6,7V. Sacksteder,6 D. T. Adroja,7,8 J. Zhao,2 and M. Hoesch1
1Diamond Light Source, Harwell Campus, Didcot, OX11 0DE, United Kingdom
2
State Key Laboratory of Surface Physics and Department of Physics, Fudan University, Shanghai 200433, China
3Department of Physical Chemistry, Fritz-Haber-Institut of the Max Planck Society, Faradayweg 4-6, Berlin 14915, Germany
4
Department of Physics, University of Zurich, Winterthurerstrasse 190, 8057 Zurich, Switzerland
5SUPA, School of Physics and Astronomy, University of St Andrews, St Andrews, Fife KY16 9SS, United Kingdom
6
Department of Physics, Royal Holloway, University of London, Egham, Surrey TW20 0EX, United Kingdom
7ISIS Facility, Rutherford Appleton Laboratory, Chilton, Didcot, Oxon, OX11 0QX, United Kingdom
8
Highly Correlated Matter Research Group, Physics Department, University of Johannesburg, P.O. Box 524, Auckland Park 2006, South Africa
(Received 13 October 2016; published 1 March 2017)
We present angle-resolved photoemission spectroscopy measurements of the quasi-one-dimensional superconductor K2Cr3As3. We find that the Fermi surface contains two Fermi surface sheets, with linearly dispersing bands not displaying any significant band renormalizations. The one-dimensional band dispersions display a suppression of spectral intensity approaching the Fermi level according to a linear power law, over an energy range of∼200meV. This is interpreted as a signature of Tomonoga-Luttinger liquid physics, which provides a new perspective on the possibly unconventional superconductivity in this family of compounds.
DOI:10.1103/PhysRevLett.118.097002
The recently discovered quasi-one-dimensional (Q1D) superconductorsA2Cr3As3(A¼K;Rb;Cs) present a new opportunity for the study of the phenomena that may occur when electrons are effectively confined to one dimension. The hexagonal crystal structure consists of infinite stacks of [Cr3As3] clusters running along thecaxis, which form the one-dimensional structural motif [1,2]. The Aþ ions between the chains transfer charge and mediate interchain coupling thus rendering the material Q1D. The inclusion of Cr in the structure is a rare example of incorporating 3d orbitals into a Q1D system, as opposed to the well-known case of 4d orbitals in metallic Mo-based Q1D systems Li0.9Mo6O17 and Tl2Mo6Se6, which brings the possibility of strong correlations[1]and magnetic interactions, which may be frustrated due to the triangular Cr motifs in the structure [3]. Superconductivity is found at 6.1 K in K2Cr3As3 [4], which ranks amongst the highest Tc for Q1D systems, and has been suggested to be of an uncon-ventional nature [1] with some experimental [5,6] and theoretical[7–9]support for a triplet pairing state. Finally, the one dimensionality of the system makes it a candidate for Tomonaga-Luttinger liquid (TLL) physics [7,10–12].
This rich set of phenomena constitutes a very strong motivation for experimental determinations of the elec-tronic structure by angle-resolved photoemission spectros-copy (ARPES) measurements.
In this Letter, we present a detailed study of the electronic structure of single crystals of K2Cr3As3 using ARPES. We find a Fermi surface containing two linearly dispersing holelike Q1D Fermi surface sheets. The overall bandwidth of the Cr 3d bands and Fermi velocities are comparable to DFT calculations, indicating that the corre-lated Fermi liquid picture is not appropriate for K2Cr3As3. Furthermore, we show that the spectral weight of the Q1D bands decreases according to an approximately linear power law over a ∼200meV energy scale up to the Fermi level, also obeying a universal temperature scaling relation. This power-law depletion of spectral weight is a signature of TLL behavior in photoemission measurements of one-dimensional systems. We conclude that the wide range of fascinating experimental results on A2Cr3As3 should be interpreted within the framework of a Q1D system close to TLL physics.
The highly pure K2Cr3As3single crystals were prepared using a high temperature solution growth method [1,4]. The starting materials were loaded in an alumina crucible following the ratio of K: Cr: As¼6∶1∶7. The alumina crucible was welded in a Ta tube and then sealed in an evacuated quartz ampoule. The quartz ampoule was slowly heated up to 1173 K and held for 24 h in a furnace, followed by cooling down to 923 K at a rate of 2K=h. ARPES Published by the American Physical Society under the terms of
the Creative Commons Attribution 4.0 International license. Further distribution of this work must maintain attribution to the author(s) and the published article’s title, journal citation, and DOI.
PRL118,097002 (2017) P H Y S I C A L R E V I E W L E T T E R S 3 MARCH 2017
measurements were performed at the I05-ARPES beam line at the Diamond Light Source, UK. Straight sticklike samples with typical sizes of∼2000×200×200 μm were selected and prepared for ARPES measurements with the standard top-post cleavage method in ultrahigh vacuum (UHV). The gluing of the samples to the holders and the attachment of top posts was performed in a dry Ar glove box. Samples were carefully aligned such that the long axis of the sticklike samples was parallel with the detector, enabling cuts inkz (dispersion parallel to the crystal c axis) to be obtained. In this geometry, varying either polar rotation of the sample or the incident photon energy manipulates the wave vector component k∥ in the ða; bÞ plane of the crystal, although absolute determination of the in-plane wave vector is difficult. Data are obtained with an incident photon energy of hν¼96eV, with linear polarization either along the crystal c axis (“LV”) or orthogonal across (“LH”). The experimental energy resolution was set to 23 meV. The Fermi level was obtained from reference measurements on polycrystalline gold. Density functional theory (DFT) calculations were performed inWien2k[13]using the exper-imental crystal structure[1].
In Fig.1(a), we show the crystal structure of K2Cr3As3 projected in the (a,b) plane[1]. The Cr3As3chains extend along the c axis are separated by Kþ guest ions in two inequivalent positions. Thus, the electronic structure is
expected to be dominated by Q1D dispersions arising mainly from Cr3dorbitals, which combine into molecular orbitals on the triangular Cr plaquettes[7,14]. In Fig.1(b), we present the shallow core level spectrum of K2Cr3As3. The K3p core levels around 18 eV display a multipeak structure [15], reflecting the inequivalent K sites [1]. A shallow bump around 11 eV binding energy matches well with the As 4p levels in the calculation. The brightest feature in the spectrum from 4 eV up to the Fermi level consists of the Cr3dvalence bands. Figure1(c)shows the dispersions of these bands alongkz. The observed perio-dicity alongkz matches with the expected Brillouin zone, and some dispersions can be associated with particular bands in the DFT calculations. Thus, we are confident that our measurements are representative of the bulk band dispersions derived from various subshells of the Cr 3d band and that the sample is a single crystal. Because of photoemission matrix element effects, the intensity of dispersions depends strongly on the light polarization. In particular, the intense and highly dispersive band in the left panel of Fig. 1(c) (LH polarization) is suppressed in LV polarization (right panel), whereas the Q1D bands extend-ing up to the Fermi level are primarily observed in LV polarization. We note that these spectra were taken from a freshly cleaved sample; over a relatively short time scale of a few hours in good UHV, the Cr3dbands lose intensity
K
Cr
As
−2 −1 0 1
−0.5 0 0.5
k z
(Å
−1
)
MK A
L H
K K
96 eV, LH
(a) (c)
(d) (e)
(b)
−1 −0.5 0.5 1 3
2 1 0
Binding Energy
(eV)
kz (Å
−1)
A LH
−1 −0.5 0.5 1
kz (Å−1)
A LV
LV
(f)
20 15 10 5 0
60 40 20 0
Binding Energy (eV)
States / eV / cell
total K As Cr
Intensity
LH
dz2
dxy+dx -y
dxz+dyz 2 2
k
|| (Å −1
[image:2.612.64.549.45.311.2])
and the detail in the K core level structure is lost as the surface degrades (see Supplemental Material, SM[16]).
There is a good agreement between the DFT calculation and the experimental bandwidth of the Cr 3d bands, as shown in Figs.1(b)and1(c). This is a somewhat surprising observation given that K2Cr3As3 has previously been suggested as a strongly correlated electron system due to the anomalously large Sommerfeld coefficient [1,4]. Metallic systems with strong correlations usually manifest in ARPES with renormalized quasiparticle bands which become sharp at the Fermi level, and the overall bandwidth can appear compressed compared to DFT calculations. However, here the observed Cr 3d dispersions generally have a similar bandwidth to the calculations, and Fermi velocities are also similar as shown in Table I; thus, only minor or no renormalization effects are found.
In Fig. 1(d), we present the Fermi surface map of K2Cr3As3. This map is constructed by integrating the spectral weight to a much deeper binding energy of 50 meV than would routinely be used in ARPES analysis; this is necessary since the measured spectral weight disappears as the Fermi level is approached, as will be discussed later. The DFT calculations shown in Figs. 1(e) and1(f) predict the existence of two pairs of Q1D bands (α,β) and a Q3D band (γ); due to the absence of inversion symmetry in the crystal structure[1], the inclusion of spin-orbit coupling in the calculation splits these bands further. Experimentally, the Fermi surface is found to include only two 1D bands, with no indication of any 3D Fermi surfaces. Any spin-orbit induced splitting is not resolved.
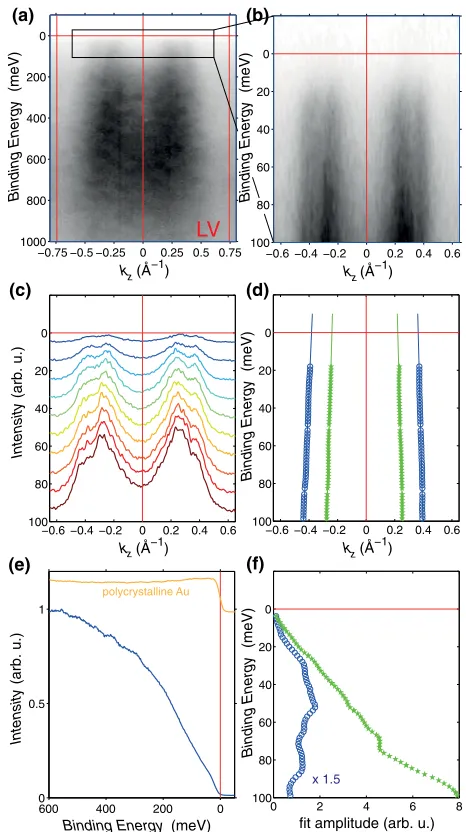
In Fig.2, we present a detailed analysis of a cut measured in LV polarization, which includes the pair of bands which approach the Fermi level. Band positions are extracted in Fig. 2(d) by constrained fits of pairs of Lorentzian line shapes. Both band dispersions are found to be near linear over this energy range, and the derived Fermi wave vectors and velocities are summarized in TableI. The most notable feature of this spectrum is that the spectral weight decreases gradually as the Fermi level is approached, which is clear from both from the data slices in Fig. 2(c) and the integrated spectral weight in Fig.2(e). In Fig.2(f), we plot the intensity of the bands as derived from the peak fitting. Both bands show a near linear rise of intensity within
EB <0.03eV, after which the outer band intensity satu-rates to finite values, while the inner band, which dominates in the total intensity, continues to rise.
[image:3.612.320.553.45.461.2]While a resolution-limited Fermi cutoff is typically observed in ARPES measurements, as shown by the polycrystalline Au reference measurement in Fig. 2(e), the continuous suppression of the single-particle spectral weight is a characteristic of ARPES measurements of several different Q1D systems[17]. One could consider if it may result from order formation, such as a charge density wave leading to a gap opening at EF. However, given that our momentum space surveys show the same spectral weight depletion everywhere in momemtum space, while the material exhibits metallic resistivity without any anomalies except the superconducting transition[4,6], we exclude an ordering-related energy gap atEF. The interplay between
TABLE I. Dispersion parameters of the Q1D bandsαandβ:vF
is estimated from fits to DFT dispersion over the same range as the experimental data for direct comparison.
Expt. Γ-A K-H M-L
kαF (Å−1) 0.37(4) 0.3 0.35 0.35
vαF (eV Å) 2.4(8) 1.3 2.6 2.8
kβF (Å−1) 0.23(4) 0.27 0.28 0.28
vβF (eV Å) 2.8(8) 1.7 1.3 1.3
−0.6 −0.4 −0.2 0 0.2 0.4 0.6 100
80 60 40 20 0
k (Å−1)
Binding Energy
(meV)
0 2 4 6 8
100 80 60 40 20 0
fit amplitude (arb. u.)
Binding Energy
(meV)
−0.75 −0.5 −0.25 0 0.25 0.5 0.75 1000
800 600 400 200 0
Binding Energy
(meV)
k (Å−1)
−0.6 −0.4 −0.2 0 0.2 0.4 0.6 100
80 60 40 20 0
Binding Energy
(meV)
k (Å−1)
−0.6 −0.4 −0.2 0 0.2 0.4 0.6 100
80 60 40 20 0
k (Å−1)
Intensity
(arb. u.)
(a) (b)
(c) (d)
(f)
LV
x 1.5
6000 400 200 0 0.5
1
Binding Energy (meV)
Intensity
(arb. u.)
polycrystalline Au
(e) z
z z
[image:3.612.52.298.88.163.2]z
FIG. 2. (a) ARPES dispersion obtained at 10 K for a cut along the kz direction. Vertical red lines indicate the Brillouin zone
center and boundary. (b) Detailed dispersions close to the Fermi level, and (c) selected momentum distribution curves stacked according to binding energy, showing the suppression of spectral weight approaching the Fermi level. (d) Band positions and (f) fit amplitude of the outer and inner bands. (e) Integrated spectral weight for this cut, compared to a polycrystalline Au reference.
disorder and electron interactions may also deplete the DOS near the Fermi level [18,19], which has recently been proposed for the interpretation of ARPES spectra [20,21]. The Altshuler-Aronov theory for interacting disordered metals [19] predicts that density of states near the Fermi level is a nonzero constant plus an anomalous power law contribution (in 3D) [21]. However, we can dismiss this assignment since our measured DOS extrapolates to zero at the Fermi level even though the samples are good conductors. Thus, we interpret the missing spectral weight on these Q1D dispersions as evidence for the peculiar excitation spectra of a Tomonoga-Luttinger liquid (TLL), where in one dimension the quasiparticle description of excitations breaks down and the highly collective modes allow for low energy excitations only at infinitely small momentum transfer. This leads to a vanishing quasiparticle weight Z [22], and a recovery of spectral weight according to a power law, both as a function of binding energy and temperature. Spectra in agreement with the power law predictions of this model have been observed in varied Q1D systems includ-ing Li0.9Mo6O17[23], carbon nanotubes[24], and Bi chains grown on InSb(001)[25].
In Fig. 3(a), we present the temperature dependence of integrated intensity corresponding to the data shown in Fig.2. The power law behavior of the spectral weight at low temperatures is directly visualized in the double-logarithmic plot of Fig. 3(b). A fit to the data at 10 K yields a nearly linear (α¼0.974) exponent which applies over an energy range of more than an decade. At higher temperatures, the data depart from the simple power law curve below
∼30meV, and a more substantial spectral weight remains at the Fermi level. To model the finite temperature effects, we use a more detailed formula for the intensity (I) of the spectral function, which has a smooth transition from a low-energy regime involving the Fermi-Dirac distribution function fðϵ; TÞ to a high-energy regime dominated by a power law relation,
Iðϵ; TÞ∝Tαcosh
ϵ 2 Γ
1þα
2 þi
ϵ
2π
2fðϵ; TÞ; ð1Þ
where ϵ¼E=kBT (cited from Ref. [25], see also Refs.[26,27]for further discussion).
Direct fits of this equation (convolved with experimental resolution) to data at selected temperatures in the binding energy range 140< EB <−30meV are presented in Fig. 3(c), showing good agreement. The fitted exponents αare found to be in the range 0.97–1.03 for all measured temperatures. Equation(1)also implies a scaling relation; on a plot ofI=Tαas a function of temperature-renormalized energy ϵ¼E=kBT, the various curves as a function of temperature should collapse for the correct choice of α. The plot with α¼1 in Fig.3(d) shows excellent scaling behavior; other choices of α away from 1 show progres-sively worse scaling [16]. The combination of the power law fit, the fitting of Eq. (1) and the temperature scaling relation gives good evidence that K2Cr3As3 follows the
expected behavior for a TLL on both the temperature and energy axes, with a characteristic exponent α≃1. The temperature-independent exponent α≃1 is of a compa-rable magnitude to exponents observed in other recognized TLL systems[28–30]. A decisive proof of the TLL state could come from the observation of spin-charge separation. Our data do not provide such evidence, though it may be hidden in the considerably large widths of the features as sharp spinon and chargon excitations are only expected in cases with much lowerα<0.5[29]. We thus conclude that the photoelectron spectroscopy data presented here con-stitute evidence for TLL or closely related physics.
Resistivity measurements along thecaxis of clean single crystal samples are found to obey aT3scattering law[2,4,6], as opposed to the T2 expectation for a Fermi liquid. Moreover, NMR measurements of K2Cr3As3 found an unusual temperature dependence of the spin relaxation rate, inconsistent with the Korringa law expectation of a Fermi liquid but reminiscent of other TLL systems[10]. While spin fluctuations could still be relevant to both these discussions, deviation from Fermi liquid behavior is certainly expected in the context of these ARPES results, which show an absence of low-energy quasiparticle excitations. The ARPES results also demand a different explanation of the anomalously large Sommerfeld coefficient[1,4], other than the picture of
100 50 0 −2 0 2 4 6 8 10 12 14x 10
−3
Binding Energy (meV)
Normalized Intensity
30 K, = 0.986 70 K, = 0.991 110 K, = 1.067 130 K, = 1.013
30 20 10 0 -10 0
1 2
x 10−4
Normalized Binding Energy (eV/kBT)
Intensity/(T ) 30 K 50 K 70 K 90 K 110 K 130 K 150 K = 1
100 101 102 10−3
10−2
Binding Energy (meV)
Normalized Intensity 10 K 30 K 50 K 70 K 90 K 110 K 130 K 150 K
3000 200 100 0 0.5
1 1.5 2
Binding Energy (meV)
Normalized Intensity 10 K 30 K 50 K 70 K 90 K 110 K 130 K 150 K (a) (b) (c) (d)
Int E0.974
FIG. 3. Integrated spectral weight within in the range−0.5< kz<0.5Å−1. Data are normalized in the range 250<
EB<200meV. (b) Logarithmic plot of (a), after subtraction
of constant offset from background (taken well above EF). A
black line is a linear fit of logarithmic data in range20< EB<
[image:4.612.318.556.46.288.2]quasiparticles renormalized by electron-electron (or elec-tron-phonon [31,32]) interactions. We predict that STM studies would show a similar power law behavior to our observations[33].
Our ARPES data show that the TLL persists down to 10 K, near the superconducting Tc. Therefore, the best starting point for understanding superconductivity may be with TLLs hosted by 1-D Cr3As3 stacks [7,11]and only weakly coupled by the K guest ions, rather than with quasiparticles occupying 3-D Fermi surfaces [8,34]. In Q1D superconductors, the guest ion type and disorder are crucial for controlling superconductivity, as exemplified in theM2Mo6Se6family with guest ionM¼Tl, In, Na, K, Rb
[35–37]. Further ARPES and STM studies of theAxCr3As3 family, changing the guest ions to Rb2, Cs2, K [38–40], could illuminate its superconducting state.
In conclusion, we have presented an ARPES study of single crystals of K2Cr3As3. We find a Fermi surface containing two holelike Q1D Fermi surface sheets with linear dispersions. The spectral weight of the Q1D bands decreases according to an approximately linear power law over a∼200meV energy scale up to the Fermi level, and obeys a universal temperature scaling. This is interpreted as a signature of TLL behavior. These results give a new perspective on the rich physics in the Q1D A2Cr3As3 superconductor family.
We thank T. Forrest, D. Voneshen, A. P. Petrović, Y. Ohtsubo, and C. Berthod for useful discussions. We thank T. K. Kim and D. Daisenberger for technical assistance. We thank the Diamond Light Source for access to beam line I05 (Proposals No. SI13797 and No. NT14572) that con-tributed to the results presented here. C. M. acknowledges support by the Swiss National Science Foundation under Grant No. PZ00P2_154867. J. Z. and Y. F. were supported by the National Natural Science Foundation of China (Grant No. 91421106) and the National Key R&D Program of the MOST of China (Grant No. 2016YFA0300203). J. M. R. acknowledges support from the EPSRC (Grant No. EP/L505079/1). One of us (M. H.) would like to thank Hiroshima University for their kind hospitality at the time of writing this manuscript.
*
matthew.watson@diamond.ac.uk
[1] J.-K. Bao, J.-Y. Liu, C.-W. Ma, Z.-H. Meng, Z.-T. Tang, Y.-L. Sun, H.-F. Zhai, H. Jiang, H. Bai, C.-M. Feng, Z.-A. Xu, and G.-H. Cao,Phys. Rev. X5, 011013 (2015). [2] G.-H. Cao, J.-K. Bao, Z.-T. Tang, Y. Liu, and H. Jiang,
Philos. Mag., doi:10.1080/14786435.2016.1273558 (2017).
[3] X.-X. Wu, J. Yuan, C.-C. Le, H. Fan, and J.-P. Hu,Chin. Phys. Lett.32, 057401 (2015).
[4] T. Kong, S. L. Bud’ko, and P. C. Canfield,Phys. Rev. B91, 020507 (2015).
[5] D. T. Adroja, A. Bhattacharyya, M. Telling, Y. Feng, M. Smidman, B. Pan, J. Zhao, A. D. Hillier, F. L. Pratt, and A. M. Strydom,Phys. Rev. B92, 134505 (2015).
[6] Y. Liu, J. K. Bao, H. K. Zuo, A. Ablimit, Z. T. Tang, C. M. Feng, Z. W. Zhu, and G. H. Cao, Sci. China Phys., Mech. Astron.59, 657402 (2016).
[7] H. Zhong, X.-Y. Feng, H. Chen, and J. Dai,Phys. Rev. Lett. 115, 227001 (2015).
[8] X. Wu, F. Yang, C. Le, H. Fan, and J. Hu,Phys. Rev. B92, 104511 (2015).
[9] H. Jiang, G. Cao, and C. Cao,Sci. Rep.5, 16054 (2015). [10] H. Z. Zhi, T. Imai, F. L. Ning, J.-K. Bao, and G.-H. Cao,
Phys. Rev. Lett.114, 147004 (2015).
[11] J.-J. Miao, F.-C. Zhang, and Y. Zhou, Phys. Rev. B 94, 205129 (2016).
[12] G. Wachtel and Y. B. Kim,Phys. Rev. B94, 104522 (2016). [13] P. Blaha, K. Schwarz, G. Madsen, D. Kvasnicka, and J. Luitz, An Augmented Plane Wave Plus Local Orbitals Program for Calculating Crystal Properties (Techn. Universität Wien, Austria, 2001).
[14] P. Alemany and E. Canadell,Inorg. Chem.54, 8029 (2015). [15] The disagreement between the experimental location of the K3pcore level and the DFT calculation is an artifact related to the often problematic calculation of shallow core levels in DFT.
[16] See Supplemental Material at http://link.aps.org/ supplemental/10.1103/PhysRevLett.118.097002for further scaling plots and analysis, details of the normalization procedure, and a sample comparison.
[17] B. Dardel, D. Malterre, M. Grioni, P. Weibel, Y. Baer, and F. Lévy,Phys. Rev. Lett.67, 3144 (1991).
[18] A. Richardella, P. Roushan, S. Mack, B. Zhou, D. A. Huse, D. D. Awschalom, and A. Yazdani,Science327, 665 (2010). [19] B. Altshuler and A. Aronov,Solid State Commun.30, 115
(1979).
[20] K. Yaji, R. Yukawa, S. Kim, Y. Ohtsubo, Y. F vre, F. Bertran, A. Taleb-Ibrahimi, I. Matsuda, K. Nakatsuji, and F. Komori,arXiv:1602.05284.
[21] M. Kobayashi, K. Tanaka, A. Fujimori, S. Ray, and D. D. Sarma, Phys. Rev. Lett.98, 246401 (2007).
[22] T. Giamarchi,Chem. Rev.104, 5037 (2004).
[23] F. Wang, S. K. Mo, J. W. Allen, H. D. Kim, J. He, R. Jin, D. Mandrus, A. Sekiyama, M. Tsunekawa, and S. Suga,
Phys. Rev. B74, 113107 (2006).
[24] H. Ishii, H. Kataura, H. Shiozawa, H. Yoshioka, H. Otsubo, Y. Takayama, T. Miyahara, S. Suzuki, Y. Achiba, M. Nakatake, T. Narimura, M. Higashiguchi, K. Shimada, H. Namatame, and M. Taniguchi,Nature (London) 426, 540 (2003).
[25] Y. Ohtsubo, J. I. Kishi, K. Hagiwara, P. Le Fèvre, F. Bertran, A. Taleb-Ibrahimi, H. Yamane, S. I. Ideta, M. Matsunami, K. Tanaka, and S. I. Kimura,Phys. Rev. Lett.115, 256404 (2015).
[26] K. Schönhammer and V. Meden, J. Electron Spectrosc. Relat. Phenom.62, 225 (1993).
[27] L. Markhof and V. Meden,Phys. Rev. B93, 085108 (2016). [28] J. Allen, G. Gweon, R. Claessen, and K. Matho,J. Phys.
Chem. Solids56, 1849 (1995).
[29] G.-H. Gweon, J. W. Allen, and J. D. Denlinger,Phys. Rev. B 68, 195117 (2003).
[30] F. Wang, J. V. Alvarez, S. K. Mo, J. W. Allen, G. H. Gweon, J. He, R. Jin, D. Mandrus, and H. Höchst,Phys. Rev. Lett. 96, 196403 (2006).
[31] A. Subedi,Phys. Rev. B92, 174501 (2015).
[32] W. L. Zhang, H. Li, D. Xia, H. W. Liu, Y. G. Shi, J. L. Luo, J. Hu, P. Richard, and H. Ding,Phys. Rev. B92, 060502(R) (2015).
[33] J. Hager, R. Matzdorf, J. He, R. Jin, D. Mandrus, M. A. Cazalilla, and E. W. Plummer,Phys. Rev. Lett.95, 186402 (2005).
[34] Y. Zhou, C. Cao, and F.-C. Zhang,arXiv:1502.03928v2.
[35] D. Ansermet, A. P. Petrovic, S. He, D. Chernyshov, M. Hoesch, D. Salloum, P. Gougeon, M. Potel, L. Boeri, O. K. Andersen, and C. Panagopoulos,ACS Nano10, 515 (2016). [36] A. P. Petrovic, D. Ansermet, D. Chernyshov, M. Hoesch, D. Salloum, P. Gougeon, M. Potel, L. Boeri, and C. Panagopoulos,Nat. Commun.7, 12262 (2016).
[37] A. P. Petrović, R. Lortz, G. Santi, M. Decroux, H. Monnard, O. Fischer, L. Boeri, O. K. Andersen, J. Kortus, D. Salloum, P. Gougeon, and M. Potel, Phys. Rev. B 82, 235128 (2010).
[38] Z. T. Tang, J. K. Bao, Y. Liu, Y. L. Sun, A. Ablimit, H. F. Zhai, H. Jiang, C. M. Feng, Z. A. Xu, and G. H. Cao,Phys. Rev. B91, 020506(R) (2015).
[39] Z.-T. Tang, J.-K. Bao, Z. Wang, H. Bai, H. Jiang, Y. Liu, H.-F. Zhai, C.-M. Feng, Z.-A. Xu, and G.-H. Cao, Sci. China Mater.58, 16 (2015).