The Application of Microsatellite Analysis in Barley
Malting Quality Breeding Programmes
Leona LEIŠOVÁ-SVOBODOVÁ
1, Lenka TOMKOVÁ
1, Tibor SEDLÁČEK
2,
Vratislav PSOTA
3and Ladislav KUČERA
11Crop Research Institute, Prague-Ruzyně, Czech Republic; 2Selton, Stupice, Czech Republic; 3Research Institute of Brewing and Malting, Prague, Czech Republic
Abstract
Leišová-Svobodová L., Tomková L., Sedláček T., Psota V., Kučera L. (2014): The application of microsatel-lite analysis in barley malting quality breeding programmes. Czech J. Genet. Plant Breed., 50: 268–277.
A set of 43 microsatellite loci was used to characterise the malting barley varieties and breeding lines used for the Protected Geographical Indication (PGI) “České pivo” (“Czech beer”) and for other beer types. Genotype data were compared with technological malting quality parameters. The analysis of variance showed significant differences between varieties used for the given PGI and varieties used for other beer types in six variables. Three clusters of varieties specific to the PGI and three clusters specific to malting barley genotypes for other beer types were identified using a Bayesian approach. The remaining four clusters expressed effects of parent lines. The discrimination analysis based on malting quality and molecular variables identified only one barley breeding line suitable for the PGI “České pivo””.
Keywords: “České pivo”; discriminant analysis; diversity; markers; SSR
Barley (Hordeum vulgare L.) is one of the most adapted plant species grown around the world. In the Czech Republic, barley takes up the fourth largest production area of all agricultural plants and is the fourth most important agricultural plant, mainly due to its use as the raw material for malt and subsequent beer production. Beer has hundreds of years of his-tory and the tradition of brewing has been passed from generation to generation. In the 19th century,
the type of beer designated as Czech or Pilsen was well established (Kosař et al. 2004). In 2008, the name “České pivo” was added to the list of products from the Czech Republic entered in the Register of Protected Designations of Origin and Protected Geographical Indications (Official Journal 2008). According to the Official Journal of the European Union, the distinctiveness of the protected geographi-cal indication (PGI) “České pivo” is based on many factors, including raw material (malt and hop) and special brewing procedure. Pale malt, also called “Pilsen malt”, made from two-row spring barley, is used for brewing České pivo (Psota 2008).
Quality requirements for malting barley are directly related to the processing efficiency and product qual-ity in the malting and brewing industries. The current requirements for the quality of malting barley dictate that only varieties possessing high enzymatic activ-ity, high content of extract and high values of final attenuation may be used. Barley varieties intended for the PGI “České pivo” production are characterised by a lower level of proteolysis, cytological changes leading to cleavages and attenuation, resulting in the presence of residual extract in the final product (Kosař et al. 2004; Psota 2008).
analyses of malting quality have been reported for different germplasm combinations (Ayoub et al.
2002; Emebiri et al. 2004; Walker et al. 2013; and many others). Microsatellites very often used in QTL mapping are simple sequence repeats (SSR) interspersed ubiquitously in eukaryotic genomes. The main advantages of SSR are the following: high levels of polymorphisms and information content; unambiguous designation of alleles; selectively neu-tral markers; high reproducibility; codominance; and simple assaying of genotypes. SSR have been used extensively for genome mapping and cultivar identification (Goldstein & Schlötterer 1999; Pillen et al. 2000).
Gianinetti et al. (2005) proposed a system of malting quality evaluation based on only a few traits, depending on environmental conditions as little as possible. This system was intended for breeders for line testing in early generations of the selection pro-cess. The same method of discriminant analysis was used for discrimination between barley germplasms suitable for PGI “České pivo” (group C) and for other conventional beers (group E). Several hypotheses were tested in this study: (a) whether there is any difference in the allelic composition of microsatellites between the two groups of barley varieties (C, E); (b) if yes, whether it is possible to use microsatellite analysis to choose breeding lines during the selection process. To address these hypotheses, fifty breeding lines were analysed.
MATERIAL AND METHODS
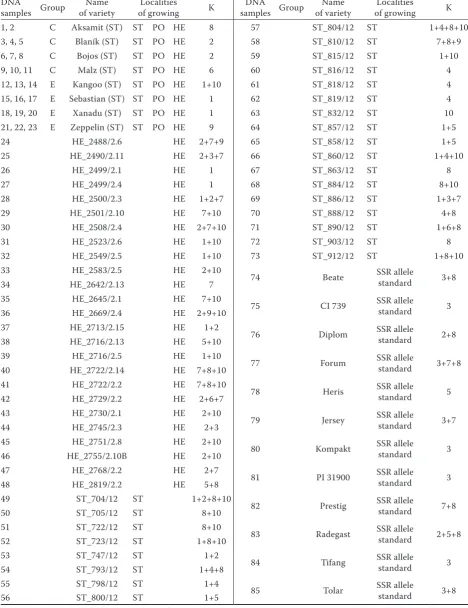
Plant material and DNA extraction. Twenty barley varieties and 50 breeding lines were chosen for this study (Table 1). Four barley varieties previously clas-sified into group C (PGI “České pivo”), four varieties belonging to group E (other malting barley) and 12 va-rieties used only for genotyping studies were selected as standards of SSR alleles. Barley varieties classified into group C and E were grown in three localities (Table 1). Harvested seed samples were sent to the Research Institute of Brewing and Malting , Prague (RIBM) for the determination of technological parameters and to the Crop Research Institute in Prague (RICP), where genotyping was performed. Breeding lines and allele standards were classified as group O.
In RICP, plants were grown in greenhouse condi-tions and approximately 30 plants per accession were pooled and frozen at –80°C. Genomic DNA was extracted using CTAB detergent (Saghai-Ma-roof et al. 1984). The quality and concentration of
DNA were verified using agarose gel electrophoresis. A λ HindIII (Fermentas, Lithuania) marker was used as a size and concentration standard.
Micromalting protocol and technological pa-rameter determination. Technological parameters were determined in malt and sweet wort according to the EBC (2009) and MEBAK (2011) methods. The malting schedule consisted of an initial wash for 15 min. to remove surface dust from the barley kernel followed by a 5-hour steep on the first day, 4-hour steep on the second day, and a third day of spraying or steeping to reach a grain water content of 45.5%. Water and air temperature during the air interval was held at 14.5°C. The barley then under-went germination for 144 h at a temperature of 14.5°C with constant air passing through revolving drums. Kilning was performed in a one-floor electrically heated kiln for 22 h. Pre-kilning was carried out at 55°C and kilning at a temperature of 80°C for 4 h. Technological parameters, namely the protein content of the barley grain (Pb, in %), extract of malt (E, in %), Kolbach index (KI, in %), diastatic power (DP, in WK), apparent final attenuation (AFA, in %), friability (F, in %), percent partly unmodified grains (PUG, in %), β-glucan content in wort (BGw, in mg/dm3),
colour of malt (Cw, in EBC units) and viscosity of wort (Vw, in mPa·s) were measured according to EBC (2009) and the relative extract at 45°C (VZ 45, in %) according to MEBAK (2011) and bulk density of barley (Bdb in g/l).
Microsatellite analysis. A set of 43 microsatel-lite markers was chosen from several publications (Becker & Heun 1995; Liu et al. 1996; Russel et al. 1997; Ramsay et al. 2000) to allow at least four microsatellite loci per chromosome. PCR reactions with fluorescently labelled primers (6-fam, vic, ned and pet) were performed in a reaction volume of 15 μl consisting of 1U of Tth polymerase (Biotools, Madrid, Spain), 1× PCR buffer, 2mM of MgCl2, 0.25mM of each dNTP, and 0.33μM of each primer. Reactions were performed in a Labcycler (SensoQuest, Goettin- gen, Germany). Amplification products were analysed using capillary electrophoresis on an ABI PRISM 3130 genetic analyser (Applied Biosystems, Foster City, USA). A multiplexed configuration of four reactions was used in one analysis. LIZ500 (Applied Biosystems) was used as a size standard. Electrophoretograms were processed by GeneMapper software (Applied Biosystems).
Table 1. Barley varieties and lines used in the study
DNA
samples Group of varietyName of growingLocalities K samples GroupDNA of varietyName of growingLocalities K 1, 2 C Aksamit (ST) ST PO HE 8 57 ST_804/12 ST 1+4+8+10 3, 4, 5 C Blaník (ST) ST PO HE 2 58 ST_810/12 ST 7+8+9 6, 7, 8 C Bojos (ST) ST PO HE 2 59 ST_815/12 ST 1+10 9, 10, 11 C Malz (ST) ST PO HE 6 60 ST_816/12 ST 4 12, 13, 14 E Kangoo (ST) ST PO HE 1+10 61 ST_818/12 ST 4 15, 16, 17 E Sebastian (ST) ST PO HE 1 62 ST_819/12 ST 4 18, 19, 20 E Xanadu (ST) ST PO HE 1 63 ST_832/12 ST 10 21, 22, 23 E Zeppelin (ST) ST PO HE 9 64 ST_857/12 ST 1+5
24 HE_2488/2.6 HE 2+7+9 65 ST_858/12 ST 1+5
25 HE_2490/2.11 HE 2+3+7 66 ST_860/12 ST 1+4+10
26 HE_2499/2.1 HE 1 67 ST_863/12 ST 8
27 HE_2499/2.4 HE 1 68 ST_884/12 ST 8+10
28 HE_2500/2.3 HE 1+2+7 69 ST_886/12 ST 1+3+7
29 HE_2501/2.10 HE 7+10 70 ST_888/12 ST 4+8
30 HE_2508/2.4 HE 2+7+10 71 ST_890/12 ST 1+6+8
31 HE_2523/2.6 HE 1+10 72 ST_903/12 ST 8
32 HE_2549/2.5 HE 1+10 73 ST_912/12 ST 1+8+10
33 HE_2583/2.5 HE 2+10
74 Beate SSR allele standard 3+8
34 HE_2642/2.13 HE 7
35 HE_2645/2.1 HE 7+10
75 CI 739 SSR allele standard 3 36 HE_2669/2.4 HE 2+9+10
37 HE_2713/2.15 HE 1+2
76 Diplom SSR allele standard 2+8 38 HE_2716/2.13 HE 5+10
39 HE_2716/2.5 HE 1+10
77 Forum SSR allele standard 3+7+8 40 HE_2722/2.14 HE 7+8+10
41 HE_2722/2.2 HE 7+8+10
78 Heris SSR allele standard 5 42 HE_2729/2.2 HE 2+6+7
43 HE_2730/2.1 HE 2+10
79 Jersey SSR allele standard 3+7
44 HE_2745/2.3 HE 2+3
45 HE_2751/2.8 HE 2+10
80 Kompakt SSR allele standard 3 46 HE_2755/2.10B HE 2+10
47 HE_2768/2.2 HE 2+7
81 PI 31900 SSR allele standard 3 48 HE_2819/2.2 HE 5+8
49 ST_704/12 ST 1+2+8+10
82 Prestig SSR allele standard 7+8
50 ST_705/12 ST 8+10
51 ST_722/12 ST 8+10
83 Radegast SSR allele standard 2+5+8
52 ST_723/12 ST 1+8+10
53 ST_747/12 ST 1+2
84 Tifang SSR allele standard 3
54 ST_793/12 ST 1+4+8
55 ST_798/12 ST 1+4
85 Tolar SSR allele standard 3+8
56 ST_800/12 ST 1+5
product, binary data matrices were built. A dissimilar-ity matrix was computed with DARwin software using the Jaccard coefficient (Perrier et al. 2003; Perrier & Jacquemoud-Collet 2006). A dendrogram was constructed using an unweighted neighbour joining method. Bootstrap analysis with 2000 replicates was performed to estimate the robustness of a tree. The degree of the subdivision of the two groups of barley genotypes was measured by Wright’s fixation index (Fst). An exact test for population differentiation was calculated using the Tools for Population Genetic Analyses (TFPGA; version 1.3; Miller 1997) with 10 000 permutation steps.
Another approach to studying genetic diversity is based on Bayesian statistics. The Structure ver-sion 2.3.4 software (Pritchard et al. 2000) was used to determine the genetic architecture of barley genotypes. Ten independent runs of 1–20 groups (K = 1–20) were performed using 10 000 Markov chain iterations after a burn-in period of 10 000 iter- ations. The number (K) of clusters into which the sample data (X) were fitted with posterior prob-ability Pr (X|K) was estimated using a model with admixture and correlated allele frequency (Falush
et al. 2003). The optimal value of K was estimated based on ln(K) and on the ΔK calculation, which considers the rate of change in the lnP(D) values among successive K runs to account for patterns of dispersal that are not homogeneous among popula-tions (Evanno et al. 2005).
ANOVA and discriminant analysis were performed using Statistica software (StatSoft, Prague, Czech Republic). Before analysis, arcsin transformation of the data given in percentages was performed. The discriminant power of the proposed model was then tested by Wilks’ criterion λ. The classification of the samples into groups was performed on the basis of their Mahalanobis distance and a posteriori probabilities.
RESULTS AND DISCUSSION
Several quality parameters have been used for the evaluation of malting barley. In this study, malting technological parameters and microsatellite analysis were followed by 58 barley accessions.
Genotyping analysis was performed on four barley varieties from group C and four varieties from group E grown in three localities, together with 50 breeding lines and 12 microsatellite allele standards (Table 1). In total, 86 samples were analysed. Microsatellite analysis was carried out with 43 microsatellite loci.
At least three microsatellite markers were chosen per chromosome. The total number of alleles per locus ranged from 1 to 11, with an average of 5.5 alleles per locus. This level of barley collection genetic variability is rather low. It is even lower than in a previous study in which an average of 12.6 alleles per locus was found (Leišová et al. 2007). This indicates that the breeding process pointed only to selected features, which leads to a decrease in the genetic diversity, as previously mentioned (Vellvé 1993).
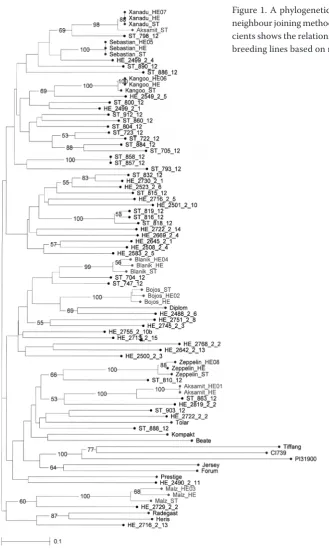
While each of the barley varieties, Bojos, Malz, Blanik, Sebastian, Kangoo, Xanadu and Zeppelin, always showed the same microsatellite allele com-position regardless of the growing locality, Aksamit grown in Stupice differed a lot in allele composition. As this was most likely the result of sample confusion, this item was omitted from the subsequent analyses.
Cluster analyses based on the microsatellite data of barley genotypes is given in Figure 1. There are five main clusters with low bootstrap support (< 50%). While the main clusters are not statistically sig-nificant, each of the barley varieties declared as group C or E, and several other barley genotypes, form clusters with high bootstrap support (Figure 1). Varieties Bojos and Blaník occur in one cluster and Xanadu, Sebastian and Kangoo are involved in an-other cluster. On the an-other hand, Aksamit occurs in a cluster together with Zeppelin and with those of allele standards showing a good resistance to several fungal pathogens.
in the relative extract at 45°C and the β-glucan in wort that are the least affected by locality and year (Dráb et al. 2013). The relative extract at 45°C in-dicates the level of proteolytic modification and it is an important feature especially in Central Europe (Psota & Kosař 2002).
The genetic structure of barley genotypes was also evaluated using a Bayesian approach as implemented by the Structure software to find the number of
di-verged groups hidden in the data. According to the ΔK value, ten clusters (K = 10) were identified within the studied set of barley genotypes. The mean value of α was 0.059, indicating that most of the barley genotypes are homogeneous. In other words they belong genetically to only one cluster (Falush et al.
[image:5.595.72.402.79.628.2]2003). Based on the proportion of the membership of each population in each of the 10 clusters, clusters 2, 6 and 8 consisted of barley varieties C (Aksamit,
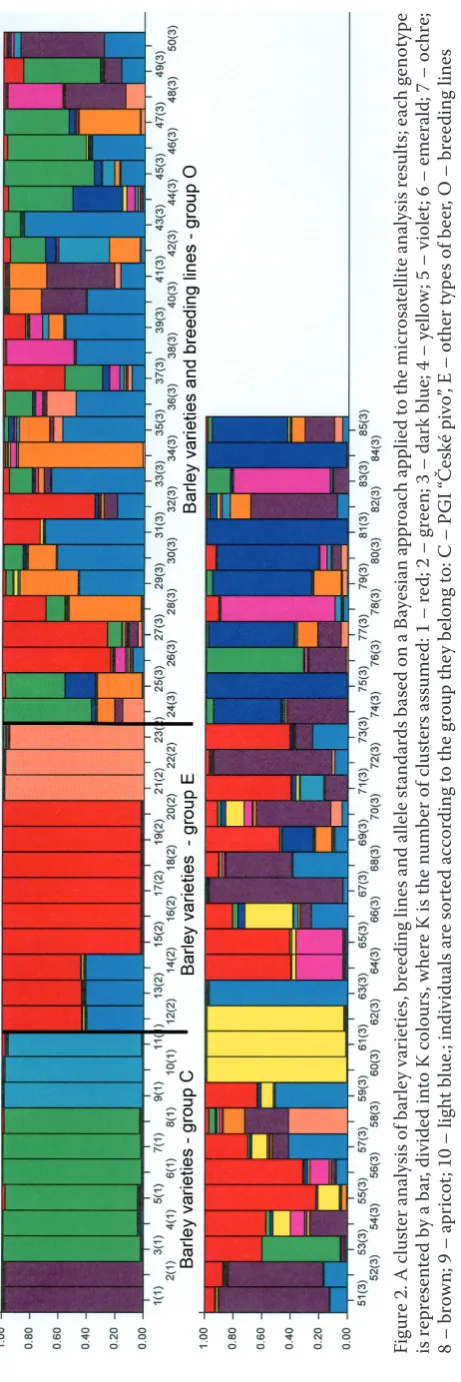
Blanik, Bojos and Malz) with an incidence of more than 0.10 (Table 3). Clusters 1, 9 and 10 included barley varieties from group E (Kangoo, Sebastian, Xanadu and Zeppelin). Cluster 3 is represented by barley material used as a source of resistances (CI739, PI31900 and Tiffang). In our experiment, these were used as standards of alleles. Genetic sources presented in clusters 4, 5 and 7 remain unknown. While the barley varieties appeared to be genetically uniform in this experimental configuration, barley breeding material appears to be a mixture of mostly parental genotypes (Figure 2). Breeding programs usually involve more than one intention, including breed-ing for quality, for yield, for different resistance to diseases, and other factors. That is why breeding lines can be a mixture of parental genotypes other
than those classified into group C or E. A similar hidden genetic structure was found, for example, in the Chrysoporthe cubensis population (Van der Merwe et al. 2010).
[image:6.595.67.531.100.322.2]The expected heterozygosity between individuals within the same cluster ranged from 0.01 to 0.25, with an average of 0.074 (Table 3). Figure 2 represents the cluster analysis of all individuals in the three popula-tions (C, E and O) with K = 10. This analysis shows a limited admixture among barley varieties in groups C and E and a higher level of admixture among breeding lines and other varieties used as standards of alleles (Figure 2). Table 3 also shows FST values of each inferred cluster. Except for cluster 3 (FST = 0.01), all the clusters showed very high differentiation, which indicates the presence of genetically diverged groups in the data.
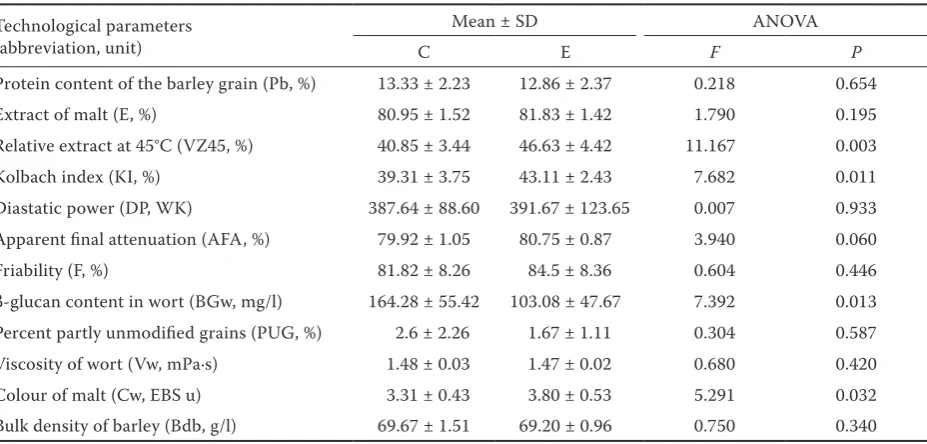
Table 2. Differences in average values of malting quality technological parameters of group C and E of barley varieties
Technological parameters (abbreviation, unit)
Mean ± SD ANOVA
C E F P
Protein content of the barley grain (Pb, %) 13.33 ± 2.23 12.86 ± 2.37 0.218 0.654 Extract of malt (E, %) 80.95 ± 1.52 81.83 ± 1.42 1.790 0.195 Relative extract at 45°C (VZ45, %) 40.85 ± 3.44 46.63 ± 4.42 11.167 0.003 Kolbach index (KI, %) 39.31 ± 3.75 43.11 ± 2.43 7.682 0.011 Diastatic power (DP, WK) 387.64 ± 88.60 391.67 ± 123.65 0.007 0.933 Apparent final attenuation (AFA, %) 79.92 ± 1.05 80.75 ± 0.87 3.940 0.060 Friability (F, %) 81.82 ± 8.26 84.5 ± 8.36 0.604 0.446 β-glucan content in wort (BGw, mg/l) 164.28 ± 55.42 103.08 ± 47.67 7.392 0.013 Percent partly unmodified grains (PUG, %) 2.6 ± 2.26 1.67 ± 1.11 0.304 0.587 Viscosity of wort (Vw, mPa·s) 1.48 ± 0.03 1.47 ± 0.02 0.680 0.420 Colour of malt (Cw, EBS u) 3.31 ± 0.43 3.80 ± 0.53 5.291 0.032 Bulk density of barley (Bdb, g/l) 69.67 ± 1.51 69.20 ± 0.96 0.750 0.340
SD – standared deviation
Table 3. The proportion of membership of each predefined population in each of the 10 clusters computed using a Ba-yesian approach to the results of the barley microsatellite analysis
Population No. of individuals Clusters
1 2 3 4 5 6 7 8 9 10
Varieties C 11 0.01 0.53 0.00 0.00 0.00 0.27 0.00 0.18 0.00 0.01 E 12 0.63 0.00 0.00 0.01 0.00 0.00 0.00 0.00 0.25 0.10 Breeding lines 62 0.17 0.11 0.12 0.07 0.07 0.02 0.08 0.15 0.03 0.18 FST 85 0.79 0.74 0.01 0.92 0.89 0.90 0.55 0.66 0.96 0.91 h 85 0.05 0.06 0.25 0.02 0.06 0.03 0.14 0.09 0.01 0.03
[image:6.595.64.532.613.727.2]Discriminant analysis is a classification method used to identify to which of a set of categories a new observation belongs. The purpose of the analysis in our study was to learn how breeding material could be distinguished in the three groups of barley genotypes (C, E and O) based on the technological parameters and microsatellite analysis data.
First, a model with only eight barley varieties with known membership in the two groups C and E and with only technological parameters was built. Highly correlated variables (r ≥ 0.9) were left out. Out of the original 28 malting quality parameters, 18 were used in the next step of the analysis. Using a forward stepwise method, the following seven variables were added to the model: relative extract at 45°C, protein content in barley grain, final attenuation, β-glucan content in wort, bulk density of barley, viscosity of wort and partly unmodified grains. Wilks’ λ value of 0.036 indicates the good discriminatory power of the model. The least value of partial Wilks’ λ indicated that the variable relative extract at 45°C contributes most to the overall discrimination.
The proposed model was used in a second analysis where all varieties of all breeding lines were included in the evaluation. Given that the impact of non-malting genotypes was largely found in breeding lines, they were pre-classified as group O. First, the results of only the technological parameters were used. After the application of a forward stepwise method, the six variables mentioned above, except partly unmodified grains, remained in the model (VZ 45, Pb, AFA, BGw, Bdb, Vw). Wilks’ λ increased to a value of 0.206. Discriminant functions (roots) computed by canonical analysis were considered statistically significant (root 1: χ2 = 106.75; P < 0.001;
root 2: χ2 = 14.34; P = 0.014) but root 2 had much
less discriminatory power. These results were visual-ised as a scatterplot of canonical scores (Figure 3a). The first discriminant function (root) discriminates between the varieties and breeding lines, and the second function provides discrimination between the barley genotypes of group C and E, but with less discriminatory power. These results were confirmed by further classification based on the Mahalanobis distances and posterior probabilities (Table 4). De-spite breeding lines that were correctly classified into group O (100%), the percentage of well-classified barley varieties in class E was as low as 58%.
In the next analysis, the posterior probabilities data from the individual categorisation into 10 clusters computed by the Structure software were added. This approach has already been used by Gutierrez et al.
Fig
ur
e 2. A c
lu
st
er analy
sis of b
ar le y v ar ie tie s, br ee ding line
s and alle
le st
and
ar
ds b
as
ed on a B
aye sian a ppr oac h a pplie d t o t he mic ro sa te llit e analy sis r esult s; e ac h genoty pe is r epr es en te
d by a b
ar
, div
ide
d in
to K c
olours
, wher
e K i
s t
he n
umb
er of c
lu
st
ers a
ssume
d: 1 – r
ed; 2 – g
re
en; 3 – d
ar
k blue; 4 – ye
llow
; 5 – v
iole
t; 6 – emerald; 7 – o
chr
e;
8 – br
ow
n; 9 – a
pr
ic
ot
; 10 – lig
ht blue.; indiv
idu al s ar e s or te d ac cor ding t o t he g roup t he y b elong t
o: C – P
GI “
Če
sk
é pivo
”, E – ot
her ty
pe
s of b
eer
, O – br
ee
ding line
[image:7.595.62.293.79.771.2](2011), who compared the results of technological parameters with SNP analysis to perform association mapping of barley malting quality. The discriminant function obtained by the forward stepwise method contains the following 11 variables: Pb, VZ45, BGw, Vw, PUG and clusters K1, K2, K5, K6, K8, and K9. Wilks’ λ increased to a value of 0.056. Both discrimi-nant functions (roots) were considered statistically significant (root 1: χ2 = 187.41; P < 0.001; root 2:
χ2 = 82.57; P < 0.001). Figure 3b shows a scatterplot
of two canonical scores. The three clusters cor-respond well to the three input groups. Using both roots, it is possible to discriminate between the barley genotypes of group C and E. Further clas-sification based on the Mahalanobis distances and posterior probabilities (Table 4) proved the original classification of the barley varieties (Table 4). Only one misclassification was found in the breeding line ST704-12, which was classified by the model into group C, and thus, as suitable for PGI “České pivo”. Based on the a posteriori probabilities, except for ST704-12 (91.1%), only one breeding line ST747-12 is closer (6.7%) to group C. The three breeding lines HE2499-2.1, ST886-12 and ST912-12 come close to being classified into group E with probabilities of 1.9%, 1.6%, and 4.8%, respectively.
Breeding for malting quality is difficult work, as many parameters must be tested. Many of them are highly correlated and give redundant information (Nielsen & Munck 2003). Moreover, they are often influenced by environmental factors and by technologi-cal treatment (Fox et al. 2003). Discriminant analysis can be a method for selecting the most suitable set of variables for distinguishing between selected features
[image:8.595.70.534.84.267.2](Gianinetti et al. 2005). In our study, discriminant analysis was employed to distinguish between barley genotypes suitable or unsuitable for PGI “České pivo”. In conclusion, discriminant functions distinguishing between groups C, E and non-malting barleys were found. The model places weight on traits with low levels of environmental variability, including molecu-lar markers that are not impacted by environmental factors. The structure analysis of genotyping data provided information about the genetic composition
Table 4. Classification matrices; a classification matrix ba-sed on the malting technological parameters only (a) and a classification matrix based on the malting technological parameters and molecular data (b)
Group Percent correct P = 0.151C P = 0.164E P = 0.685O
Malting technological parameters only
C 72.73 8 0 3
E 58.33 1 7 4
O 100.00 0 0 50
Total 89.04 9 7 57
Malting technological parameters and molecular data
C 100.00 11 0 0
E 100.00 0 12 0
O 98.00 1 0 49
Total 98.63 12 12 49
[image:8.595.304.531.517.699.2]Rows contain the observed classification; columns include the predicted classification; C – protected geographical indications (PGI) “České pivo”; E – other types of beer; O – breeding lines
of the barley genotypes studied. Although only one promising breeding line was found, the model is ready for use in future barley breeding programmes.
Acknowledgements. This work was supported by Ministry of Agriculture of the Czech Republic, Projects No. QJ1310091 and MZe-RO0414. The authors thank H. Udavská for ex-cellent technical assistance.
References
Ayoub M., Symons S.J., Edney M.J., Mather D.E. (2002): QTLs affecting kernel size and shape in a two-rowed by six-rowed barley cross. Theoretical and Applied Genet-ics, 105: 237–247.
Becker J., Heun M. (1995): Barley microsatellites: allele variation and mapping. Plant Molecular Biology, 27: 835–845.
Dráb Š., Psota V., Frančáková H., Sachambula L., Hart-mann J., Tokár M. (2013): Dependence of malt quality on the variety and year. Kvasný Průmysl, 59: 182–188. EBC (2009): Analytika-EBC.3 Barley: 3.2.2 Total nitrogen
of barley: Dumas combustion Metod; 4 Malt: 4.5.1 Ex-tract of malt: Congress mash, 4.9.3 Soluble nitrogen of malt: Dumas combustion, 4.11.1 Fermentability, Final attenuation of laboration wort from malt, 4.12 Diastatic power of malt, 4.15 Friability, glassy corns and unmodi-fied grains of malt by friabilimeter, 4.16.2 High molecular weight β-glucan content of malt: Fluorimetric method. Getränke-Fachverlag Hans Carl, Nürnberg.
Emebiri L.C., Moody D.B., Panozzo J.F., Read B.J. (2004): Mapping of QTL for malting quality attributes in barley based on a cross of parents with low grain protein con-centration. Field Crop Research, 87: 195–205.
Evanno G., Regnaut S., Goudet J., (2005): Detecting the number of cluster of individuals using the software Structure: a simulation study. Molecular Ecology, 14: 2611–2620.
Falush D., Stephens M., Pritchard J.K. (2003): Inference of population structure using multilocus genotype data: Linked loci and correlated allele frequencies. Genetics,
164: 1567–1587.
Fox G.P., Panozzo J.F., Li C.D., Lance R.C.M., Inkerman P.A., Henry R.J. (2003): Molecular basis of barley quality. Australian Journal of Agricultural Research, 54: 1081–1101. Gianinetti A., Toffoli F., Cavallero A., Delogu G.,
Stanca A.M. (2005): Improving discrimination for malt-ing quality in barley breedmalt-ing programmes. Field Crop Research, 94: 189–200.
Goldstein D.B., Schlötterer C. (1999): Microsatellites: evolution and applications. Oxford University Press, London.
Gutiérrez L., Cuesta-Marcos A., Castro A.J., Zitze-witz J., Schmitt M., Hayes P.M. (2011): Association mapping of malting quality quantitative trait loci in winter barley positive signals from small germplasm arrays. Plant Genome, 4: 256–272.
Hayes P.M., Liu B.H., Knapp S.J., Chen F., Jones B., Blake T.K., Franckowiak G., Rasmusson D., Sorrells M., Ullrich S.E., Wesenberg D., Kleinhofs A. (1993): Quantitative trait locus effects and environmental inter-action in a sample of North American barley germplasm. Theoretical and Applied Genetics, 87: 392–401. Kosař K., Psota V., Mikyška A. (2004): Barley varieties
suitable for production of the Czech-type beer. Czech Journal of Genetics and Plant Breeding, 40: 137–139. Leišová L., Kučera L., Dotlačil L. (2007): Genetic
re-sources and oat characterised by microsatellites. Czech Journal of Genetics and Plant Breeding, 43: 97–104. Liu Z.W., Biyashev R.M., Saghai Maroof M.A. (1996):
Development of simple sequence repeat DNA markers and their integration into a barley linkage map. Theoreti-cal and Applied Genetics, 93: 869–873.
MEBAK (2011): Raw material. Malz: 3.1.4.11 Maisch-methode nach Hartong-Kretschmer VZ 45°C. Mit-teleuropäischen Brautechnischen Analysenkommission, Freising-Weihenstephan.
Miller M.P. (1997): TFPGA -– Tools for Population Ge-netic Analysis, Version 1.3. Northern Arizona University, Flagstaff.
Molina-Cano J.L., Francesch M., Perez A.M., Ramo T., Voltas J., Brufau J. (1997): Genetic and environmental variation in malting and feed quality of barley. Journal of Cereal Science, 25: 37–47.
Nielsen J.P., Munck L. (2003): Evaluation of malting barley quality using exploratory data analysis I. Extraction of information from micro-malting data of spring and winter barley. Journal of Cereal Science, 38: 173–180.
Official Journal C16 23.1.2008: http://eur-lex.europa.eu/ LexUriServ/LexUriServ.do? uri=OJ:C:2008:016:0014:0 022:CS:pdf
Official Journal L276 17.10.2008: http://eur-lex.europa. eu/LexUriServ/LexUriServ.do? uri=OJ:C:2008:276:002 7:0028:CS:pdf
Perrier X., Jacquemoud-Collet J.P. (2006): DARwin software. Available at http://darwin.cirad.fr/ darwin Perrier X., Flori A., Bonnot F. (2003): Data
analy-sis methods. In: Hamon P., Seguin M., Perrier X., Glaszmann J.C. (eds): Genetic Diversity of Cultivated Tropical Plants. Enfield Science Publishers, Montpel-lier, 43–76.
differentiating German barley cultivars. Theoretical and Applied Genetics, 101: 652–660.
Pritchard J.K., Stephens M., Donnelly P. (2000): Infer-ence of population structure from multilocus genotype data. Genetics, 155: 945–959.
Psota V. (2008): Historical and current varieties of spring barley, varieties suitable for “České pivo”. Kvasný Průmysl,
54: 326–331.
Psota V., Kosař K. (2002): Malting quality index. Kvasný Průmysl, 48: 142–148.
Ramsay L., Macaulay M., Ivanissevich S., MacLean K., Cardle L., Fuller J.,, Edwards K.J. Tuvesson S., Mor-gante M., Massari A., Maestri E., Marmirolli N., Sjakste T., Ganal M., Powell W., Waugh R. (2000): A simple sequence repeat-based linkage map of barley. Genetics, 156: 1997–2005.
Russell J., Fuller J., Young G., Thomas B., Tarami-no G., Macaulay M., Waugh R., Powell W. (1997): Discriminating between barley genotypes using micros-atellite markers. Genome, 40: 442–450.
Saghai-Maroof M.A., Soliman K.M., Jorgensen R.A., Allard R.W. (1984): Ribosomal DNA spacer-length polymorphisms in barley: Mendelian inheritance, chro-mosomal locations, and population dynamics. Proceeding of the National Academy of Sciences of the United States of America, 81: 8014–8018.
Van der Merwe N., Gryzenhout M., Steenkamp E.T., Wingfield B.D., Wingfield M.J. (2010): Multigene phylogenetic and population differentiation data confirm the existence of a cryptic species within Chrysoporthe cubensis. Fungal Biology, 114: 966–979.
Vellvé R. (1993): The decline of diversity in European agriculture. Ecologist, 23: 64–69.
Walker C.K., Ford R., Amatriaín M.M., Panozzo J.F. (2013): The detection of QTLs in barley associated with endosperm hardness, grain density, grain size and malting quality using rapid phenotyping tools. Theoretical and Applied Genetics, 126: 2533–2551.
Received for publication March 26, 2014 Accepted after corrections August 6, 2014
Corresponding author: