Effect of Row Width on Splash Erosion and Throughfall
in Silage Maize Crops
Václav BRANT
1*, Petr ZÁBRANSKÝ
1, Michaela ŠKEŘÍKOVÁ
1, Jan PIVEC
1,
Milan KROULÍK
2and Luděk PROCHÁZKA
11Faculty of Agrobiology, Food, and Natural Resources and 2Faculty of Engineering,
Czech University of Life Sciences Prague, Prague, Czech Republic *Corresponding author: [email protected]
Abstract
Brant V., Zábranský P., Škeříková M., Pivec J., Kroulík M., Procházka L. (2017): Effect of row width on splash erosion and throughfall in silage maize crops. Soil & Water Res., 12: 39−50.
Line width is one of the major factors affecting arable soil erosion. The aim of the study was to assess the effects of different row spacing on splash erosion and throughfall in maize crops. Field measurements of the throughfall (Pth, mm) and splash erosion (MSR, g/m2) were carried out in silage maize crops (row spacing 0.45 and 0.75 m) in 2012–2014. The BBCH growth stages for the crops, plant length (L, m), and leaf area index (LAI) were evaluated. Positive correlation was observed between the aerial precipitation (P, mm) and the Pth values. With increasing
P-values, higher levels of Pth were identified in the 0.75 m compared to the 0.45 m row spacing. The value of this proportion was decreasing from the centre of the inter-row (0.75 m) to the row of the plants direction. Statisti-cally significant lower values of splash erosion were observed in the 0.45 m compared with the 0.75 m wide rows, especially within the years 2012 and 2014. The experiments proved the positive influence of the length of plants and LAI on P/Pthvalues. A decrease of Pth in relation to precipitation values with height of plants and LAI values was observed. This dependency was then confirmed from the beginning of the stem elongation (BBCH 30) to the end of flowering (BBCH 70). Tighter dependency between the plant length (L) and the values of P/Pth ratio in the 0.75 m wide crop rows was determined. Conversely, a more important influence of LAI on the values of P/Pth ratio was estimated in the 0.45 m wide crop rows. The experiments proved the positive influence of the 0.45 m wide rows on the decrease of splash erosion as well as throughfall compared with the 0.75 m row spacing.
Keywords: erosion; growth stage; leaf area index; plant length; precipitation
Line width is one of the major factors affecting the production of corn grain (Johnson et al. 1998; Barbieri et al. 2000; Farnham 2001) and corn silage biomass (Uppenkamp 2007; Nübel 2008). Narrow rows are primarily associated with higher radiation interception by corn crops (Ottman & Welch 1989; Andrade et al. 2002). Narrow rows (0.35 m) can cause higher values of evapotranspiration compared with wider crop rows (0.75 m), depending on the moisture conditions (Barbieri et al. 2008).
Maize is generally considered the most vulnerable crop to soil erosion. Soil erosion is one of the most serious environmental and public health problems facing human society (Pimentel 2006). Soil ero-sion is generally dependent on the soil type and
texture, rainfall characteristics, topography, soil and crop management, and soil conservation practices (Hudson 1995).
of stones, clods, and crop residues at the soil surface (Wainwright 1996; Morgan 2005).
Generally, it is believed that reducing the maize lines width contributes to water erosion risk reduc-tion (Uppenkamp 2007; Nübel 2008; Mohammadi et al. 2012). In Germany, crops grown in row spac-ings ≤ 0.45 m, including maize, are not considered as wide-row crops. Then, they apply the less stringent criteria for growing on land at risk of erosion (LfL 2010). A narrower line contributes to the increase of soil protection, diminishing water runoff and soil erosion (Mannering & Johnson 1969; Sangoi &
Salvador 1998). Corn row spacing (0.51, 0.76, and 1.02 m) had little effect on ground cover or erosion during the first 5 weeks after planting. At 7 to 8 weeks, ground cover was increased slightly and the narrow (0.51 m) line spacing reduced erosion (Mannering
& Johnson 1969). Zábranský et al. (2013) proved that lines width reduction in maize from 0.75 to 0.45 m resulted in a decrease in throughfall values, and can contribute to the elimination of splash ero-sion. Brückler et al. (2004) determined the highest values of throughfall (under natural and artificial conditions – precipitation/irrigation) in the half distance only between the lines of corn cultivated in 0.75 m rows. The authors further state that the highest values of infiltration were measured directly in the rows of plants, the lowest at the distance of 70–136 mm from the lines of plants. Dekker and Ritsema (1997) point out the significant variabil-ity of soil volumetric water content in maize crops cultivated in 0.75 m rows. Due to interception and stem flow, water is funnelled towards the roots, and thus concentrates in the maize rows. However, dis-tinctive wetting patterns were also formed between the maize rows, caused by rainwater dripping to the ground from overhanging leaves. The influence of distribution of rainfall on the soil volumetric water content in maize crops was also confirmed by
Hu-pet and Vanclooster (2005) and Martello et
al. (2015). Micro-topographical depressions further concentrate dripping water. The difference in the elevation between the top of the row and the bot-tom of the inter-row was about 70 mm (Dekker &
Ritsema 1997). Miole et al. (2011) reported that depths of stemflow and throughfall were slightly higher in the narrow spacing treatment. Mean ratios of throughfall to incident precipitation or irrigation are highly variable depending on the crop variability (Quinn & Laflen 1983; Parkin & Codling 1990; Bui & Box 1992; Paltineanu & Starr 2000). De
Moraes Frasson and Krajewski (2011, 2013) state that knowledge of the concentration of drops and their size distribution on the throughfall is also important in the future development of microwave-based sensors to measure the evolution of plant water storage and soil moisture during storms.
In addition to throughfall, the erosion processes are influenced by the stem flow (Neave & Abra-hams 2002). According to Bui and Box (1992), up to one-third of the stem flow may contribute to the formation of surface runoff. A positive correlation was confirmed between the amount of rainfall (inde-pendent variable) and throughfall and the stem flow values of corn plants (Paltineanu & Starr 2000). These authors also point out the fact that at lower precipitation, the ratio of stem flow to throughfall increases. Hence, with an increase in precipitation the value of this ratio decreases. The stemflow of maize increases linearly with the total rainfall amount (Liu et al. 2015).
The aim of the study was to assess the effects of different row-spacing on the splash erosion and throughfall in maize crops. Data on the determination of the dependence between the values of throughfall and splash erosion are very limited in the scientific literature. The following objectives were set: (a) to determine the effect of different maize row width on the value of splash erosion during the vegetation period, (b) to determine the variability of throughfall within the rows, (c) to determine the relationship between the splash erosion and throughfall, (d) to determine the effect of the crop height and leaf area index on throughfall.
MATERIAL AND METHODS
out using a shallow cultivator in one day of sowing. The sowing dates, number of plants per ha, and aver-age distance between plants are documented in Table 1. A six-line seed driller (Kverneland Accord Optima HD; Kverneland Group, Klepp Stasjon, Norway) was used for sowing (row width 0.45 and 0.75 m). Plant protection and fertilization were identical on both surfaces. The plots were not irrigated.
Values of splash erosion were monitored using a method according to Bollinne (1975). Funnels with collection bottles (volume 0.5 l) were installed in the centre of maize inter-rows. Plastic funnels (body diameter 125 mm, outlet diameter 25 mm) were placed 4 mm above the soil surface (flooding prevention) as shown in Figure 1. A sieve (mesh size of 2 × 2 mm) eliminating the trapping of small mammals and insects into the container was placed between the bottle and the funnel. After every rain-fall event with precipitation totals exceeding 2 mm soil sampling followed. Captured suspension was filtered and dried to constant weight. The soil in the funnel was then expressed as a real number of
spray per unit area of soil (MSR g/m2), using the
algorithm according to Poesen and Torri (1988). Five collection funnels for the evaluation of splash erosion were located on each plot. At the end of the vegetation period, the stability of soil aggregates in trial plots (SAS) was also assessed using a wet siev-ing apparatus (Ejkelkamp, Giesbeek, NL) accordsiev-ing to the manufacturer’s methodology. An average soil sample was made from each replication of the vari-ants (soil layer 0–0.1 m) in four samples of soil from the centre of the inter-rows.
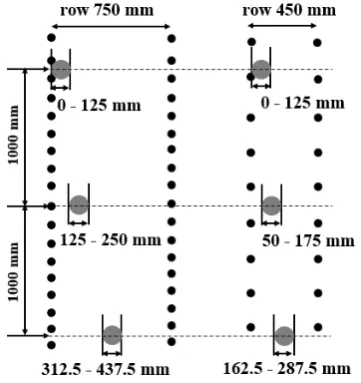
[image:3.595.63.291.141.286.2]Throughfall (Pth, mm) was measured with collecting funnels identical to those for the splash measuring (without a sieve between funnel and bottle) – Figure 1. The amount of captured water was determined by weight, and subsequently expressed in mm of water column. Plastic tubes that hold the bottles with the funnel were placed 200 mm above the soil surface. Three drop zones (depending on the location within the line) were evaluated within each line (Figure 2). Seven collection funnels (a total of 21 funnels per each variant) were installed for each assessed drop zone; their distribution in measuring plots with corn line spacings of 0.45 and 0.75 m is displayed in Figure 2. Two collection funnels were placed at a height of 3.5 m (upper edge of the funnel) above ground. These funnels were used to determine the aerial precipitation above the crop canopy (P, mm). The reason was for the comparison of Pth and P using the same collecting devices. Values of P and Pth, and
Table 1. Terms of maize seeding, average number of plants per ha, and average distance between plants three weeks after seeding in 2012–2014
Year of seedingTerms Row width (m) No. of plants per ha
Average distance between plants (m)
2012 19.4. 0.450.75 88 88989 333 0.2710.151
2013 19.4. 0.450.75 87 77889 333 0.2590.156
2014 15.4. 0.45 85 556 0.266
0.75 86 667 0.154
[image:3.595.322.503.501.693.2]Figure 1. Measuring scheme of the splash erosion (a) and throughfall (b); 1 – funnel; 2 – bottle; 3 – tube; 4 – soil; 5 – sieve
Figure 2. Scheme of the funnel location for the throughfall measurements in maize crop with the 0.75 m and 0.45 m wide rows
[image:3.595.97.263.603.712.2]similarly MSR, were determined for the measured pe-riod, depending on the duration of the precipitation. Verification of the accuracy of P measurement us-ing the collection device above the crop canopy was made by comparing the average values of P precipi-tation with standard precipi precipi-tation values (Prg, mm) measured by the standard tipping bucket rain gauge SR 03 (Meteoservis, Vodňany, CZ). The dependency between P and Prg in 2012 can be described by the following model: P = 0.849 ×Prg, correlation coef-ficient (r) = 0.996, in 2013 the same dependency by the model: P = 0.939 × Prg, r = 0.993, and finally in 2014 by the model: P = 0.947 × Prg, r = 0.997.
As an observed subject within the development of vegetation, the BBCH growth stages for the crops (according to Meier (2001)) and the plant length (L, m) were monitored weekly. Twenty plants from each variant were evaluated. Plant length was meas-ured from the base of the plant up to the end of the most developed stretched leaf (since the stage of BBCH 61), then from the base to the top of inflo-rescence after stage BBCH 61.
Values of photosynthetically active leaf area (ex-pressed by LAI) in the ten plants for each variant were measured in fortnight intervals. Plants for the determination of L and LAI were taken diagonally on the plot. LAI was determined destructively, followed by the infrared image analysis. Plant leaves were separated and placed on a 0.6 × 0.6 m black plate.
The leaves were laid on the plate whole or dissected according to their size. Infra-red photographs (8 Mpx resolution) of the leaves were taken from the height of 1.2 m and converted into a black (for background) and white (for leaves) format. Following the circum-ference of the plates, all images were cropped in the Photoshop program. Subsequently, the percentage of the white and black pixels from the cropped pho-tographs was determined. The percentage of white colour was used to calculate the leaf surface in the image area of the plate. Using the number of plants per unit area, LAI was determined. A Nikon Coolpix 995 digital camera (Nikon Corporation, Tokyo, Japan) was modified by changing the NIR-blocking filter for an Infrared R72 filter (Hoya, Tokyo, Japan) mounted in front of the lens. The images were processed with the analytical tool in Adobe Photoshop CS5 (Adobe Systems Software, Dublin, Ireland).
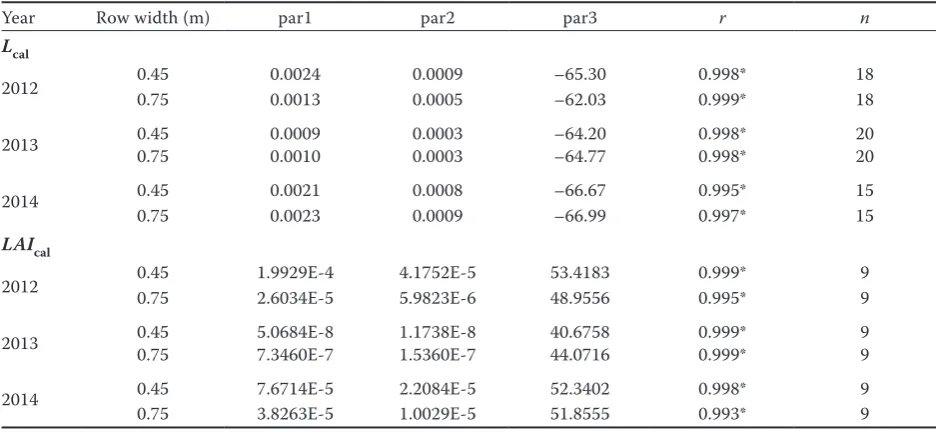
[image:4.595.63.532.515.731.2]To determine the dependency of Pth on the values of L and LAI,daily values of plant length (Lcal, m) and leaf area index (LAIcal) were calculated. Finally, the dependency between the values of P (mm)/Pth(mm) ratio (dependent variable) for the actual precipitation event and Lcal (m) and LAIcalvalues (independent variable) for the same event were estimated. The computational algorithms and parameter values of equations for Lcal and LAIcal are documented in Table 2. The values of Lcal were calculated for the whole vegetation period within the years evaluated,
Table 2. Values of parameters for the plant lengths calculation (Lcal, m) and for leaf area index calculation (LAIcal) (years 2012–2014)
Year Row width (m) par1 par2 par3 r n
Lcal
2012 0.450.75 0.00240.0013 0.00090.0005 –65.30–62.03 0.998*0.999* 1818
2013 0.450.75 0.00090.0010 0.00030.0003 –64.20–64.77 0.998*0.998* 2020
2014 0.45 0.0021 0.0008 –66.67 0.995* 15
0.75 0.0023 0.0009 –66.99 0.997* 15
LAIcal
2012 0.450.75 1.9929E-42.6034E-5 4.1752E-55.9823E-6 53.418348.9556 0.999*0.995* 99
2013 0.450.75 5.0684E-87.3460E-7 1.1738E-81.5360E-7 40.675844.0716 0.999*0.999* 99
2014 0.45 7.6714E-5 2.2084E-5 52.3402 0.998* 9
0.75 3.8263E-5 1.0029E-5 51.8555 0.993* 9
the values of LAIcalwere calculated for the individual years within the periods 19/4–30/7 2012, 19/4–20/8 2013, and 15/4–17/8 2014.
Statistical analyses were carried out in Stat-graphics®Plus 4.0 (Statgraphics, Warrenton, USA). The analysis of variance (ANOVA, Tukey’s test, α = 0.05) and simple regression were used. The pro-gram Mini32 Version 403.18 (EMS, Brno, Czech Republic) was used for the determination of the calculated values of plant length Lcal andLAIcal.
RESULTS
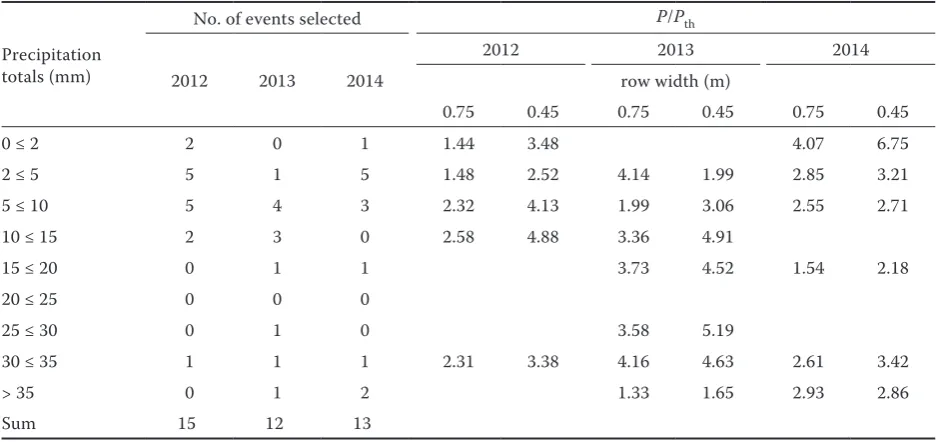
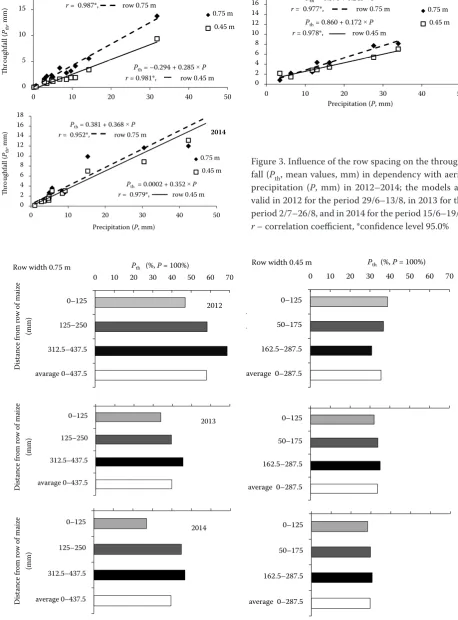
Precipitation and throughfall. The size and num-ber of the evaluated rainfall events from 2012 to 2014 and the average P/Pth ratios (mm; the average value from assessed area), depending on the precipitation totals are documented in Table 3. Values fluctuated within the range of 1.44–6.75 (Table 1). The meas-urements (2012–2014) in both stands showed a close correlation between the values of aerial precipitation (P, mm) and the mean throughfall (Pth, mm) (Fig-ure 3). With increasing P-value, higher levels of Pth were proved in the 0.75 m compared with the 0.45 m row spacing (Figure 3). For the observed period, the highest average proportion of Pth (%) (P = 100%) was established in the 0.75 m rows. This proportion is the highest in the centre of the inter-row, and decreases toward the plant row (Figure 4). In the case of the 0.45 m row spacing, the proportions of Pth (%) on P
were lower than in the 0.75 m rows in all of the as-sessed areas (Figure 4). In the case of the 0.75 m wide rows, the average value of the proportion of P/Pth (2012–2014) was 35.9% in the 0–125 mm zone, 47.6% in the 125–250 mm zone, and 53.8% in the 312.5–437.5 mm zone. In the case of the 0.45 m row spacing, average P/Pth was 33.1% in the 0–125 mm zone, 33.5% in the 50–175 mm zone, and 32.3% in the 162.5–278.5 mm zone.
Splash erosion, precipitation, and throughfall. The values of splash erosion (MSR, g/m2) in crops
with the 0.75 and 0.45 m row spacing within the ob-servation periods from 2012–2014 are documented in Table 4. Statistically significant lower values of splash erosion were observed in the 0.45 m wide rows compared with the 0.75 m wide rows, especially within the years 2012 and 2014 (Table 4). The positive influence of narrower rows on the MSR elimination was not clear in 2013 (Table 4).
The absolute values of MSR fluctuated between 11.8–557.8 g/m2 (2012), 8.1–2630.8 g/m2 (2013), and
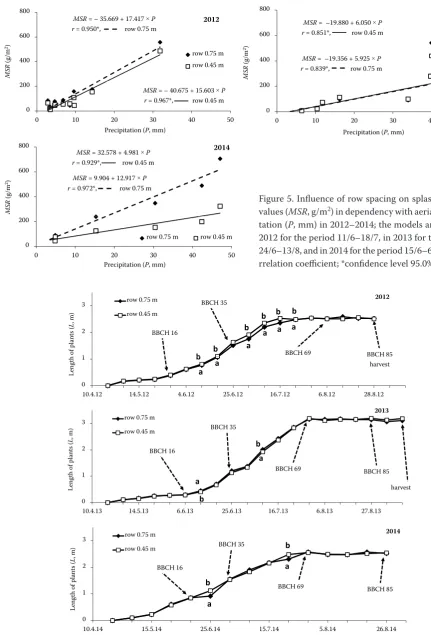
44.0–839.9 g/m2 (2014). Figure 5 illustrates a positive
correlation of splash erosion (MSR, g/m2) and aerial
precipitation (P, mm) during the years 2012–2014. Positive correlation was also determined between splash erosion (MSR, g/m2) and the throughfall values
[image:5.595.63.534.538.759.2](Pth, mm) – Table 5. The closest dependency between Pthand MSR was observed within the 0.45 m wide rows in 2012–2013 in the 0–125 mm zone, rather than in 2014 in the 50–175 mm zone, as it is evident from
Table 3. Number of events selected by totals and the average P/Pth proportion (precipitation/throughfall) in maize crops with 0.45 m and 0.75 m row spacing in 2012–2014
Precipitation totals (mm)
No. of events selected P/Pth
2012 2013 2014
2012 2013 2014
row width (m)
0.75 0.45 0.75 0.45 0.75 0.45
0 ≤ 2 2 0 1 1.44 3.48 4.07 6.75
2 ≤ 5 5 1 5 1.48 2.52 4.14 1.99 2.85 3.21
5 ≤ 10 5 4 3 2.32 4.13 1.99 3.06 2.55 2.71
10 ≤ 15 2 3 0 2.58 4.88 3.36 4.91
15 ≤ 20 0 1 1 3.73 4.52 1.54 2.18
20 ≤ 25 0 0 0
25 ≤ 30 0 1 0 3.58 5.19
30 ≤ 35 1 1 1 2.31 3.38 4.16 4.63 2.61 3.42
> 35 0 1 2 1.33 1.65 2.93 2.86
Pth= 0.110 + 0.414 ×P r= 0.987*, row 0.75 m
5 10 15 ou gh fal l ( Pth , m m ) 2012 0.75 m 0.45 m
Pth= –0.294 + 0.285×P r= 0.981*, row 0.45 m 0
5
0 10 20 30 40 50
Th
ro
Precipitation (P, mm)
Pth= 0.370 + 0.245 ×P r= 0.977*, row 0.75 m
Pth= 0.860 + 0.172×P r= 0.978*, row 0.45 m
6 8 10 12 14 16 18 ug hf all ( Pth , m m ) 2013 0.75 m 0.45 m 0 2 4
0 10 20 30 40 50
Th
ro
u
Precipitation (P, mm)
Pth= 0.381 + 0.368×P r= 0.952*, row 0.75 m
6 8 10 12 14 16 18 ug hf all ( Pth , mm ) 2014 0.75 m 0.45 m Pth= 0.0002 + 0.352×P r= 0.979*, row 0.45 m 0
2 4
0 10 20 30 40 50
Th
ro
u
[image:6.595.64.523.110.731.2]Precipitation (P, mm)
Figure 3. Influence of the row spacing on the through-fall (Pth, mean values, mm) in dependency with aerial precipitation (P, mm) in 2012–2014; the models are valid in 2012 for the period 29/6–13/8, in 2013 for the period 2/7–26/8, and in 2014 for the period 15/6–19/8;
r – correlation coefficient, *confidence level 95.0%
Figure 4. Influence of row spacing on throughfall (Pth, %) within the inter-row in 2012–2014; aerial precipitation (P, mm) represents 100%
0 10 20 30 40 50 60 70
0–125
125–250
312.5–437.5
avarage 0–437.5
Pth (%, P= 100%)
Di st an ce fr om row of ma iz e (mm )
Row width 0.75 m
2012
0 10 20 30 40 50 60 70
0–125
50–175
162.5–287.5
average 0–287.5
Pth (%, P= 100%)
D ist an ce fr om r ow of mai ze (m m)
Row width 0.45 m
0–125 33.92887 125–250 39.52741 312.5–437. 45.65144 avarage 0– 39.70257
0 10 20 30 40 50 60 70
0–125 125–250 312.5–437.5 avarage 0–437.5 Di stanc e f rom row of mai ze (mm)
Row width 0.75 m Pth(%, P = 100 %)
Di stanc ef rom row of mai ze R 2013
0 10 20 30 40 50 60 70
0–125
50–175
162.5–287.5
average 0–287.5
D ist an ce fr om ro w of ma iz e (mm )
Row width 0.45 m P
th(%, P = 100 %)
0 10 20 30 40 50 60 70
0–125 125–250 312.5–437.5 average 0–437.5 D ist an ce fr om ro w o f m ai ze (mm )
Row width 0.75 m Pth(%, P = 100 %)
di st an ce fr om ro w of 2014
0 10 20 30 40 50 60 70
0–125
50–175
162.5–287.5
average 0–287.5
Di
st
anc
e f
rom r
ow of maize
(mm)
Row width 0.45 m Pth(%, P = 100 %)
0 10 20 30 40 50 60 70
0–125
50–175
162.5–287.5
average 0–287.5
Pth (%, P= 100%)
D ist an ce fr om r ow of mai ze (m m)
Row width 0.45 m
0 10 20 30 40 50 60 70
0–125
125–250
312.5–437.5
avarage 0–437.5
Pth (%, P= 100%)
Di st an ce fr om row of ma iz e (mm )
Row width 0.75 m
2012
0 10 20 30 40 50 60 70
0–125
125–250
312.5–437.5
avarage 0–437.5
Pth (%, P= 100%)
Di st an ce fr om row of ma iz e (mm )
Row width 0.75 m
Ta
ble 4. V
alue
s of spl
as h er osion ( M SR , g/m
2) in mai
ze c rop s w ith diff er en t r ow sp ac ing dur ing e stima te d p er io
ds in 2012
–2014 Row w idt h (mm) Per io d 2012 21/5–23/5 23/5–1/6 1/6–4/6 4/6–11/6 11/6–12/6 12/6–21/6 21/6–29/6 29/6–1/7 1/7–2/7 2/7–3/7 3/7–5/7 5/7–9/7 9/7–16/7 18/7–23/7 450 271.1 a 166.8 a 158.7 a 20.6 a 45.6 a 108.4 a 11.8 a 65.3 a 55.5 a 487.3 a 51.1 a 154.7 a 45.0 a 58.1 a 750 280.5 a 225.9 a 223.1 b 35.5 a 77.8 b 158.4 b 26.0 a 84.7 b 88.2 b 557.8 a 48.1 a 175.6 a 42.3 a 44.2 a 2013 15/5–20/5 20/5–23/5 23/5–27/5 27/5–31/5 31/5–5/6 5/6–10/6 10/6–11/6 24/6–25/6 25/6–26/6 26/6–3/7 26/7–30/7 30/7–5/8 5/8–7/8 7/8–13/8 450 970.6 a 56.8 a 418.6 a 627.4 a 886.2 a 2622.6 a 50.2 a 279.7 a 8.1 a 230.4 b 99.4 a 113.1 a 73.9 a 22.9 a 750 800.5 a 49.5 a 381.2 a 559.4 a 892.4 a 2630.8 a 81.0 b 282.4 a 12.2 a 166.0 a 91.0 a 97.3 a 74.1 a 28.2 a 2014 19 /5– 22 /5 2 2/ 5– 26 /5 26 /5– 28 /5 28 /5– 30 /5 3 0/ 5– 26 /6 26 /6– 30 /6 30/6–9/7 9/7–15/7 15 /7– 22 /7 22 /7– 28 /7 28/7–6/8 450 309.8 b 604.4 a 789.4 a 244.3 a 124.3 a 75.3 a 322.7 a 53.8 a 152.3 a 198.5 a 44.0 a 750 257.5 a 598.6 a 839.9 a 283.5 a 238.1 b 88.9 a 705.2 b 102.7 b 347.4 b 488.6 b 62.4 b Inde xe s a
, b in t
he indiv idu al r ow s do cumen t st ati stic ally sig nific an t diff er enc es (
α = 0.05)
Ta ble 5. Influenc e of thr oug hf all ( Pth , mm) on the spl as h er osion ( M SR , g/m
2 , me
asur ed in the cen tr e of the in ter -r ow) in diff er en t p ar ts of in ter -r ow s of mai ze cr op
(0.45 m and 0.75 m r
ow sp
ac
ing) in 2012–2014
Row w idt h (mm) Di st anc e f rom mai ze row (mm) 2012 2013 2014 M SR r M SR r M SR r 450 0–125
–38.932 + 43.303 ×
Pth
0.937
10.278 + 13.448 ×
Pth
0.948
23.463 + 16.282 ×
Pth
0.968
50–175
–48.279 + 46.288 ×
Pth
0.875
25.422 + 12.301 ×
Pth
0.934
32.597 + 14.208 ×
Pth
0.995
162.5–287.5
–40.597 + 55.690 ×
Pth
0.867
16.979 + 12.084 ×
Pth
0.919
32.513 + 13.246 ×
Pth
0.983
average
–44.193 + 48.405 ×
Pth
0.901
17.113 + 12.684 ×
Pth
0.937
28.8448 + 14.5919 ×
Pth
0.987
750
0–125
–53.086 + 47.654 ×
Pth
0.946
2.762 + 14.920 ×
Pth
0.869
83.508 + 2.712 ×
Pth
0.792
125–250
–73.629 + 42.928 ×
Pth
0.971
15.019 + 10.296 ×
Pth
0.941
–37.442 + 32.372 ×
Pth
0.974
312.5–437.5
–77.233 + 37.281 ×
Pth
0.958
14.280 + 8.781 ×
Pth
0.926
16.900 + 24.739 ×
Pth
0.958
average
–70.885 + 42.626 ×
Pth
0.963
8.749 + 11.169 ×
Pth
0.934
–13.450 + 34.680 ×
MSR= – 35.669 + 17.417×P r= 0.950*, row 0.75 m
400 600 800
M
SR
(g
/m
2)
2012
row 0.75 m row 0.45 m
MSR= – 40.675 + 15.603×P r= 0.967*, row 0.45 m 0
200
0 10 20 30 40 50
Precipitation (P, mm)
MSR= –19.880 + 6.050×P r= 0.851*, row 0.45 m
MSR= –19.356 + 5.925×P r= 0.839*, row 0.75 m 400
600 800
M
SR
(g
/m
2)
2013
row 0.75 m row 0.45 m
0 200
0 10 20 30 40 50
Precipitation (P, mm)
MSR= 9.904 + 12.917×P r= 0.972*, row 0.75 m
MSR= 32.578 + 4.981×P r= 0.929*, row 0.45 m
400 600 800
M
SR
(g
/m
2)
2014
0 200
0 10 20 30 40 50
Precipitation (P, mm)
row 0.75 m row 0.45 m
1 2 3
h
of
pla
nt
s (
L
, m
)
row 0.75 m row 0.45 m
a
a a a
b b
b b b
b
BBCH 16
BBCH 35
BBCH 69 BBCH 85
2012
0 1
10.4.12 14.5.12 4.6.12 25.6.12 16.7.12 6.8.12 28.8.12
Le
ng
th
a a
b
harvest
1 2 3
h
of
pla
nt
s (
L
, m
)
row 0.75 m row 0.45 m
a b
BBCH 16
BBCH 35
BBCH 69 BBCH 85
2013
0 1
10.4.13 14.5.13 6.6.13 25.6.13 16.7.13 6.8.13 27.8.13
Le
ng
th
a b
harvest
1 2 3
h
of
pl
an
ts
(
L
, m
)
row 0.75 m row 0.45 m
a b
b
BBCH 16
BBCH 35
BBCH 69 BBCH 85
2014
0 1
10.4.14 15.5.14 25.6.14 15.7.14 5.8.14 26.8.14
Le
ng
th
[image:8.595.61.493.92.728.2]a
Figure 5. Influence of row spacing on splash erosion values (MSR, g/m2) in dependency with aerial precipi-tation (P, mm) in 2012–2014; the models are valid in 2012 for the period 11/6–18/7, in 2013 for the period 24/6–13/8, and in 2014 for the period 15/6–6/8; r – co-rrelation coefficient; *confidence level 95.0%
Table 5. In the case of the 0.75 m wide rows, the clos-est dependency between Pthand MSR was observed always in the 125–250 mm zone, in contrast to the soft dependency in the 0–125 mm zone (Table 5).
The mass proportion of the stable aggregates on the total mass of aggregates (SAS) during 2012–2014 years is documented in Table 6. When compared with the 0.75 m wide rows, statistically significant higher values of SAS were observed in the 0.45 m wide rows
in 2012. No statistically significant differences were observed between SAS values in 2013 and 2014.
[image:9.595.73.526.96.233.2]Plant cover and throughfall. Table 4 illustrates the dynamics of the lengths of plants and BBCH phases during the years 2012–2014. The statistically significant differences in the plants length between the 0.45 and the 0.75 m wide rows are noticeable from Figure 6 in 2012 only. Significantly longer plants in the 0.45 m wide rows from the beginning of the growth elongation phase (BBCH 30) up to the phase of complete flower-ing (BBCH 67) were observed. The positive correlation between plant length (Lcal, m) and P/Pth proportion is documented in Figure 7. Values of Lcal and P/Pth for the season when the plants were in the BBCH phase 30–70 (2012–2014 average) were used in the model. During this period of vegetation, the highest level of dependency between variables was determined. A closer dependency between Lcal and P/Pth was according to the correlation coefficients estimated in the 0.75 m wide rows. The measured values of LAI for the crops
Table 6. Stability of soil aggregates (SAS, stable share) at the end of the vegetation period during 2012–2014
Row width (mm)
SAS
2/9/2012 13/9/2013 9/9/2014
450 0.29b 0.24a 0.38a
750 0.25a 0.26a 0.36a
[image:9.595.64.291.326.391.2]Different letters document statistically different averages (α = 0.05)
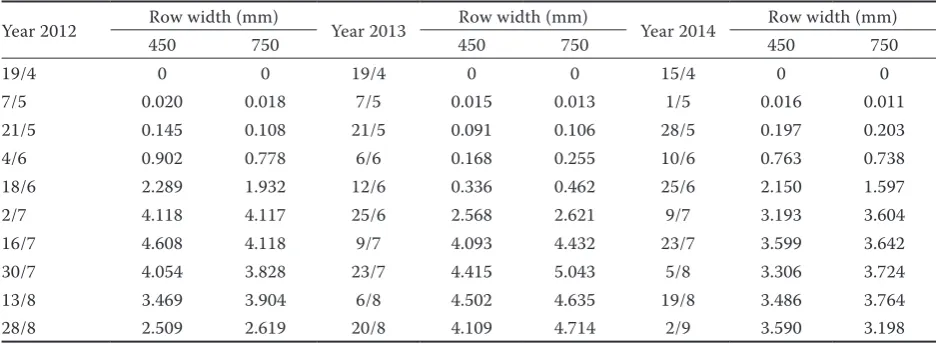
Table 7. Values of LAI during 2012–2014
Year 2012 Row width (mm) Year 2013 Row width (mm) Year 2014 Row width (mm)
450 750 450 750 450 750
19/4 0 0 19/4 0 0 15/4 0 0
7/5 0.020 0.018 7/5 0.015 0.013 1/5 0.016 0.011
21/5 0.145 0.108 21/5 0.091 0.106 28/5 0.197 0.203
4/6 0.902 0.778 6/6 0.168 0.255 10/6 0.763 0.738
18/6 2.289 1.932 12/6 0.336 0.462 25/6 2.150 1.597
2/7 4.118 4.117 25/6 2.568 2.621 9/7 3.193 3.604
16/7 4.608 4.118 9/7 4.093 4.432 23/7 3.599 3.642
30/7 4.054 3.828 23/7 4.415 5.043 5/8 3.306 3.724
13/8 3.469 3.904 6/8 4.502 4.635 19/8 3.486 3.764
28/8 2.509 2.619 20/8 4.109 4.714 2/9 3.590 3.198
Figure 7. Dependency of the proportion of the aerial precipitation (P, mm) and throughfall (Pth, mm) on the calculated length of plants (Lcal, m); values of Lcal and P/Pth used in the models were derived from the periods when the plants were within the phase BBCH 30–70; data from years 2012–2014; r – correlation coefficient; *confidence level 95.0%
P/Pth= –0.133 + 1.339×Lcal
r= 0.942*, row 0.75 m
2 3 4 5 6
P
/
Pth
0 1
0 1 2 3 4
Length of plants (Lcal, m)
2 3 4 5 6
P
/
Pth
P/Pth= 0.228 + 1.578×Lcal
r= 0.849*, row 0.45 m
0 1
0 1 2 3 4
Length of plants (Lcal, m)
2 3 4 5 6
P
/
Pth
P/Pth= 0.228 + 1.578×Lcal
r= 0.849*, row 0.45 m
0 1
0 1 2 3 4
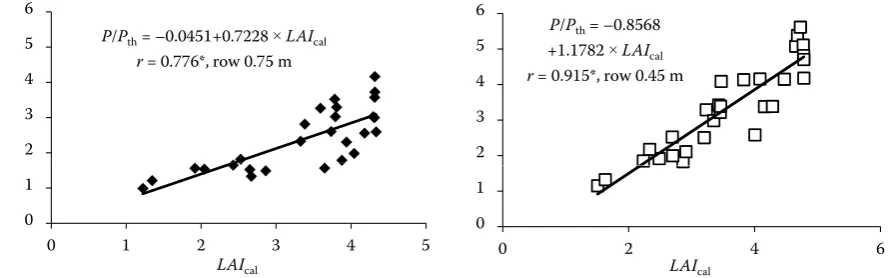
[image:9.595.63.533.586.758.2]evaluated within the years 2012–2014 are included in Table 7. The positive correlation between daily values of LAIcal and P/Pth proportion is documented in Fig-ure 8. In this case, the tightest dependency between the variables was according to the correlation coefficients estimated within the BBCH phase 30–70 (2012–2014 average). A closer dependency between LAIcal and P/Pth was estimated in the 0.45 m wide crop rows (Figure 8).
DISCUSSION
Precipitation and throughfall. A positive correla-tion between P/Pth (row width 0.45 as well as 0.75 m) was determined in accordance with the results of Paltineanu and Starr 2000 (Figure 3). Pthvalues in the 0.45 m wide rows were reduced in compari-son with the 0.75 m wide rows (Figure 3), especially under the higher precipitation totals. Measurements did not prove the dependency between the P/Pth proportion and the precipitation totals (Table 3). However, it is necessary to take into account if this is possible under the conditions of the natural pre-cipitation, incontinuous precipitation data recording, and continuously changing parameters of growth. The highest P/Pth proportions were estimated in the centre of inter-rows in the 0.75 m wide row crops, in accordance with Bruckler et al. 2004. The P/ Pth proportion decreased toward the row (Figure 4). This fact was probably due to the occurrence of the free inter-row space as a result of the free growing crop, and due to the water drip from leaves in the centre of the inter-row. The effect of the water drip from leaves on the water concentration in the centre of inter-rows and on the increasing splash erosion is pointed out by Brandt (1989), Bruckler et al. (2004), and Morgan (2005).
In the case of the 0.45 m wide rows, these phe-nomena were not so clearly noticeable (Figure 4). Stands are substantially closed; stem flow plays a crucial role in the rainwater distribution.
Zábranský et al. (2013) proves this fact, intro-ducing higher values of the stem flow in the 0.45 m wide rows compared with the 0.75 m row spacing in maize crops. Under the lower precipitation totals, the proportion of stem flow on the total precipitation is increasing; greater precipitation, vice versa, tends to lower the proportion of the stem flow.
Based on the P/Pth proportion, a great variability of the actual throughfall as well as of the average values within the inter-rows is noticeable during the evaluated years (Figure 4).
The estimated proportion of Pthand Pcorresponds with the results reported in the literature, whereby this ratio lays within the interval of 34–84%, depending on different sources (Quinn & Laflen 1983; Parkin &
Codling 1990; Bui & Box 1992; Paltineanu & Starr 2000). According to these authors, the variability of crops is the main factor influencing the variability of the throughfall. The variability of Pthand P propor-tion(%) may also be explained by the different totals of precipitation and numbers of precipitation in the individual size category (Table 3). The other factors will certainly include the rain intensity, drops dimen-sion, angle of rain incidence, etc. Paltineanu and
Starr (2000) point out the fact that in maize crop under less intense rain, the proportion of stem flow on the throughfall is increasing. Under more intense rain this proportion is decreasing.
[image:10.595.78.523.97.236.2]Splash erosion, precipitation, and throughfall. A positive correlation between the precipitation totals (Figure 5), throughfall (Table 5), and MSR values was proved. The positive influence of the narrower line
Figure 8. Dependency of the proportion of the aerial precipitation (P, mm) and throughfall (Pth, mm) on the calculated values of the leaf area index (LAIcal); values of LAIcal and P/Pth used in the models were derived from the periods when the plants were within the phase BBCH 30–70; data from years 2012–2014; r – correlation coefficient; *confidence level 95.0%
P/Pth= –0.0451+0.7228×LAIcal
r = 0.776*, row 0.75 m
2 3 4 5 6
P
/
Pth
0 1
0 1 2 3 4 5
LAIcal
P/Pth= –0.8568
+1.1782 ×LAIcal
r= 0.915*, row 0.45 m
2 3 4 5 6
P
/
Pth
0 1
0 2 4 6
on the elimination of erosion processes was also deter-mined, due to the estimation of lower MSR values on the 0.45 m wide compared with the 0.75 m wide rows (Uppenkamp 2007; Nübel 2008; Mohammadi et al. 2012). It is explainable by probably higher soil cover-age by the leaves and by a greater proportion of stem flow (Bui & Box 1992; Zábranský et al. 2013). Lower SAS values on the 0.45 m compared with 0.75 m rows are highly possible because of high precipitation in the beginning of the vegetation period (5–7 leaf phases), resulting in areal soil loss and its subsequent deposition in the inter-rows. This effect was greater in the 0.45 m than in the 0.75 m rows, and subsequently influenced theevaluation of SAS. For this reason, this fact cannot be associated with the influence of vegetation.
Plant cover and throughfall. The experiments proved the positive influence of the length of plants as well as of LAI on P/Pth values. Throughfall Pth in relation to the precipitation P values decreased with increasing plant height and LAI (Figure 7). This dependency was then proved from the beginning of the stem elongation (BBCH 30) to the end of flowering (BBCH 70). This fact is explainable by the increase of the crop cover from phase BBCH 30, because of intensive leaf growth and greater soil coverage. From the end of flowering, the leaves arrangement changed (the angle of leaf blade increased) and the upper half of leaves bent toward the soil surface. Simultaneously, necrosis may result in the death of lower leaves of plants from this stage. These facts are likely to have a subsequent influence on the overall soil coverage and the proportion of the water drip from leaves and the stem flow. Finally, all of this modifies the influence of the crop on the rain water distribution.
According to the estimation of the influence of the crop, closer dependency between Lcal and P/Pth was proved in the 0.75 m wide crop rows (Figure 7). In the 0.45 m wide rows, a greater influence of LAI to P/Pth ratio was observed (Figure 8). This fact could be ex-plained by a probably higher soil coverage by leaves in the 0.45 m wide rows. The length of plant may be the factor strongly influencing the angle of the precipita-tion incidence in the case of the 0.75 m row spacing.
CONCLUSIONS
The presented results may be summarized as fol-lows:
– For the 0.45 m wide compared to the 0.75 m wide crop rows, a decrease of throughfall in the BBCH phase 30–70 was observed.
– Reduction of lines width from 0.75 m to 0.45 m in maize resulted in decreasing splash erosion.
– Narrower lines (0.45 m) did not provably impact the splash erosion in the beginning of the vegeta-tion period if compared with wider lines (0.75 m). – In general, in both evaluated crops the protective
influence of vegetation was decreased with the beginning of the senescence phase.
Acknowledgements. Supported by the Ministry of Agri-culture of the Czech Republic, Project No. QJ1530181. The authors thank the companies Farmet, Inc. and Kverneland Group Czech, Ltd., for technical support.
References
Andrade F.H., Calviño P., Cirilo A., Barbieri P. (2002): Yield responses to narrow rows depend on increased radiation interception. Agronomy Journal, 94: 975–980.
Barbieri P.A., Sainz Rozas H., Andrade F.H., Echeverría H.E. (2000): Row spacing effects at different levels of nitrogen availability in maize. Agronomy Journal, 92: 283–288. Barbieri P.A., Echeverría H.E., Sainz Rozas H.R., Andrade
F.H. (2008): Nitrogen use efficiency in maize as affected by nitrogen availability and row spacing. Agronomy Journal, 100: 1094–1100.
Bollinne A. (1975): The measurement of the intensity of splash on loamy soils. Soil application technique and first results. Pédologie, 25:199–210. (in French)
Brandt C.J. (1989): The size distribution of throughfall drops under vegetation canopies. Catena, 16: 507–524. Bruckler L., Lafolie F., Doussan C., Bussières F. (2004):
Modeling soil-root water transport with non-uniform water supply and heterogeneous root distribution. Plant and Soil, 260: 205–224.
Bui E.N., Box J.E. Jr. (1992): Stemflow, rain throughfall, and erosion under canopies of corn and sorghum. Soil Science Society of America Journal, 56: 242–247.
de Moraes Frasson R.P., Krajewski W.F. (2011): Characteri-zation of the drop-size distribution and velocity–diam-eter relation of the throughfall under the maize canopy. Agricultural and Forest Meteorology, 151: 1244–1251. de Moraes Frasson R.P., Krajewski W.F. (2013): Rainfall
interception by maize canopy: Development and applica-tion of a process-based model Renato Prata. Journal of Hydrology, 489: 246–255.
Dekker L.W., Ritsema C.J. (1997): Effect of maize canopy and water repellency on moisture patterns in a Dutch black plaggen soil. Plant and Soil, 195: 339–350. Farnham D.E. (2001): Row spacing, plant density, and
hy-brid effects on corn grain yield and moisture. Agronomy Journal, 93: 1049–1053.
Hudson N. (1995): Soil Conservation. Ames, Iowa State University Press.
soil water content measurements and evapotranspiration estimates. Journal of Hydrology, 303: 247–270.
Johnson G.A., Hoverstad T.R., Greenwald R.E. (1998): Inte-grated weed management using narrow corn row spacing, herbicides, and cultivation.Agronomy Journal, 90:40–46.
Kinnell P.I.A. (1991): The effect of flow depth on sediment transport induced by raindrops impacting shallow flows. Transactions of the American Society of Agricultural Engineers, 34: 161–168.
Leguédois S., Planchon O., Legout C., Le Bissonnais Y. (2005): Splash projection distance for aggregated soils: Theory and experiment. Soil Science Society of America Journal, 69: 30–37.
LfL (2010): Hinweise zur bayerischen Erosionsschutzver-ordnung (ESchV). Freising, Bayerische Landesanstalt für Landwirtschaft (LfL).
Liu H., Zhang R., Zhang L., Wang X., Li Y., Huang G. (2015): Stemflow of water on maize and its influencing factors. Agricultural Water Management, 158: 35–41.
Mannering J.V., Johnson C.B. (1969): Effect of crop row spacing on erosion and infiltration. Agronomy Journal, 61: 902–905. Martello M., Dal Ferro N., Bortolini L., Morari F. (2015): Ef-fect of incident rainfall redistribution by maize canopy on soil moisture at the crop row scale. Water, 7: 2254–2271. Meier U. (ed.) (2001): Growth Stages of Mono- and Di-cotyledonous Plants. BBCH Monograph, 2nd Ed., Berlin, Braunschweig, Federal Biological Research Centre for Agriculture and Forestry.
Miole R.N., Visco R.G., Magcale-Macandog D.B., Abucay E.R., Gascon A.F., Castillo A.S.A. (2011): Growth performance, crop productivity, and water and nutrient flows in Gmelina
arborea Roxb. – Zea mays hedgerow systems in Southern
Philippines. Philippine Journal of Crop Science, 36: 34–44. Mohammadi G.R., Ghobadi M.E., Sheikheh-Poor S. (2012): Phosphate biofertilizer, row spacing and plant density effects on corn (Zea mays L.) yield and weed growth. Journal of Plant Sciences, 3: 425–429.
Morgan R.P.C. (2005): Soil Erosion and Conservation. 3rd Ed. Oxford, Blackwell Publishing.
Neave M., Abrahams A.D. (2002): Vegetation influences on water yields from grassland and shrubland ecosystems in the Chihuahuan Desert. Earth Surface Processes and Landforms, 27: 1011–1020.
Nübel V. (2008): 75cm Reihenabstand im Maisanbau Zeit-gemäß? Saarbrücken, VDM Verlag Dr. Müller.
Ottman M.J., Welch L.F. (1989): Planting pattern and radia-tion intercepradia-tion, plant nutrient concentraradia-tion, and yield in corn. Agronomy Journal, 81: 167–174.
Paltineanu I.C., Starr J.L. (2000): Preferential water flow through corn canopy and soil water dynamics across rows. Soil Science Society of America Journal, 64: 44–54.
Parkin T.B., Codling E.E. (1990): Rainfall distribution under a corn canopy: Implications for managing agrochemicals. Agronomy Journal, 82: 1166–1169.
Pimentel D. (2006): Soil erosion: A food and environmental threat. International Journal of Environment and Sustain-able Development, 8: 119–137.
Pivec J., Brant V., Moravec D. (2006): Analysis of the poten-tial evapotranspiration demands in the Czech Republic between 1961–1990. Biologia, 61: 294–299.
Poesen J., Torri D. (1988): The effect of cup size on splash detachment and transport measurements: Part I. Field measurements. Catena, 12: 113–126.
Quansah C. (1981): The effect of soil type, slope, rain in-tensity and their interactions on splash detachment and transport. Journal of Soil Science, 32: 215–224.
Quinn N.W., Laflen J.M. (1983): Characteristics of raindrop throughfall under corn canopy. Transactions of the Amer-ican Society of Agricultural Engineers, 26: 1445–1450. Richter G. (1998): Bodenerosion. Analyse und Bilanz eines
Umweltproblems. Darmstadt, Wissenschaftliche Buch-gesellschaft.
Sangoi L., Salvador R.J. (1998): Influence of plant height and leaf number on maize production at high plant densities. Pesquisa Agropecuária Brasileira, 33: 297–306.
Sharma P.P., Gupta S.C., Rawls W.J. (1991): Soil detachment by single raindrops of varying kinetic energy. Soil Science Society of America Journal, 55: 301–307.
Uppenkamp N. (2007): Praxiserfahrungen mit der Maisen-gsaat. Mais, 34: 26–28.
van Dijk P.M., van der Zijp M., Kwaad. F.J.P.M. (1996): Soil erodibility parameters under various cropping systems of maize. Hydrological Processes, 10: 1061–1067.
van Dijk A.I.J.M., Meesters A.G.C.A., Bruijnzeel L.A. (2002): Exponential distribution theory and the interpretation of splash detachment and transport experiments. Soil Sci-ence Society of America Journal, 66: 1466–1474. Wainwright J. (1996): Infiltration, runoff and erosion
char-acteristics of agricultural land in extreme storm events, SE France. Catena, 26: 27–47.
Zábranský P., Brant V., Pivec J., Gemerlová M., Kroulík M. (2013): The influence of the structure stands maize sown in the distribution of rainfall. In: Vliv abiotických a biotických stresorů na vlastnosti rostlin 2013. Prague, CRI: 310–313.