Rock Fragmentation Control in Blasting
Sang Ho Cho and Katsuhiko Kaneko
Graduate School of Engineering, Hokkaido University, Sapporo 060-8628, Japan
Rock fragmentation, which is the fragment size distribution of blasted rock material, is used in the mining industry as an index to estimate the effect of bench blasting. It is well known that the rock fragmentation in bench blasting is affected by blast condition such as specific charge, spacing and burden, involving rock heterogeneity, dynamic fracture phenomena,etc. Rock fragmentation in bench blasting was examined using a numerical approach, based on dynamic fracture process analysis and image analysis. Five models were used to consider the effect of specific charge and geometry in bench blasting. To investigate the influence of blast condition on fragmentation in bench blast simulations, the fragmentation obtained using the numerical approach was compared and analyzed. To discuses controlled fragmentation related to the blast pattern, widely spaced blast patterns were simulated. The fracture process and fragmentation were compared with that in general bench blasting. Controlled fragmentation with respect to delay timing was also discussed. Ultimately it was discussed that the optimal fragmentation in the field with respect to delay time depends strongly on the gas flow through the fractures caused by the stress wave.
(Received November 4, 2003; Accepted March 8, 2004)
Keywords: rock fragmentation, rock material, bench blasting, dynamic fracture process analysis, image analysis
1. Introduction
The term ‘rock (or blast) fragmentation’ is an index that is used to estimate the effect of bench blasting in the mining industry. Knowledge of the fragmentation mechanisms in explosively loaded rock is critical for developing successful methods for excavating rock rapidly for a variety of purposes, and has advanced considerably in the last twenty years. In rock blasting, it is generally understood that both the stress wave and the gas pressurization make significant contribu-tions to rock fragmentation. The importance of shock and gas in fragmentation has been debated for the last 50 years. Recent studies tend to support the view that stress waves generated by the detonation of an explosive charge are responsible for the development of a damage zone in the rock mass, and for the subsequent fragment size distribution, while the explosion gases are important in separating the crack pattern that is formed after the passage of the stress wave, and in throwing the fragments.1–4)
To predict rock fragmentation in the mining industry,
several models have been proposed.5,6) Fragment size
distributions are most often represented using the
Gaudin-Schumann7) or the Rosin-Rammler8) distributions. These
models underestimate the fine material in predicting rock fragmentation. For this reason, it is conceivable that fines in blasted rock are generated by a different mechanism to that
which leads to coarse fragments. Liu and Katsabanis9)and
Glatolenkov and Ivanov10)reported that the crushing of rock
around boreholes causes the majority of fines. A recent study proposed the JKMRC blast fragmentation model for assess-ing blast fragmentation, includassess-ing the distribution of fine material; however, it has been reported that the model estimates fragment size inaccurately.11)Choet al.12)revealed that Gaudin-Schumann distribution approximated to the fragmentation obtained in the sieving analysis, in the range
from 74mmto 1 m. They also proposed a numerical approach
for predicting rock fragmentation in bench blasting.
It is well known that the blast pattern and delay time influences all aspects of rock blasting. Langefors and
Kihlstro¨m13) studied the influence of blast pattern on the
rock fragmentation throughout field experiments. Based on observations and measurements, they developed a relation-ship between the average boulder size, the burden, the type of rock, and the specific charge. They also studied the influence of shot delay time on the rock fragmentation and reported that
fragmentation was optimized with delay times of35ms/m.
Gustafsson14)showed that the best delay time was 5 ms/m in
a large-scale blast with a 5- to 8-m-long burden. According to Winzer and Ritter,15)a significant reduction in fragment size in granite blocks was obtained with delays of up to 1.5 ms,
followed by small charges. Bergman16)reported an optimum
delay time of 3:36:6ms/m in granite blocks with small
charges. This was similar to the results of Langefors and
Kihlstro¨m.13)Stagg and Rholl17) reported an optimum time
range of 3:335ms/m for reduced-scale tests and 3:3
26ms/m for full-scale tests.
As the literature review shows, fragmentation in blasting is associated with many problems. Rock fragmentation is not well understood, and research on predicting and controlling fragmentation is warranted.
In this study, fragmentations for five models, which consider the effect of specific charge and geometry in bench blasting, are examined. The fragmentations are predicted using a numerical approach, which is based on dynamic fracture process analysis and image analysis, and the fragmentation mechanism in bench blasting is investigated. Controlled fragmentation in relation to the blast pattern and delay timing is discussed. Based on the numerical result and literature review, optimum fragmentation with respect to delay timing is discussed.
2. Rock Fragmentation in Bench Blast Simulation
2.1 Numerical approach for predicting rock
fragmen-tation
A numerical approach, which is based on the dynamic fracture process analysis and image analysis, for prediction
rock fragmentation in bench blasting was proposed by Choet
al.12)In order to predict rock fragmentation in a bench blast, first, it is necessary to set up a bench blast model that includes
the initial mesh, material properties, the applied pressure, the calculation time, and so on. The analysis outputs the principal stresses, the coordinates of nodes, and so on. The principal stresses in each element are calculated from the displacement at each node. Fracture propagation is presented using the coordination in the re-meshed elements. The fracture pattern from the analysis is selected and delineated using the delineation function of the WipFrag image analysis
pro-gram18) with the exception of compressive fracture zones.
The compressive fracture zones excluded from the delinea-tion of image analysis need to be considered. Therefore, the fragment size distribution is modified with the fines ratio corresponding to the compressive fracture zone. To plot size distributions that consider fines, the Gaudin-Schumann distribution is used. The fines distribution curves is connected with the modified distribution curve.
In this study the numerical approach is used to simulate the bench blast models and predict rock fragmentations in bench blasting. The influence of blast pattern on the fragmentations is analyzed.
2.2 Rock fragmentation in bench blast models
2.2.1 Model description
Figure 1 shows a schematic view of large-scale bench blasting. The analysis model has a free face, continuous
boundary,19)and charge holes parallel to the free face. The
[image:2.595.314.541.73.204.2] [image:2.595.305.550.264.365.2]model was divided into triangular elements. Figure 2 shows the finite element layout for the analysis models. The parameters used and calculation conditions are listed in Table 1.
Five models were constructed that considered the effect of the applied borehole pressure and geometry in bench
blasting. Note that the burden, B, and spacing, S, are held
constant in Models I, II, and III, while the specific charge increases. The specific charge in Models IV and V is the same as in Model II, while the burden and spacing distances
increase as S=B¼1:2. The detailed blast patterns are
summarized in Table 2. Note that the specific charges are higher than that used in a field blast.12) This is because the specific charges do not include the rock mass volumes around the stemmed length of blast holes.
To apply a blast pressure to the holes, the following pressure functionPðtÞwith respect to the timetwas used:
PðtÞ ¼PjwlðVðtÞÞPsðtÞ ð1Þ
where PjwlðVðtÞÞ is the JWL pressure,20) which has been extensively used to describe the isentropic expansion of
detonation products, and is called the JWL equation of state, andPsðtÞdenotes a pressure-time function, as shown in Fig. 3. In the figure,t1is the rise time (10ms) andt2andt3denote the
decay time, which totals 5 ms. The rise time corresponds to the shock wave incident on the hole wall and the decay time
Fig. 1 Analysis model for bench blast simulation.
[image:2.595.307.548.410.498.2]Fig. 2 Finite element layout for the analysis models.
Table 1 Properties of the analysis model.
Parameter Value
Mean compressive strengthxc(MPa) 75
Mean tensile strengthxt(MPa) 5
P-wave velocityCp(m/s) 2000
Elastic Modulus (GPa) 9
Density(kg/m3) 2700
Coefficient of uniformitym 5 Fracture energyGf(Pam) 300
t3 t1
Pressure
Time t2
Ps
Fig. 3 Pressure-time history for gas pressure in the boreholes. Table 2 Blast patterns for the bench blast simulations. Model Burden Spacing Specific charge
(m) (m) (kg/m3)
Model I 2.0 2.4 1.14
Model II 2.0 2.4 1.53
Model III 2.0 2.4 1.72
Model IV 1.5 1.8 1.53
[image:2.595.326.528.606.766.2] [image:2.595.57.274.657.770.2]is the duration of detonation gas pressurization on the hole wall. The pressurePjwlðVðtÞÞas a function ofVðtÞat constant entropy can be written as:
PjwlðVðtÞÞ ¼AexpðR1VðtÞÞþBexpðR2VðtÞÞþCVðtÞð!þ1Þ ð2Þ
where, A¼87:611(GPa), B¼0:0798(GPa), C¼0:0711
(GPa), R1¼4:30566, R2¼0:89071, and !¼0:35. The
parameters were for ANFO explosive.21)VðtÞis the relative volume,VeðtÞ=Vo. Here,VeðtÞis the volume of gas produced andVois the volume of the explosive.
2.2.2 Rock fracture process in the bench blast
simula-tions
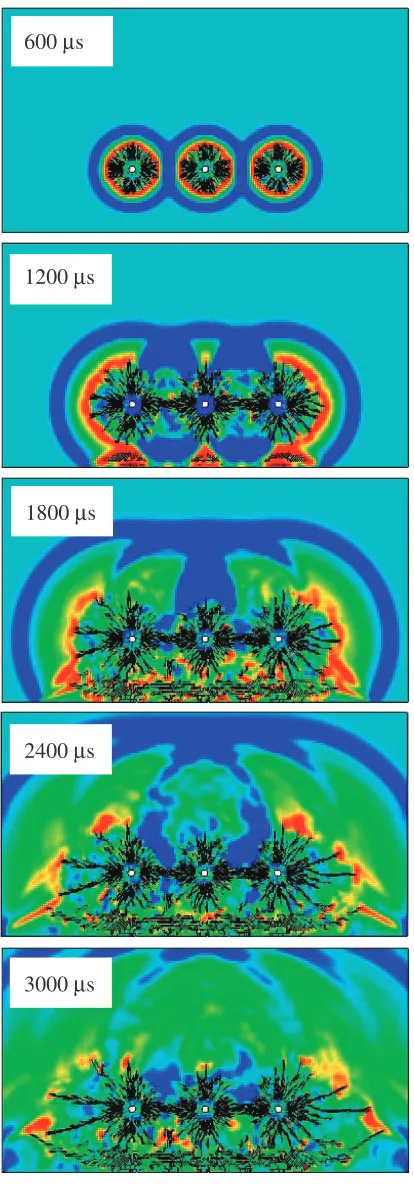
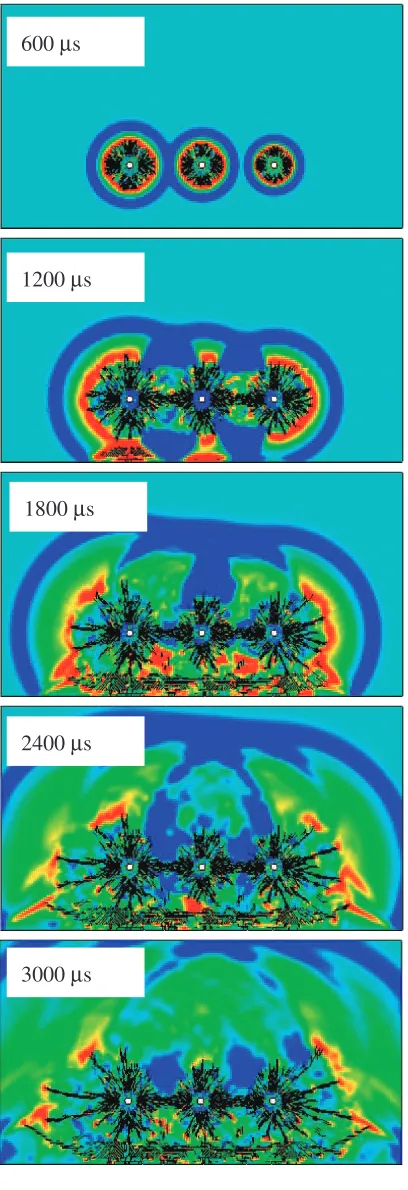
Figure 4 shows the fracture processes with the maximum principal stress field and crack propagation in Model I at
600-ms intervals. Compressive fractures were generated around
the holes by compressive stress waves that were due to the sudden high pressurization in the holes. Here, the non-cracking zones around the holes correspond to the compres-sive fracture zone. The region near the blast hole is fractured without cracks and radial cracks are generated in the outer region. The stress fields, which correspond to the tangential (hoop) stress, extend from the bole and radial cracks are generated from near the compressive fracture zone. At
1200ms, the radiating compressive stress waves from the
center hole released the radiating tensile stress from the side holes. The radiating tensile stress from the side holes was also released by the radiating compressive stress from the side holes. This arrested the radiating cracks. The reflected tensile stress near the free face generated the spallings and tensile cracks perpendicular to the free face. The reflected waves were also affected by the radiating compressive stress from other holes. Although there was superposition of the stress waves near the free face, many tensile cracks were, in fact, generated because the superposed stress waves were reflected as tensile stresses, causing many tensile cracks near the free
face. The fracture processes were finished at 1800ms. From
the final fracture pattern, the boulders were found between the spacings and the predominant fractures at the craters. Radial cracks between the free face and the blast holes were particularly well developed.
These fracture processes demonstrated that the predom-inant fracture mechanism in the simultaneous blasting examined here was the tensile fracturing (spalling) generated by the reflected tensile stresses from the superposition of radiating stress waves from adjacent holes and the craters between the holes and the free face.
2.2.3 Numerical fragment size distribution
The approaches involving in the image analysis and the fines correction as described in Section 2.1 are progressed to evaluate the fragment size distribution for the bench blast simulations. Figure 5 shows the selected fracture patterns from the fracture processes in the five models used to analyze fragment size, with the exception of the compressive fracture zones. These images show that in bench blasting, boulders are produced between the holes and the free face, and that the fragments are predominately generated at the craters and between the holes. Figure 6 shows the delineation results from the selected regions. The fragment size distributions were also calculated using the image analysis program. Figure 7 shows the cumulative passing percentage as a
function of fragment size. The numerical fragment size distributions, including the fines, were plotted as log-linear size distributions in Fig. 8. After correcting the fragment size distributions in Fig. 7 with the evaluation of the fines, the curves emerge as approximately parallel, as shown in Fig. 8 These trends concur with experimental results of rock
1800
µ
s
2400
µ
s
3000
µ
s
600
µ
s
1200
µ
s
[image:3.595.324.531.70.668.2]fragmentation, in which the mean particle size shifts with the excavation method, but the distribution curves parallel each
[image:4.595.80.541.69.411.2] [image:4.595.51.310.73.413.2]other.22) Detailed descriptions of the data can be found in
Table 3.
2.3 Influence of blast pattern on fragmentation in bench
blast simulations
The bench blast models used above each have different blast conditions. In order to investigate the influence of
(a) Model I
(b) Model II
(c) Model III
(d) Model IV
(e) Model V
Fig. 5 Bench blast simulation results and the selected areas for image analysis for all the Types.
(a) Model I
(b) Model II
(c) Model III
(d) Model IV
(e) Model V
Fig. 6 Automatic delineation results for the fragment size calculations.
1E-5 1E-4 1E-3 0.01 0.1 1 10
20 40 60 80 100
P
assing Percentage (%)
Size (m)
Model I Model II Model III Model IV Model V
Fig. 7 Numerical fragment size distributions obtained by image analysis.
1E-5 1E-4 1E-3 0.01 0.1 1 10
0 20 40 60 80 100
P
assing Percentage (%)
Size (m)
Model I Model II Model III Model IV Model V
[image:4.595.297.526.73.407.2]Fig. 8 Numerical fragmentations for all the types on a log-lin plot.
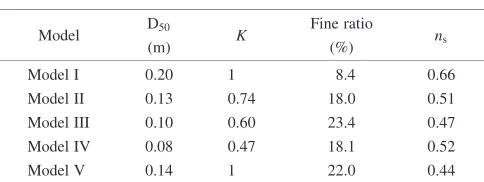
Table 3 Blast simulation results.
Model D50 K Fine ratio ns
(m) (%)
Model I 0.20 1 8.4 0.66
Model II 0.13 0.74 18.0 0.51
Model III 0.10 0.60 23.4 0.47
Model IV 0.08 0.47 18.1 0.52
[image:4.595.317.533.467.621.2] [image:4.595.62.276.476.639.2] [image:4.595.306.548.693.784.2]specific charge on fragmentation, the fragment size distribu-tions in Models I, II, and III, which have different specific charges for the same burden and spacing, were compared in
Fig. 9 The mean particle size D50, top size K, and ns
decreased as the specific charge increased, while the fines ratios increased. Herensis the material constant for Gaudin-Schumann distribution.12)These results indicate that increas-ing the specific charge causes small fragments, but decreases the uniformity of the fragments. These results concur with field experiments.6)
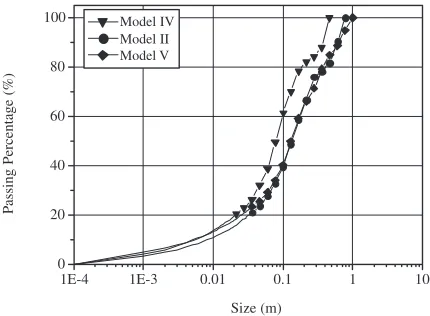
To investigate the influence of burden and space distances on fragmentation, the fragment size distributions in Models II, IV, and V are compared in Fig. 10. The burden and spacing distances increased using a constantS=Bratio. With increasing burden and spacing distances, the mean particle
size D50, top size K, and fines ratio increased, while ns
decreased. The mean particle size in Models II and V was constant because the fines ratio increased in Model V. In the fines correction approach, the fragment size distribution in Model V, which had a bigger fines ratio, was affected. The fines ratios in Models II and IV were almost the same. This might be due to the nonlinear response of compressive fracture in the models. In other words, because the dynamic fracture process analysis used in this study considered a nonlinear response for the fracture process, the estimated
compressive fracture zones varied nonlinearly with the burden, spacing, and specific charge. These results indicate that increasing the burden and spacing decreases fragment uniformity.
In this study, the crushed zones due to compressive fractures around the holes were treated as the fines zone, and the tensile fractured zones were analyzed for the fragment size distribution of coarse fragments. Practical fragmentation is seldom estimated using a simple prediction equation. Therefore, it is conceivable that a model for predicting rock fragmentation with rock blasting must consider all the fracture mechanisms.
Additionally, the fragment size distributions predicted in this study were due to compressive fractures, the craters generated by radial cracks, tensile cracks near the free face, and reflected stress-induced fractures (spalls), which con-stitute the fundamental mechanism in bench blasting. There-fore, the predicted rock fragmentation reasonably represented the fragmentation in a field bench blast. It is expected that the proposed numerical approach can be applied to the design of blasting patterns to control fragmentation. Of note, the proposed numerical approach not only predicts a realistic fragment size distribution, but also evaluates the fines generated using various blast patterns.
3. Discussion
3.1 Fragmentation control with respect to the blast
pattern
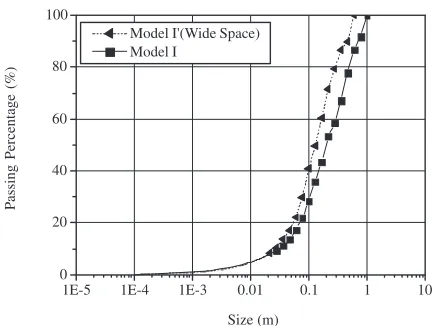
As found in Table 3 the mean fragment size increased with the specific charge. Here, we consider whether it is possible to reduce the mean fragment size without increasing the fines percentage. In practice, a widely spaced pattern and small-diameter auxiliary holes between the holes and the free face are used. Considering the bench blast simulations, using a widely spaced pattern may reduce the superposition of stress waves by increasing the travel distance from adjacent holes. To investigate a widely spaced pattern, Model I was changed to consider a 1.5 m burden and 3.2 m spacing, to maintain the same specific charge. Figure 11 shows the fracture process with a widely spaced pattern. Contrary to the fracture processes in Fig. 4, the superposition of the radiating stress wave and traveling stress wave from adjacent holes occurred later, and the stress waves from the adjacent holes did not affect crater formation, which generally predominates in the fractured zone in bench blasting. The reflected stress waves from the superposed stress waves generated tensile fractures between adjacent holes and the free face, where boulders are generated in bench blasting. This improved the fragmentation in Model I. Figure 12 compares the fragmentation in the two fracture processes. The fragments with the widely spaced blast pattern were smaller than those in Model I, except for the size in the fines distribution. The mean particle size D50,
top sizeK,ns and the fines ratio were 0.13 m, 0.59 m, 0.75
and 7.95 respectively. These results confirm that widely spaced patterns generally produce more uniform fragmenta-tion in bench blasting. Alternatively, if auxiliary holes are drilled appropriately between two adjacent holes and the free face, it is natural that the boulder zone will be reduced, as shown in Fig. 5, without increasing fines.
1E-4 1E-3 0.01 0.1 1 10
0 20 40 60 80 100
P
assing Percentage (%)
Size (m)
Model I Model II Model III
Fig. 9 Variation of the fragmentation with specific charge increase.
1E-4 1E-3 0.01 0.1 1 10
0 20 40 60 80 100
P
assing Percentage (%)
Size (m)
[image:5.595.60.279.73.229.2]Model IV Model II Model V
[image:5.595.61.276.609.767.2]3.2 Fragmentation control with respect to delay timing The numerical findings in Section 2.2.2 showed that the superposition of stress waves generated by the simultaneous detonation of the holes arrests cracks radiating from adjacent holes. In studies examining the superposition of stress waves,
Preece and Thorn23) used a damage constitutive model to
show that a delay time of 0.0 sec between adjacent blastholes results in significantly more fragmentation than a 0.5-ms
delay. While Liu and Katsabanis24)used a newly developed
continuum damage model to show that wave collisions or
superposition do not benefit rock fragmentation and that it is not necessary to use delay detonators with microsecond accuracy. The argument about fragmentation-related delay timing has not been resolved. Here, it is worth noting that they did not consider the fracture process in rock, which is an inhomogeneous material, or the interaction of stress waves and crack propagation.
600 µs
900 µs
1200 µs
1500 µs
[image:6.595.326.530.72.667.2]1800 µs
Fig. 11 Maximum principal stress distribution and crack propagation in a wide space blast model.
600
µ
s
1200
µ
s
1800
µ
s
2400
µ
s
[image:6.595.55.284.74.609.2]3000
µ
s
To examine the effect of delay timing, the time interval of the blastholes in Model I was increased to 0, 100, 500, 1000,
and 2000ms. Figure 13 shows the fracture processes with
stress fields when the delay interval is 100ms. The fractures caused by radiating stress waves from hole 1 are well developed; the radial cracks and spallings generated by the stress wave from hole 2 were affected by the stress waves from hole 1. Although the stress waves from the other holes caused crack arrest, tensile cracks (spalls) developed well near the free face, due to the superposed stress waves from adjacent holes. Here, it is conceivable that the interaction of stress waves and cracks, and the superposition of stress waves, varied with increasing delay time. The estimated fragmentation with increasing delay time was compared to investigate the influence of delay timing on fragmentation, as shown in Fig. 14. Practically, it is very difficult to reproduce the same fragmentation seen previously, despite using the same blast pattern at the same site, due to the inhomogeneity of rock. To consider the influence of rock mass inhomoge-neity on the predicted fragmentation with various delay timings, five blast models with different microscopic dis-tributions of strength were simulated and the mean fragment sizes are compared in Fig. 15. The numbers in the legend are random numbers generated to give different spatial distribu-tions of the microscopic strength distribution. These
com-parisons showed that the average mean fragment size oscillated with increasing delay time, due to phase variation in the interaction of stress waves and cracks, and the superposition of stress waves with increasing delay time. Therefore, the proposed numerical approach resolved the argument concerning the fragmentation-related delay time. The damage model used in previous studies of fragmentation is not appropriate for estimating fragmentation in bench blasting.
As described in the introduction, the optimum time interval is of millisecond order. From the viewpoint of controlled fragmentation with respect to the optimum time interval, this implies that a different fragmentation mecha-nism has to be considered. It is well known that stress waves generate blast-induced fractures, which extend under the action of gas pressure. The bench blast simulations in this study did not consider gas pressurization.
3.3 Optimum fragmentation with respect to delay
tim-ing
The effect of delay timing at adjacent holes was discussed in the previous section. Practically, the optimum time interval is of millisecond order. The section showed that boulders are produced between adjacent holes and the free face. In bench blasting, the existence of the free face plays an important role in causing the predominant fractures to be the crater and reflected wave induced-tensile fractures. Cracks traveling at an angle of 40–80 degrees to the normal of the free surface
have a greater propagation velocity.25)The angle increases
with increasing burden. Wilson2) confirmed these fracture
phenomena experimentally and numerically, and showed that, in any case, once the P-wave causes two radial cracks at approximately 20 to 30 degrees to the bench face to advance ahead of the others, the gas pressure loading acts to greatly favor further propagation of those same two cracks.
Figure 16 shows the interaction of crack extension, due to the gas flow and stress wave from the adjacent hole (Hole 1), with shot delay time. Assuming that the crater is completely separated by the gas pressurization, the crack forms a new free face, as shown in Fig. 16. It is conceivable that after a time delay, the crack that is due to gas pressurization plays a role at a free face, and interacts with the stress wave radiating from the adjacent hole (Hole 2 in Fig. 16). It is possible that
1E-3 0.01 0.1 1
0 20 40 60 80 100
Delay time=0 µs Delay time=100 µs Delay time=500 µs Delay time=1000 µs Delay time=1500 µs Delay time=2000 µs
P
assing Percentage (%)
[image:7.595.60.277.70.233.2]Size (m)
Fig. 14 Size distributions on a log-lin with the variation of delay time between holes.
0.00 0.25 0.50 0.75 1.00 1.25 1.50 0.15
0.20 0.25 0.30
Mean fragment size (D
Delay Time/Burden (ms/m)
Case 1 Case 2 Case 3 Case 4 Case 5
50
)
Fig. 15 Variation of average size with the ratio of delay time and burden.
1E-5 1E-4 1E-3 0.01 0.1 1 10
0 20 40 60 80 100
P
assing Percentage (%)
[image:7.595.318.537.76.233.2]Size (m) Model I'(Wide Space) Model I
[image:7.595.60.279.602.756.2]effective fragmentation caused by a free face effect may be expected.
Suppose that the stress wave from Hole 1 generates a predominant crack passing through Point A and detonation gases flow through the crack and pressurize its walls. After a delay time, the stress waves radiate from Hole 2. The time the gas flow from Hole 1 arrives can be derived as:
tg¼
1
Cgcos
x¼ 2
ffiffiffiffiffiffiffiffiffiffiffiffiffiffiffiffi
B2þS 2
4
r
CgS
x ð3Þ
where,Cgis the gas propagation velocity. The time at which
radiating stress waves arrive from Hole 2 can be derived as:
tp¼
4
ffiffiffiffiffiffiffiffiffiffiffiffiffiffiffiffiffiffiffi
9S2
16 þ B2
4
r
3SCp
ðSxÞ þDt ð4Þ
where, Cp is the P-wave velocity andDt is the delay time.
Finally, assuming that the gas flow from Hole 1 meets the radiating stress wave from Hole 2 at Point A in Fig. 16
(x¼S=4); from that moment, a fragmentation effect due to
the formation of a new free face increases dramatically. Then, if we letx¼S=4, eq. (4) can be rewritten as:
Dt¼
ffiffiffiffiffiffiffiffiffiffiffiffiffiffiffiffi
B2þS 2
4
r
2Cg
ffiffiffiffiffiffiffiffiffiffiffiffiffiffiffiffiffiffiffi
9S2
16 þ B2
4
r
3Cp
ð5Þ
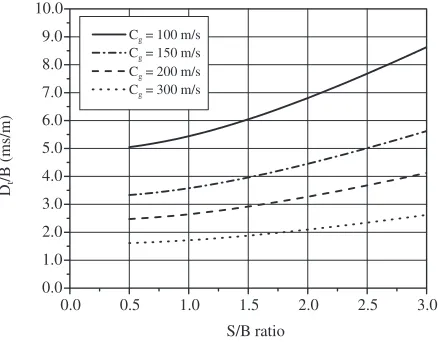
Using eq. (5), the optimum fragmentation condition can be represented as the relationship between the ratios Dt=Band
S=B. Figure 17 shows the variation in the optimum
fragmentation condition with various gas flow velocities,
Cg. As an example, let us refer to Model I in the Section 2.2
and consider Cg¼178m/s, which corresponds to an
experimental result.26) From this, D
t can be estimated. The
interactions of the gas flow and stress wave from the adjacent hole are described in Fig. 18. The optimum delay time for Model I was 3.1 ms/m, which is within the range of optimum delay times determined in the field bench blast tests. Ultimately, optimal fragmentation in the field with respect to delay time depends strongly on the gas flow through the fractures caused by the stress wave.
Although this study did not consider specific discontinu-ities in the rock models, from its perspective with regard to the inherent flaws in rock and discontinuity, it may be said that the proposed approach did, in fact, consider flaws in the rock mass, as the dynamic fracture process analysis used is based on a fracture process that considers rock inhomoge-neity. Otherwise, from the viewpoint of the interaction of
stress waves and discontinuity, dynamic fracture process analysis should consider geological discontinuities in the rock models for more realistic modeling.
4. Concluding Remarks
Using a numerical approach, based on dynamic fracture process analysis and image analysis, five models were used to consider the effect of specific charge and geometry in bench blasting. The fracture processes in the bench blast models showed that the predominant fracture mechanism in simulta-neous blasting was constituted by the tensile fractures (spalls) generated by the reflected tensile stresses from the super-position of radiating stress waves from adjacent holes, and the craters between the holes and the free face. To investigate the influence of blast pattern on fragmentation in bench blast simulations, the fragmentation obtained using the numerical approach was compared and analyzed. With increasing specific charge, the mean particle size D50, top sizeK, and
nsdecreased, while the fines ratio increased. With increasing burden and spacing distances, the mean particle size D50, top
size K, and fines ratio increased, while ns decreased.
Therefore, only increasing the burden and spacing decreases fragment uniformity.
: Crack from the Hole 1
Crater
X : Position
S: Spacing
B: Burden
Hole 1 Hole 2
: Gas flowing from the Hole 1
: Stress wave from the Hole 2
Free face A
[image:8.595.72.267.73.160.2]θ
Fig. 16 Scheme diagram representing the interaction between gas flow and the stress wave from the adjacent hole.
0.0 0.5 1.0 1.5 2.0 2.5 3.0
0.0 1.0 2.0 3.0 4.0 5.0 6.0 7.0 8.0 9.0 10.0 Dt /B (ms/m) S/B ratio
[image:8.595.318.537.74.245.2]Cg = 100 m/s Cg = 150 m/s Cg = 200 m/s Cg = 300 m/s
Fig. 17 Variation in the optimum fragmentation condition with various gas flow velocities.
0.0 0.5 1.0 1.5 2.0
0.000 0.005 0.010 0.015 0.020 0.025 0.030 0.010 0.015 0.020 0.025 0.030 A free face
Dt= 6.2 ms (Hole 2) (Hole 1) 2.4 T ra v
el time (s)
Position x (m)
[image:8.595.314.539.296.458.2]Gas flowing from the hole 1 to the free face Radiating stress wave from the hole 1 Stress wave from the hole 2 to position A
Widely spaced blast patterns were simulated to discuses controlled fragmentation related to the blast pattern. The fracture process and fragmentation were compared with that in general bench blasting. These results confirm that widely spaced patterns generally produce good fragmentation in bench blasting. Controlled fragmentation with respect to delay timing was also discussed. This showed that the average mean fragment size oscillated with increasing delay time, due to phase variation in the interaction of stress waves and cracks, and the superposition of stress waves with increasing delay time. Ultimately it was discussed using the interaction of crack extension, due to the gas flow and stress wave from the adjacent hole, with shot delay time that the optimal fragmentation in the field with respect to delay time depends strongly on the gas flow through the fractures caused by the stress wave.
Acknowledgments
Authors gratefully acknowledge the financial support from Center of Excellence (COE) program at Hokkaido University provide by the Ministry of Education, Culture, Sports, Science and Technology of Japan. The authors also wish to thank Dr. Yamamoto Massaki and Mr. Nishi Masssaki for their helpful discussion and Mr. Kawamichi Masaki for his computational assistance.
REFERENCES
1) J. R. Brinkman: Proc. 2nd Int. Symp. on Rock Fragmentation by Blasting, (Keystone, Colorado, 1987) pp. 23–26.
2) W. H. Wilson: An experimental and theoretical analysis of stress wave and gas pressure effects in bench blasting (Ph.D. Dissertation, University of Maryland, 1987) pp. 321.
3) W. L. Fourney, R. D. Dick, X. J. Wang and Y. Wei: Int. J. Rock Mech. Min. Sci. & Geomech. Astr.30(1993) 413–429.
4) H. P. Rossmanith, A. Daehnke, R. E. Knasmillner, N. Kouznik and K.
Uenishi: Fatigue Fract. Eng. Mater. Struct.20(1997) 1617–1636. 5) V. M. Kuznetsov: Soviet Mining Science9(1973): 144–148. 6) C. V. B. Cunningham: Proc. 2nd Int. Symp. on Rock Fragmentation by
Blasting. (Keystone, Colorado, 1987) pp. 475–487. 7) R. Schumann: Am. Inst. Min. Met. Eng. (1941) 1189.
8) P. Rosin and E. Rammler: Journal of the Institute of Fuel7(1933) 29– 36.
9) L. Liu, and P. D. Katsabanis: Proc. of Rock Fragmentation by Blasting (Balkema, Rotterdam, 1993) pp. 9–16.
10) A. I. Glatolenkov and V. I. Ivanov: J. Mining Sci.27(1992) 444. 11) D. Thornton, S. S. Kanchibotla and I. Brunton: Int. J. Blasting and
Fragmentation6(2002) 169–188.
12) S. H. Cho, M. Nishi, M. Yamamoto and K. Kaneko: Mater Trans.44
(2003) 951–956.
13) U. Langefors and B. Kihlstro¨m:The modern technique of rock blasting, (Jone Wiley & Sons, Inc., Stockholm, 1963).
14) R. Gustafsson:Blasting technique, (Dynamit Nobel Wien, 1981) 75. 15) S. R. Winzer and A. Ritter:Fragmentation by Blasting, ed by Fourney,
W. L. Boade, R. R. and Costin, L. S.(eds) (Society for Experimental Mechanics, 1984) pp. 11–23.
16) O. R. Bergman: Engineering and Mining Journal174(1974) 164–170. 17) M. S. Stagg and S. A. Rholl: Proc. 2nd Int. Symp. Rock Fragmentation
and Blasting (1987) pp. 210–223.
18) N. H. Maerz, C. P. Tom and J. A. Franklin: Proc. Fragblast5 Workshop on Measurement of Blast Fragmentation (Montereal, Quebec, Canada, 1996) pp. 91–99.
19) S. H. Cho, Dynamic fracture process analysis of rock and its application to fragmentation control in blasting, Ph.D. Eng. Thesis (2003) Hokkaido University, Japan, pp. 32–34.
20) E. L Lee, H. C. Hornig and J. K. Kury:Adiabatic expansion of high explosive detonation products, (UCRL-50412, Lawrence Livermore National Laboratory, Livermore, California, 1968).
21) H. Hornberg and F. Volk: Prop. Exp. Pyro.14(1989) 199–211. 22) W. Chen, K. Fukui and S. Okubo, Proc. 4th North American Rock
Mechanics Symposium (2000) pp. 27–32.
23) D. Preece and B. J. Thorne: Proc. Rock Fragmentation by Blasting (Balkema, Rotterdam, 1996) pp. 147–156.
24) L. Liu and P. D Katsabanis: Int. J. Rock Mech. Min. Sci.34(1997) 817–835.
25) A. Ladegaard-Pedersen and A. Persson: Swedish Detonic Research Foundation, Report KL-1968: 34, Stockholm, Sweden. (In Swedish). 26) S. H. Cho, Y. Nakamura and K. Kaneko: Int. J. Rock Mech. Min. Sci.