JOURNAL OF FOREST SCIENCE, 50, 2004 (10): 478–488
Forest site can be seen as a suitable combination of abiotic and biotic factors whose macro-climatic condi-tions, predominantly oceanic or transient climate, form the environment for potential presence of forest ecosystems (cf. FORMAN, GORDON 1986; NAVEH 1987; ZLATNÍK
1975; BUČEK, LACINA 1999; BUČEK 2002). If it is theoretically possible to predict a continuous effect of active community on the ecotope of a particular stand and its importance for biogeochemical cycles and ability to change the ambient environment, we can hypothesize that biocoenosis will be able to reflect this effect in con-ditions of complex stress factors within the scope of its resilience, resistance, adaptation and selection until its synergic influence exceeds the point of depletion when the community is destroyed.
The aim of the analysis is to establish the relationship between natural vegetation and specified pedochemical properties of H- and A-horizons in relation to the natural potential of the site on a selected set of ten permanent research plots (PRPs) of substitute stands on Poříčský hřbet Plateau (+6.9°C; 671 mm) in the south-western part of Broumovská vrchovina Highlands near the emis-sion source Trutnov-Poříčí (pollution damage zone B), by which it will be possible to substitute stands to be formed successively under conditions of permanent an-thropogenic load. The set of ten selected PRPs is a part of the demonstration object (DO) of the firm Městské lesy Trutnov. Through them biological amelioration in air-pol-lution conditions is systematically followed (KANTOR
1989; TESAŘ et al. 2000; LOCHMAN et al. 2001). Ten plots used for this study are the set of monoculture or mixed
pole-stage stands with native or introduced trees (Table 6). Existing available data on the level of phytocoenological relevés on PRP were obtained separately for silver birch (Betula pendula) stands (KANTOR, ŠACH 1988). It is evident from this investigation that in a dynamic period between 1981 and 1982 the birch stand was in the thicket stage. Luzula luzuloides, Agrostis stolonifera, Holcus mollis and Lycopodium annotinum were especially domi-nantly present.
MATERIAL AND METHODS
Site characteristics of permanent research plots
A set of ten PRPs was selected that by their location and stand environment were exactly the same as that of KAN
-TOR (1989). These PRPs are situated in the south-western part of Broumovská vrchovina Highlands in Kuchyňka locality (50°33´44´´N, 15°57´19´´E; 530 m a.s.l.) 1.4 km away from the power station Trutnov-Poříčí as a source of air pollutants. As the emission source was completely desulphurised in 1998, a decrease in depositions in DO was measured in 1994 (MIKESKA et al. 1998; MŽP 1999; TESAŘ et al. 2000). The main pollutants in DO were especially SO4–2, F–, NH4+, Cl– and were accompanied by
alkaline ash deposition. Since the power-station opera-tions were changed (1982–1983), a pronounced decrease in deposition on an equilibrated level < 2,500 tons/year has been indicated until now (LOCHMAN et al. 2001).
Recent development of soils present on the study plots is represented by Ferralic Cambisol (ISSS-ISRIC-FAO
Problems of the statistical evidence of feedbacks between forest herb
phytocoenoses and soil acidity at pollution load
P. S
AMEC, V. V
RANOVÁ, P. F
ORMÁNEKFaculty of Forestry and Wood Technology, Mendel University of Agriculture and Forestry,
Brno, Czech Republic
ABSTRACT: Emissions and ecological factors are evident in changes of dynamics of global forest ecosystems. Specific develop- ment takes place in these substitute stands on contaminated and devastated plots. The aim of this study was to solve a problem if forest stands were able to indicate its real natural potential in these anthropogenically influenced conditions. In ten substitute stands on experimental plots samples were taken in autumn 2002 from H-horizons and A-horizons and phytocoenological relevés were taken in the area of the firm Městské lesy Trutnov (Poříčský hřbet Plateau, 530 m a.s.l.; +6.9°C; 671 mm). A hypothesis that the combination of herbaceous species can significantly indicate pH/H2O and pH/KCl was tested.
1998) [L – F – H – Ah (Ahe) – Bz (ABz) – Bv – BC – Cr]. Four sub-forms of humus layer (GREEN et al.
1993) are represented by: Hemimor (determined on four PRPs), Mormoder (determined on one PRP), Mullmoder (determined on two PRPs) and Leptomoder (determined on three PRPs).
The locality belongs to the climatic region of Central European transient macro-climatic zone with continental course of precipitation in summer and with coastal winter. Meteorological station at Trutnov (427 m a.s.l.) has aver-age temperature +6.8°C and annual precipitation 778 mm and Úpice station (416 m a.s.l.) has average temperature +7.0°C and annual precipitation 671 mm (in the range be-tween 492 and 862 mm) for the period of 1965–1996. The average sum of annual precipitation in DO was 757 mm in 1981–1987, with maximum up to 909 mm (KANTOR,
ŠACH 1988; KANTOR 1989; MIKESKA et al. 1998; LOCH -MAN et al. 2001).
Methods of phytocoenological analyses
The basic semi-quantitative description methodology of vegetation cover is according to a handbook published by ZLATNÍK (1975), followed by RANDUŠKA et al. (1986). The nomenclature of recorded vegetation species is modi-fied according to methodological manuals of indicative values of these taxa (AMBROS 1986; AMBROS, ŠTYKAR
1999) in accordance with geobiocoenological site clas-sification (BUČEK 2002) and successful discussion about potential biocoenoses in accordance with geobotanical classification (ELLENBERG et al. 1992; MORAVEC et al. 1994; CHYTRÝ et al. 2001).
Minimal size of the stand area of phytocoenosis for de-limitation of phytocoenological plots in all used PRPs was taken as 400 m2 (20 × 20 m) (RANDUŠKA et al. 1986). In
October 2002 relevés of the autumn phytocoenological as-pect were made. Repetition of semi-quantitative description of synusia was performed in May 2003, when relevés of the spring phenological aspect were made out and proces- sed. Description of ground synusia came from semi-quantitative judgments of gradational values (Table 2) and their perceptual conversions of combined scale of abundance-dominance (CSAD). By this method aggregate data on the biodiversity and degree of herb layer coverage on particular PRPs, also on average in the framework of all stands were original for bioindication of particular trophic series (TS), were obtained (ZLATNÍK 1976).
Methods of soil analyses
Soil surveys were carried out on ten selected PRPs, and simultaneously phytocoenological relevés of the naturally spreading undergrowth were done. The values of pH/H2O and pH/KCl in H- and upper mineral soil
layer of A-horizons at maximum thickness 2–5 cm were assessed. Sampling was performed in October 2002 at three randomly selected points of every stand to corre-spond with phytocoenological relevés. Soil samples were mixed, sieved and dried in laboratory. Soil acidity was determined by a combination glass electrode (soil: H2O
or 1M KCl = 1:2.5).
These results were consequently compared with the results of surveys of herbaceous synusia from the au-tumn phenological aspect on PRPs and were statistically evaluated. The discussion about reciprocal bioindicative linkages between undergrowth herbaceous vegetation and studied pedochemical characteristics of H- and up-per mineral soil layers of A-horizons relies especially on significant trophic connections between plant species and conditions of particular trophic series (Table 1).
Methods of statistical analyses
Coefficients A’ and E are basic input data for testing normality upon z0.025 = 1.96 and verification of minimal set
[image:2.595.64.292.503.596.2]size, if the independence of values of data selection is as-sumed. Homogeneity of acquired data was verified using Table 1. Spectra of trophic conditions indicated on the set of
selected PRP based on geobiocoenological site classification (after BUČEK, LACINA1999)
Trophic series pH/H2O BS (%) C/N
A < 3.5 < 10 > 30
AB 3.8–4.2 10–20 25–30
B > 4.2 > 20 < 25
BC 5.0–5.6 40–80 12–16
C 5.7–7.0 50–90 10–12
Table 2. Differentiation of indicative values of phytocoenologically describable eco-elements (according to AMBROS, ŠTYKAR 1999). TS – temperature sums; PR – penetrating radiation; SM – soil moisture; SA – soil acidity (pH/H2O); NC – nitrogen
content
Indicative value Definition of eco-elements
TS (°C) PR (%) SM (%) SA (pH) NS
1 < 1,400 < 30 < 40 < 4.3 very weak
2 < 2,350 < 50 < 80 < 5.6 weak
3 1,400–2,950 > 30 40–100 4.3–6.8 medium
4 > 2,350 > 50 > 80 > 5.6 rich
5 > 2,950 >> 50 > 100 > 6.8 very rich
[image:2.595.68.531.642.758.2]Dixonov’s non-parametric test whose result is influenced by a possible failure to comply with an assumption of normal distribution. Critical value of Dixonov’s test was assigned as Q10; 0.05 = 0.412.
Methods of one-way and two-way analyses of variance (ANOVA) were considered as parametric tests with ran-domised effects. Significance of analyses of variance was always assessed on the level P < 0.05. Tukey’s test was used for multiple comparison of statistically significant differences.
The significance of regression model was evaluated by Fisher-Snedecorov’s F-test at P < 0.20 ^ P < 0.05. The significance of regression model when onlyP < 0.20 is taken as tolerable only if α = 0.20 can be further used as the level of significance upon testing two data sets with normal distribution (cf. ZAR 1994).
The hypothesis of right construction and interpretation of linear regression models was derived from results of regression diagnostic (MELOUN, MILITKÝ 1994, 2002).
Regression diagnostic was concentrated on residue analyses and Cook-Weisberg’s test that enable, after comparison of results Sf < χ2 (1), to detect the absence of
possible heteroscedasticity. The feasibility of construc-tion of regression models whose entering variables did not fulfil the hypothesis of normality and homogeneity was explained if modified Fisher-Snedecorov’s F-test (MELOUN, MILITKÝ 2002) approved F > F0.20 and as a
cause of this relationship.
The suitability of construction of regression models whose entering variables did not fulfil the expectations of normality and homogeneity was explained provided that modified Fisher-Snedecorov’s F-test proved F >
F0.20 as only heteroscedasticity of residues of variables under explanation was found out a reason for this re-lationship.
The usability of such values yi is generally possible until proper transformation is carried out (TUKEY 1977). In case
the outliers were able to decrease significant co-relativity between other values, then for the needs of interpretation of results on the basis of detailed comparisons they were pointedly omitted, and the results were compared with regression model of untreated data using Chow’s test. All the other cases of regressions model analyses were marked
as detection of statistically unrelated data or improper regression model.
RESULTS
Silver birch (Betula pendula), small-leaved linden (Tilia cordata) and locally European beech (Fagus sylvatica), European hornbeam (Carpinus betulus) and uniquely re-generation of sessile oak (Quercus petraea) represent the naturally spreading forest tree species in studied PRPs of substitute stands.
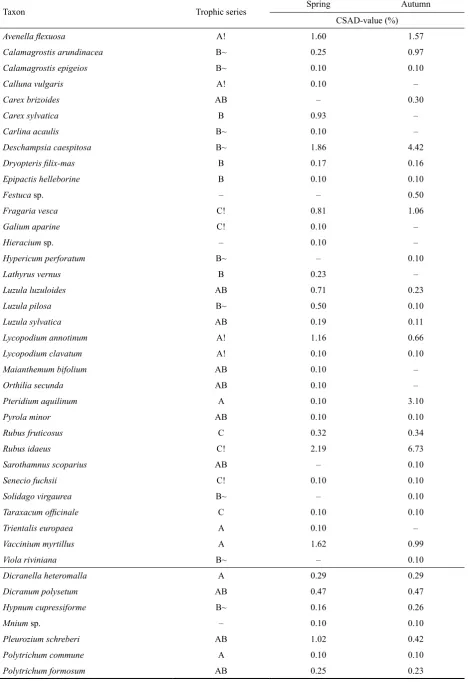
In the framework of ground herbaceous vegetation the highest average abundances were found out in Rubus idaeus, Pteridium aquilinum, Deschampsia caespitosa, Avenella flexuosa, Fragaria vesca, Vaccinium myrtillus, Calamagrostis arundinacea, Lycopodium annotinum, L. clavatum and mosses Dicranum sp., Dicranella hetero-malla and Pleurozium schreberi (Table 4).
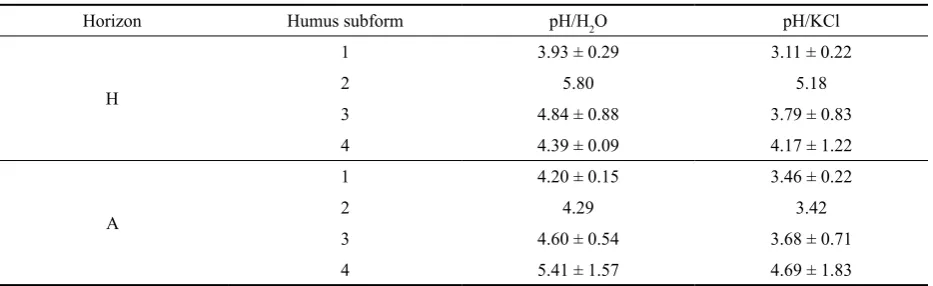
Two-way ANOVA did not evidence any statistically significant differences between pH values of organic and organo-mineral soil layers. It means the chthonophytic biota can show generally uniform relations to both layers and indicates a statistically conformable interval of soil acidity(cf. Table 5). Table 3 shows how the forest envi-ronment together with specific soil biota causes successive differentiation of humus subforms. Two-way ANOVA suggests that total diversity and abundance – dominance of recorded herbaceous phytocoenoses show the generally identical set of ecological factors during both observed phenological aspects. Indication of generally identical ecological habitats and stand conditions on PRP with silver birch existed at least in 1981–2002.
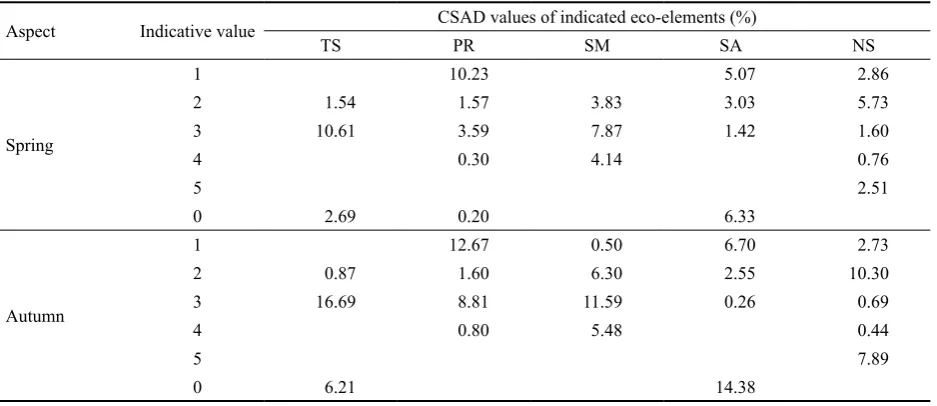
Nevertheless, variations of phytocoenological data within particular PRPs were evaluated as significant. Therefore, the stand microclimate can be considered as a reason for different coenotic effects of ground vegetation. Table 5 shows the distribution of CSAD values for par-ticular ecoelements given by herbaceous phytocoenosis. Only the ecoelement TS was not detected as influenced by stand thinning. Only the plot with Pinus sylvestris stand was different from other PRPs in identifiable ecoelements. Probably, the extensive pine-tree litterfall was a cause that the undergrowth (Rubus fruticosus, R. idaeus, C.
arundi-Table 3. Description of soil acidity (x ± ρ) at sites with particular subforms of humus layer of H- and lower A-horizons (1 – Hemimor, 2 – Mormoder, 3 – Mullmoder; 4 – Leptomoder)
Horizon Humus subform pH/H2O pH/KCl
H
1 3.93 ± 0.29 3.11 ± 0.22
2 5.80 5.18
3 4.84 ± 0.88 3.79 ± 0.83
4 4.39 ± 0.09 4.17 ± 1.22
A
1 4.20 ± 0.15 3.46 ± 0.22
2 4.29 3.42
3 4.60 ± 0.54 3.68 ± 0.71
[image:3.595.66.533.613.756.2]Table 4. Average synusia of detected herbaceous and moss species
Taxon Trophic series Spring Autumn
CSAD-value (%)
Avenella flexuosa A! 1.60 1.57
Calamagrostis arundinacea B~ 0.25 0.97
Calamagrostis epigeios B~ 0.10 0.10
Calluna vulgaris A! 0.10 –
Carex brizoides AB – 0.30
Carex sylvatica B 0.93 –
Carlina acaulis B~ 0.10 –
Deschampsia caespitosa B~ 1.86 4.42
Dryopteris filix-mas B 0.17 0.16
Epipactis helleborine B 0.10 0.10
Festuca sp. – – 0.50
Fragaria vesca C! 0.81 1.06
Galium aparine C! 0.10 –
Hieracium sp. – 0.10 –
Hypericum perforatum B~ – 0.10
Lathyrus vernus B 0.23 –
Luzula luzuloides AB 0.71 0.23
Luzula pilosa B~ 0.50 0.10
Luzula sylvatica AB 0.19 0.11
Lycopodium annotinum A! 1.16 0.66
Lycopodium clavatum A! 0.10 0.10
Maianthemum bifolium AB 0.10 –
Orthilia secunda AB 0.10 –
Pteridium aquilinum A 0.10 3.10
Pyrola minor AB 0.10 0.10
Rubus fruticosus C 0.32 0.34
Rubus idaeus C! 2.19 6.73
Sarothamnus scoparius AB – 0.10
Senecio fuchsii C! 0.10 0.10
Solidago virgaurea B~ – 0.10
Taraxacum officinale C 0.10 0.10
Trientalis europaea A 0.10 –
Vaccinium myrtillus A 1.62 0.99
Viola riviniana B~ – 0.10
Dicranella heteromalla A 0.29 0.29
Dicranum polysetum AB 0.47 0.47
Hypnum cupressiforme B~ 0.16 0.26
Mnium sp. – 0.10 0.10
Pleurozium schreberi AB 1.02 0.42
Polytrichum commune A 0.10 0.10
Table 5. Review of total CSAD values of herbaceous phytocoenoses in relation to their ability to indicate the specific set of eco-elements of forest site. TS – temperature sums; PR – penetrating radiation; SM – soil moisture; SA – soil acidity (pH/H2O);
NC – nitrogen content (maximal value)
Aspect Indicative value CSAD values of indicated eco-elements (%)
TS PR SM SA NS
Spring
1 10.23 5.07 2.86
2 1.54 1.57 3.83 3.03 5.73
3 10.61 3.59 7.87 1.42 1.60
4 0.30 4.14 0.76
5 2.51
0 2.69 0.20 6.33
Autumn
1 12.67 0.50 6.70 2.73
2 0.87 1.60 6.30 2.55 10.30
3 16.69 8.81 11.59 0.26 0.69
4 0.80 5.48 0.44
5 7.89
[image:5.595.69.448.60.258.2]0 6.21 14.38
Table 6. A review of average synusia of selected indicating herb species in the particular selected stands
Permanent research plot A + AB + B~
–––––––––
∑ (A; C!) A + AB + B~ A AB B~
1 Picea abies 57.94 10.56 4.17 5.10 1.29
2 Picea pungens 94.68 4.45 2.15 2.00 0.30
3 Picea omorika 52.62 5.43 1.50 3.22 0.72
4 Pinus sylvestris 56.24 34.88 17.40 0.55 16.93
5 Pinus strobus 100.00 1.40 1.20 – 0.20
6 Fagus sylvatica + B. pendula 87.50 0.70 – 0.40 0.30
7 Quercus rubra 64.96 1.90 0.30 0.55 1.05
8 Betula pendula 56.04 25.43 5.94 4.65 14.84
9 Salix caprea + B. pendula 33.66 12.05 1.76 3.97 6.33
10 Populus tremula + F. sylvatica 95.00 1.90 – 1.10 0.80
Average (%) 69.86 9.87 3.44 2.15 4.28
y = 0.1369x – 0.4105
0,00 0,10 0,20 0,30 0,40 0,50
3,50 3,90 4,30 4,70 5,10 5,50 5,90
pH/H2O
C
SA
D
(%
)
CSAD y=0.1358.x-0.3918 (r=0.65)
[image:5.595.65.534.326.529.2]y=0.1382.x-0,4312 (r=0.85) Consequent model (r=0,73) Fig. 1. Statistical indication of pH/H2O in H-horizon
y = 0.1369x – 0.4105
3.50 3.90 4.30 4.70 5.10 5.50 5.90
0.50 0.40 0.30 0.20 0.10 0.00
y = 0.1358x – 0.3918 (r = 0.65) Consequent model (r = 0.73) y = 0.1382x – 0.4312 (r = 0.85)
[image:5.595.71.531.559.757.2]Fig. 2. Statistical indication of pH/H2O in A-horizon
nacea, D. caespitosa, V. myrtillus, Luzula luzuloides, Hie- racium sp.) does not indicate the real trophic potential of the site to a certain extent. Tukey’s test documents that undergrowth on PRP with pole-stage stands of P. sylves-tris is different in the indication of penetrating radiation (PR), soil moisture (SM), soil acidity (SA) (pH/H2O) and nitrogen content (NC).
To estimate potential natural fertility of the site the in-dication of trophic conditions of sites expressed in succes-sion of TS was used. From its global spectrum in a selected set of PRP herbaceous indicators of trophic series A–C (Table 1) are present. From the total degree of herbaceous phytocoenosis coverage on every PRP the most important species are oligotrophic (A) (3.44%), oligomesotrophic
y = 0.1717x – 0.5224
0,00 0,20 0,40 0,60 0,80
3,50 4,00 4,50 5,00 5,50 6,00 6,50 7,00 7,50
pH/H2O
C
SA
D
(%
)
CSAD y=0.1684.x-0.478 (r=0.64)
y=0.1754.x-0.5718 (r=0.89) Consequent model (r=0,73) 0.80
0.60
0.40
0.20
0.00
3.50 4.00 4.50 5.00 5.50 6.00 6.50 7.00 7.50
[image:6.595.73.460.552.739.2]y = 0.1684x – 0.478 (r = 0.64) Consequent model (r = 0.73) y = 0.1754x – 0.5718 (r = 0.89)
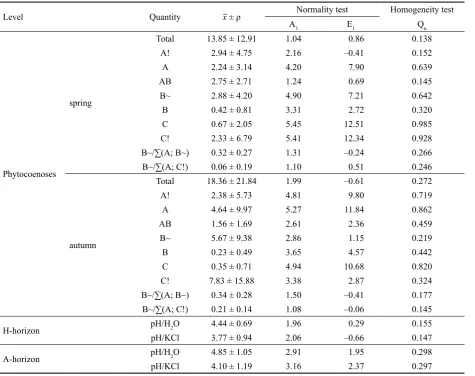
Table 7. Test of normality and nonparametric homogeneity of pedochemical and phytocoenological data
Level Quantity x ± ρ Normality test Homogeneity test
A1 E1 Qn
Phytocoenoses
spring
Total 13.85 ± 12.91 1.04 0.86 0.138
A! 2.94 ± 4.75 2.16 –0.41 0.152
A 2.24 ± 3.14 4.20 7.90 0.639
AB 2.75 ± 2.71 1.24 0.69 0.145
B~ 2.88 ± 4.20 4.90 7.21 0.642
B 0.42 ± 0.81 3.31 2.72 0.320
C 0.67 ± 2.05 5.45 12.51 0.985
C! 2.33 ± 6.79 5.41 12.34 0.928
B~/∑(A; B~) 0.32 ± 0.27 1.31 –0.24 0.266
B~/∑(A; C!) 0.06 ± 0.19 1.10 0.51 0.246
autumn
Total 18.36 ± 21.84 1.99 –0.61 0.272
A! 2.38 ± 5.73 4.81 9.80 0.719
A 4.64 ± 9.97 5.27 11.84 0.862
AB 1.56 ± 1.69 2.61 2.36 0.459
B~ 5.67 ± 9.38 2.86 1.15 0.219
B 0.23 ± 0.49 3.65 4.57 0.442
C 0.35 ± 0.71 4.94 10.68 0.820
C! 7.83 ± 15.88 3.38 2.87 0.324
B~/∑(A; B~) 0.34 ± 0.28 1.50 –0.41 0.177
B~/∑(A; C!) 0.21 ± 0.14 1.08 –0.06 0.145
H-horizon pH/H2O 4.44 ± 0.69 1.96 0.29 0.155
pH/KCl 3.77 ± 0.94 2.06 –0.66 0.147
A-horizon pH/H2O 4.85 ± 1.05 2.91 1.95 0.298
pH/KCl 4.10 ± 1.19 3.16 2.37 0.297
ones (AB) (2.15%) and even the species trophically indif-ferent B~ (4.28%) (Table 6). This sum of bioindicative species shows on average 69.86% out of the total CSAD value of recorded herbaceous phytocoenoses.
The test of data normality and homogeneity (Table 5) shows the fact that whereas no pedochemical data counteract the homogeneity selection and normality is counteracted only insignificantly, phytocoenological data do not mostly have the normal distribution and often are not homogeneous. Such a result restricts alternatives of regression model construction. Important for indication of TS was the ratio B~ species in the framework of a larger group of indicators. Especially B~/∑(A; B~) and B~/∑(A; C!) show the normality and homogeneity of results.
Two-way ANOVA supported these assumptions by ac-ceptance of hypothesis on the statistically same presence of determined ratios between indicative species groups on particular PRPs. The interval of values of the ratio B~/∑(A; B~) in autumn aspect reached 0.21–0.86 in stands with deciduous trees, while in coniferous stands it was 0.02–0.38 (0.02–0.13 in spruce stands). The ratio B~/ ∑(A; C!) in autumn aspect in deciduous stands amounted to 0.18–0.46, in coniferous stands 0.02–0.20 (0.02–0.14 in spruce stands). The highest values of both ratios in coniferous stands were always present on PRP with
P. sylvestris. Table 8 shows through correlation coef-ficients (r) the possibilities of construction of regression models with precision P < 0.20. Under the condition of failed homogeneity and its resilience to detect hetero-scedasticity significance-constructed models were verified by modifiedF-test (when F0.05 > F > F0.20). If entering cor-relative data have the normal distribution, then for n = 10 r
> 0.44 ^ F0.20 > 1.95 or statistically significant dependence at r > 0.62 ^ F0.05 > 5.32 (a) is present. Outliers, extremely out of the constructed trends, were found out especially in the degree of coverage B~ species on PRP with B. pendula
(25.58%). If this extreme value was eliminated, the
ob-tained results showed a more significant correlative trend when P < 0.05 (Table 8b). Real significance of the effects of outliers on indication of pedochemical characteristics enabled to review regression diagnostic and Chow’s test equivalence of regression models. The results of regres-sion models are shown in Figs. 1–3.
DISCUSSION
Discussion about possible dynamics of forest sites
The global evaluation of abiotic factors and designating plant species from the framework of the natural gene pool of landscape suggests the conditions in potential forest types of the group Fageta abietino-quercina (4 AB 3). The given group of forest types 4 AB 3 can be discussed as near to acidophilous beechwoods with the association
[image:7.595.304.531.93.254.2]Luzulo-Fagetum (BUČEK, LACINA 1999). This alternative classification corresponds to potential geobotanical units
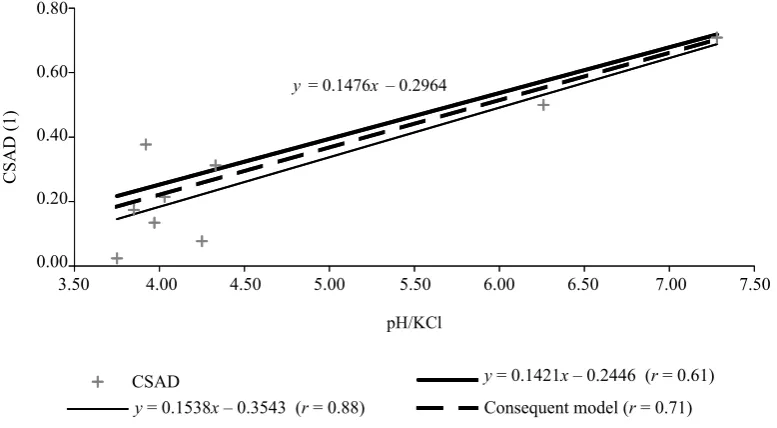
Fig. 3. Statistical indication of pH/KCl in A-horizon
y = 0.1476x – 0.2964
0,00 0,20 0,40 0,60 0,80
3,00 3,50 4,00 4,50 5,00 5,50 6,00 6,50 7,00
pH/KCl
C
SA
D
(%
)
CSAD y=0.1421.x-0.2446 (r=0.61)
y=0.1538.x-0.3543 (r=0.88) Consequent model (r=0,71) y = 0.1421x – 0.2446 (r = 0.61) Consequent model (r = 0.71) y = 0.1538x – 0.3543 (r = 0.88)
0.80
0.60
0.40
0.20
0.00
3.50 4.00 4.50 5.00 5.50 6.00 6.50 7.00 7.50
Table 8. Evaluation of correlative links between recorded indicating groups of species and pedochemical characteristics of H- and A-horizons at P < 0.20 and P < 0.05
pH/H2O pH/KCl
(a)
n
= 10
H-horizon
B~/∑(A; B~) – –
B~/∑(A; C!) 0.65 0.45
A-horizon
B~/∑(A; B~) 0.64 0.61
(b)
n
= 9
H-horizon
B~/∑(A; B~) 0.51 0.88
B~/∑(A; C!) 0.85 0.85
A-horizon
B~/∑(A; B~) 0.89 0.88
[image:7.595.73.462.526.740.2]in large areas of the bioregion (cf. CULEK 1996) and of
the complex of the Krkonoše-Jizerské hory orographic systems (cf. KOPECKÝ 1958; SÝKORA 1971).
Generalisa-tion of the given geobotanical classificaGeneralisa-tion to the alliance
Luzulo-Fagion allows simultaneously to study actual changes in assumed vegetation dynamics that can be co-herent with deviations of air-pollution load (VACEK et al.
1996; VACEK, LEPŠ 1991) or with short-term variances
of climate. Only comparison of these vegetation changes with the complex potential of forest geobiocoenosis ena-bles to discuss their trend or duration. Dynamics of forest vegetation in different regions was either in relatively natural conditions or upon atmospheric pollution found out in mature stands (cf. VACEK et al. 1996; VACEK, LEPŠ
1991; RODER et al. 1996; GÉROUT, KRIŽOVÁ 2003).
Ac-cording to SCHOENHOLTZ et al. (2000) changes of soil
acidity in A-horizons are responsible for the dynamics of biocoenoses.
GÉROUT and KRIŽOVÁ (2003) pointed out that in the
areas of the Vosges Mts. and Western Carpathians with worse trophic conditions and probably also under the ef-fect of long-term deposition load natural phytocoenoses were more sensitive to changes in pH than to changes of climatic gradients. VACEK et al. (1996) documented
the preservation of natural dynamics of beechwoods in conditions of atmospheric pollution load (1976–1995, Krkonoše Mts.), which was accompanied by a decrease of biodiversity and herb layer abundance-dominance. Nevertheless, MÍCHAL (1994) discussed the conditions
under which even substitute stands could develop. In the course of searching for trends of hypothesised successive development of communities of substitute stands, it is necessary to start from the conditions under which the permanent existence of forest stand is charac-terised by minimalisation of emission load. PODRÁZSKÝ
(1996) showed a positive effect of beech cover and lit-terfall on degradation of soils and increase in ecological stability of biocoenoses on permanent research plots in the Krkonoše Mts. These effects can proceed with de-terminable trend if natural revitalisation of environment simultaneously proceeds too.
Discussion about possible bioindication responses of the ground vegetation
Contrary to KANTOR (1989) we found out pronounced
differentiation of humus layer on the experimental plots used in this study in autumn 2002. In spite of this existing development of soil acidity it need not be caused only by buffering deviations in the ecosystem in the stand environ-ment with biological activity of soil biota, but it can be affected even by the past pollutant deposition.
At pH/H2O > 4.2 mobilisations of basic cations (Na+,
K+, Mg2+, Ca2+) and metals from the sorption complex (Al,
Mn) and their reactions with anions (SO42–, NO
3–, Cl– and
F–) can be present (LOCHMAN et al. 2001) and it depends
on stimulated decomposition of organic matter. Not only forest tree species cause differences in humification, but
also microbiological activity can take part in these proc-esses (PRIHA, SMOLANDER 1999) which depend on C/N
and N-mineralisation. Herbaceous vegetation can rapidly reflect significant changes of pH (cf.OLSSON, KELLNER
2002). If these values at sites were the same, herbaceous phytocoenoses generally indicated them. Differences in herbaceous synusia are consequently induced especially by specific stand environment, microclimate and by allelopathy. The descriptive statistic of synusia of TS indicators is influenced by relative fluctuations in the presence of particular species on PRPs and by subjective semi-quantitative estimates.
Nevertheless, geobiocoenological classification of forest sites (RANDUŠKA et al. 1986) works with more
detailed analysis of CSAD when as the expression of spe-cies coverage in the sense of geobotanical classification of phytocoenoses expresses in percent a more generalised scale of values (ELLENBERG et al. 1992; WAMELINK et
al. 2002; MORAVEC et al. 1994).
Problems to define direct correlativeness between CSAD values of indicative herbaceous species and concrete pedochemical properties were limited on the PRPs by a low number of used plots, it means sensitivity to normality and non-homogeneity. Two-way ANOVA provided the evidence that the deduced CSAD ratios were not significantly influenced by the specified stand microclimate of any PRP for indication of trophic site conditions. The occurrence of B~ herbaceous species was detected as the most important group of species on the observed plots. The position of the value CSAD B~ species in the numerator ratio to other indicating groups from the autumn aspect offers a combination correlative with soil acidity (Figs. 1–3).
Nevertheless, the composition of ground phytocoenoses on PRP with B. pendula stand was detected as an extreme value in the course of statistical analyses. Because this ef-fect can be given by causes that could not be observed and explained in the case of the used methods and aims of the survey, the phytocoenoses from this PRP were demonstra-tively removed from the construction of linear models and were tested by Chow’s test of two linear regressions com-parison. The result excepted the hypothesis in accordance with compared models. It proves that two-way ANOVA on prerequisite of contribution of B~ herbaceous species in undergrowth phytocoenoses for detecting soil acidity.
Causes of the extremeness of herbaceous phytocoenosis values on PRP with B. pendula stand can be a result of the synergic effect of relatively low closed pole-stage stand and probably high Corg mineralisation which corresponds with the microbial activity of soil. During the growth and development of birch stands it is even possible to assume a low increase in pH, N of microbial biomass and potential denitrification of soil (PRIHA, SMOLANDER 1999). These
CONCLUSIONS
The groups of indicating herbaceous taxa relatively regularly occurring on PRPs were used to solve some problems of bioindication of site conditions in air-pollu-tion areas. Species indicating TS A, AB and trophically indifferent B~ were taken as indicators of real trophic site conditions in accordance with the pedological survey. The presence of herb undergrowth developed in pole-stands of
B. pendula and P. sylvestris as extreme values rises ques-tions to compare biocoenotical and pedochemical data in polluted conditions. Between phytocoenoses in the stud-ied substitute stands particular combinations of trophic indicating herbaceous species at a certain ratio with B~ species were manifested in synusia. The statistical trend of pH/H2O indication does not deviate by the extreme
value of CSAD from PRP coverage, neither in H- nor in A-horizon. Only a steady statistical trend of pH/KCl indication was found out in A-horizons.
Recorded natural phytocoenoses are present in the studied part of DO in dependence on the climate and they reflect apparent stand conditions by its abundance and species composition.
Nevertheless, describe the same set of ecological factors. The evidence of significant dynamics of stand changes is not known. To review the vegetation dynam-ics of substitute stands in DO in pole stage is possible only theoretically. The activity of soil biota can be taken as an evidence of ecosystem dynamics reflecting the results of decomposition and humification.
Acknowledgements
We would like to express our thanks to SANJAY TE -WARI, M. Sc., M. Phil. for his friendly help with writing of
the manuscript. We thank to KLÁRA KAMLEROVÁ, Ph.D.
for her advice with terminology interpretation of stand’s radiation conditions.
References
AMBROS Z., 1986. Bioindikace abiotického prostředí lesních ekosystémů, část II. Acta Univ. Agric., 55: 33–56.
AMBROS Z., ŠTYKAR J., 1999. Geobiocenologie I. Ekolo-gicko-cenotické charakteristiky rostlin lesů a křovin Čech, Moravy a Slezska. Brno, MZLU: 80.
BUČEK A., 2002. Geobiocenologická typologie krajiny a její aplikace. [Habilitační práce.] 104.
BUČEK A., LACINA J., 1999. Geobiocenologie II. Charak-teristiky jednotek geobiocenologické typizace ČR. Brno, MZLU: 249.
CULEK M. (ed.), 1996. Biogeografické členění České republiky. Praha, Enigma: 347.
ELLENBERG H., WEBER H.E., DÜLL R., WIRTH V., WER-NER W., PAULISSEN D., 1992. Zeigerwerte von Pflazen in Mitteleuropa. Scr. Geobot., 18: 1–248.
FORMAN R., GORDON M., 1986. Landscape Ecology. New York, John Wiley & Sons Ltd.: 620.
GREEN R.N., TROWBRIDGE R.L., KLINKA K., 1993. To-wards a Taxonomic Classification of Humus Forms. Forest Sci. (Monograph No. 29), 39: 49.
GÉROUT J.-C., KRIŽOVÁ E., 2003. Comparison of indicator values of forest understory plant species in Western Carpa-thians (Slovakia) and Vosges Mountains (France). For. Ecol. Mgmt, 182: 1–11.
CHYTRÝ M., KUČERA T., KOČÍ M. (eds.), 2001. Katalog biotopů České republiky. AOPK ČR, Praha: 307.
ISSS-ISRIC-FAO, 1998. World reference basis for soil resources. World Soil Resources Reports 84. FAO, Roma: 92.
KANTOR P., 1989. Meliorační účinky porostů náhradních dřevin. Lesnictví, 35: 1047–1066.
KANTOR P., ŠACH F., 1988. Hydrická účinnost mladých náhradních porostů smrku omoriky a břízy bradavičnaté. Lesnictví, 34: 1017–1040.
KOPECKÝ K., 1958. Fytocenologická studie bukových lesů Jevanské vyvýšeniny. Sborník ČSAZV – Lesnictví, 31: 1056–1096.
LOCHMAN V., BALCAR V., ŠEBKOVÁ V., TESAŘ V., 2001. Vývoj půdních vlastností na výzkumných plochách v okolí elektrárny Trutnov-Poříčí (Lanovka, Rokytník, Studenec). Zpr. Lesn. Výzk., 46: 14–22.
MELOUN M., MILITKÝ J., 1994. Statistické zpracování expe-rimentálních dat. Praha, Plus: 839.
MELOUN M., MILITKÝ J., 2002. Kompendium statistického zpracování dat. Praha, Academia: 764.
MÍCHAL I., 1994. Ekologická stabilita. Brno, Veronica: 276. MIKESKA B., GREGOR J., SMEJKAL J., DUŠEK M.,
KRYSTÝN V., HANIŠ J., NOP Z., MACKŮ J., MINX A., VÁLEK M., 1998. Oblastní plán rozvoje lesů (OPRL) PLO 23 Podkrkonoší. Brandýs nad Labem, pobočka Hradec Králové, ÚHÚL: 200.
MORAVEC J., BLAŽKOVÁ D., HUSOVÁ M., KOLBEK J., KRAHULEC F., NEUHÄUSL R., NEUHÄUSLOVÁ-NO-VOTNÁ Z., HEJNÝ S., KROPÁČ Z., JENÍK J., KVĚT J., SAMEK V., KREČMER V., RYBNÍČEK K., RYBNÍČKO-VÁ E., ŠTĚPÁN J., 1994. Fytocenologie. Praha, Academia: 404.
MŽP, 1999. Stav životního prostředí v oblastech působnosti územních odborů MŽP a v hlavním městě Praze v roce 1998 – Královehradecká oblast. Praha, MŽP: 5–7.
NAVEH Z., 1987. Biocybernetics and thermodynamics perspe-ctives on landscape function use patterns. Landsc. Ecol., 1: 75–83.
OLSSON B.A., KELLNER O., 2002. Effects of soil acidifica- tion and liming on ground flora establishment after clear- felling of Norway spruce in Sweden. For. Ecol. Mgmt, 158: 127–139.
PODRÁZSKÝ V., 1996. Stav a vývoj lesních půd v bukových, smíšených a smrkových porostech Krkonoš. In: VACEK S. (ed.), Monitoring, výzkum a management ekosystémů na území KRNAP. VÚLHM Jíloviště-Strnady, VS Opočno: 73–78. PRIHA O., SMOLANDER A., 1999. Nitrogen transformations
in soil under Pinus sylvestris, Picea abies and Betula pendula at two forest sites. Soil Biol. Biochem., 31: 965–977. RANDUŠKA D., VOREL J., PLÍVA K., 1986. Fytocenológia
RODER H., FISCHER A., KLOCK W., 1996. Forest develop-ment on quasi-permanent plots in the Luzulo-Fagetum of the Buntsandstein-Rhon (Department of Forestry Mittelsinn) in the period from 1950 to 1990 (German). Forstwis. Cbl., 115: 321–335.
SCHOENHOTZ S.H., Van MIEGROET H., BURGER J.A., 2000. A review of chemical and physical properties as indi-cators of forest soil quality: challenges and opportunites. For. Ecol. Mgmt, 138: 335–356.
SÝKORA T., 1971. Lesní rostlinná společenstva Jizerských hor. In: Severočeské muzeum (ed.), Knižn. Jizerských hor 11. Severočeské muzeum, Liberec: 1–60.
TESAŘ V., BALCAR V., KACÁLEK D., LOCHMAN V., NEHYBA J., 2000. Vyhodnocení dlouhodobé přestavby lesa postiženého imisemi – demonstrační objekt Broumov. [Závěrečná zpráva.] Brno, MZLU: 76.
TUKEY J.W., 1977. Exploratory Data Analysis. Adison – Wes-ley: 670.
VACEK S., LEPŠ J., 1991. Analýza vegetačních změn v buko-vých porostech Orlických hor. Lesnictví, 37: 993–1007.
VACEK S., LEPŠ J., BASTL M., 1996. Vegetační změny na výzkumných plochách ve smrkových, smrkobukových a bu-kových porostech v Krkonoších. In: VACEK S. (ed.), Moni-toring, výzkum a management ekosystémů na území KRNAP. VÚLHM Jíloviště-Strnady, VS Opočno: 114–124.
WAMELINK G.W.W., JOOSTEN V., Van DOBBEN H.F., BERENDSE F., 2002. Vallidity of Ellenberg indicator values judged from physicochemical field measurements. J. Veget. Sci., 13: 269–278.
ZAR J., 1994. Biostatistical Analysis. New Jersey, Prentice Hall Int.: 584.
ZLATNÍK A., 1975. Ekologie krajiny a geobiocenologie. Brno, VŠZ: 172.
ZLATNÍK A., 1976. Přehled skupin typů geobiocénů původně lesních a křovinných ČSSR. Zpr. Geografického ústavu ČSAV Brno, 13: 55–64.
Received for publication February 9, 2004 Accepted after corrections May 25, 2004
Problematika statistické průkaznosti vazeb mezi bylinnými fytocenózami a půdní reakcí
v prostředí zatíženém imisemi
P. SAMEC, V. VRANOVÁ, P. FORMÁNEK
Lesnická a dřevařská fakulta, Mendelova zemědělská a lesnická univerzita, Brno, Česká republika
ABSTRAKT: Imisně-ekologické faktory se odrážejí ve změnách celkové dynamiky lesních ekosystémů. Specifický vývoj provází náhradní porosty na imisně kontaminovaných a zdevastovaných plochách. Předmětem studie se stalo řešení problematiky, zda v těchto antropogenně ovlivněných podmínkách dokážou lesní stanoviště indikovat svůj skutečný přírodní potenciál. Na de- seti výzkumných plochách náhradních porostů (TVP) na území demonstračního objektu na ML Trutnov (Poříčský hřbet; 530 m n. m.; +6,9 °C; 671 mm) byly na podzim 2002 odebrány vzorky H-horizontů a A-horizontů a pořízeny fytocenologické snímky. Na základě pořízených dat byl ověřen předpoklad, že konkrétní indikační kombinace bylinných druhů dokážou statis-ticky významně sledovat hodnoty pH/H2O a pH/KCl.
Klíčová slova: náhradní porosty; fytocenóza; bioindikace; trofická řada; půdní reakce
Předmětem analýzy se stala bioindikace půdní reakce H- a A-horizontů půd na vybrané množině deseti trva-lých výzkumných ploch (TVP) experimentu náhradních porostů na Poříčském hřbetu (+6,9 °C; 671 mm) v jiho-západní části Broumovské vrchoviny nedaleko emisního zdroje Trutnov-Poříčí (pásmo ohrožení B), které mohou sloužit jako jeden z předpokladů pro diskusi schopnosti náhradních porostů sukcesně se vyvíjet v podmínkách trvalé antropogenní zátěže. Antropogenní zátěží se míní především acidifikační stres, působený vstupy imisních látek do ekosystému.
Bylo zvoleno 10 TVP, které svou lokalizací a porost-ním prostředím zcela splňují návaznost na práci KAN
-TORA (1989). Tyto TVP jsou situovány v jihozápad-ní části Broumovské vrchoviny na lokalitě Kuchyňka (50°33´44´´ s.š., 15°57´19´´ v.d.; 530 m n. m.) ve vzdá-lenosti 1,4 km od zdroje imisního znečištění elektrárny Trutnov-Poříčí. Na každé z těchto ploch na rozloze po-kusných čtyřúhelníků o 400 m2 byly odebrány vzorky
Sta-tistické zpracování pořízených dat se soustředilo na hle-dání vhodných lineárních modelů při P < 0,20 ^ P < 0,05. Problematika nacházení přímé korelativnosti mezi hod-notami KSAD indikačních bylinných druhů a půdní reak-cí byla na TVP omezena malým počtem využitých ploch a z toho plynoucí náchylnosti k nenormalitě a nehomo-genitě.
Z vyhodnocené množiny zaznamenaných indikač-ních rostlinných druhů se jako klíčová projevila účast troficky indiferentních druhů (B~). Hodnocení bioindi-kačního významu účasti B~ druhů v bylinném podrostu (tab. 8) potvrzuje při P < 0,05 korelativnost jejich
sy-nuzie s hodnotami půdní reakce pH/H2O a pH/KCl (obr. 1–3).
Výsledky fytocenologického průzkumu naznačují, že přirozená druhová složka lesních ekosystémů může in-dikovat v delší časové řadě trvalé přírodní podmínky i na antropogenně změněných stanovištích. Za doklad dynamického vývoje ekosystému může být považová-na aktivita půdní bioty v odrazu výsledků dekompozice a humifikace. Zřejmě tyto procesy s předpokladem po-rostního ekologického krytu a postupně minimalizova-nou imisní zátěží podpořily výhledovou sukcesní dyna-miku šetřených náhradních porostů.
Corresponding author:
RNDr. PAVEL FORMÁNEK, Ph.D., Mendelova zemědělská a lesnická univerzita, Lesnická a dřevařská fakulta, Lesnická 37, 613 00 Brno, Česká republika