The creation and distribution of seed yield on the primary racemes and on the primary branches of rapeseed are well documented (Tayo and Morgan 1979, Daniels et al. 1983), but the dynamic of the relationship between individual branches is unknown. The compensation abilities of lower branches, especially of branches of lower grade, are not quantified.
The value of the formation and reduction of gen-erative organs is obviously not dependent only on the level of nitrogen fertilization. Obviously, it is necessary to look for the relationship not only in values of the stand density, i.e. in the competi-tion among vegetacompeti-tion and in the condicompeti-tions of environment, but also in the competition between developing organs on the plants as such, which introduces secondary racemes into the relation. The creation and reduction of generative organs on the secondary racemes developed in a different way than on the primary ones.
The highest reductions were registered in the time of the begin of ripening of the first created pods: Keiller and Morgan (1988) equally as de Bouille et al. (1988) stated, that apical zones play the role of strongest sinks for assimilates mainly in this period and therefore they have priority to younger pods and their seeds, which are for this reason more susceptible to die off.
The accessibility of assimilates before and during the flowering period is the limit for the creation of flowers (Tayo and Morgan 1979) and the total number of flower is limiting the yield potential (Mendham et al. 1981). The realization of this
po-tential is limited by the fall of flowers (Mendham and Scott 1975, McGregor 1981). As soon as the main components of the future yield are installed, i.e. the earliest developed generative organs, the yield is constituted mainly by flowers, which develop in the first 10 days from the beginning of flowering (Tayo and Morgan 1979, Tittonel 1991) the reduc-tion of the later created generative organs takes place (Bilsborow and Norton 1984). The primary racemes and primary branches have in general more fertile pods and they are from the point of view of the seed yield more productive (Daniels and Scarisbrick 1983).
MATERIAL AND METHODS
Experimental areas of the station are situated on the east side of the territory in the community of Červený Újezd. It belongs to the sugar beet produc-tion type, wheat subtype (Švachula et al. 1992).
The territory is a part of the mildly warm, rela-tively dry climatic region, with mild winters. The yearly average air temperature is 7.7°C and the average yearly precipitation totals 507.1 mm. The average temperature during the vegetation period is 13.9°C and the average total of precipitation 333 mm. The vegetation period lasts 150–160 days (4th–9th month) (Švachula et al. 1992).
Variants of the experiment were based on 4 repeti-tions and maintained in accordance to the standard technology of rapeseed growing – SVŘ (System of rapeseed production). Used variety Lirajet is
The effect of rapeseed stand density on the formation
of generative organs
P. Kuchtová, J. Vašák
Czech University of Agriculture in Prague, Czech Republic
ABSTRACT
This experiment was carried out for the study of differences in dynamics of formation and reduction of generative organs from the beginning of the flowering to the harvest, under different stand density of the winter rapeseed. The evaluation of the results of the study of stand density, confirms that from the technological point of view it is appro-priate to choose a thinner population of rapeseed. Starting with the stand density of 60 plants/m2 we do not observe
significant differences in plants during the generative stage, neither in the number of branches nor in the number of created generative organs. At this density (60 plants/m2) a significant reduction of generative organs takes place,
especially on the secondary branches. Differences in the number of fertile branches are visible in case of more dense populations only in the harvest. From the point of view of the yield it is more advantageous to support the creation of generative organs on primary racemes by agricultural interventions.
00 line half-late to late high variety suitable for all growing areas of rapeseeds. The value of seeds dose was determined by stepping up the weighting of seeds converted according to the weight of one thousand seeds (TSW) 90% termination according to required stand density. In the springtime the plots were adapted to stand densities of 10, 40, 60, 80 and 110 plants/m2.
In all variants there was determined unified nitro-gen fertilization. Nitronitro-gen was applied in the total amount of 150 kg N/ha subdivided into 3 spring doses: (1) spring reprise, (2) begin of the elonga-tion growth and (3) green bud up to yellow buts to individual plots by hand fertilizing at possibly highest homogeneity of granulate distribution in the form of ammo nitrate (LAV). One plot harvest area was 10 m2.
The average number or plants per m2 was de-termined in each repetition of each of the vari-ants every year in the early spring. In regard to the relatively high number of seeds per m2 it was necessary to reduce the population to the required density: 10, 40, 60, 80 and 110 plants per m2.
At the beginning of the flowering period 5 plants were selected and marked in each unified meter for manual counting: 1 strong – 3 standard – 1 weak. For statistic purposes 1 plant represents for us one repetition.
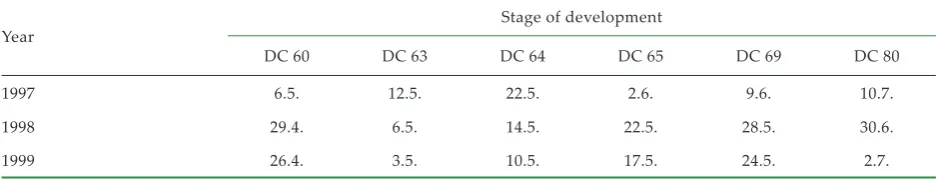
Generative organs were counted from the top raceme downwards in week intervals on marked plants starting by the period of yellow buds (Table 1): number of the living buds, living flowers and living pods. The counting finished in the time of green ripeness of pods, when the physiological fall of generative organs was terminated.
Five counted plants and another 5 of each repetition (totally 20) were manually harvested approximately one week before the combine har-vest. After the complete drying, we carried out the individual analysis of plants and the number of pods was determined. After the manual rub off of seeds we have determined the following characteristics: (1) TSW (thousand seeds weight), (2) oil content, (3) weight of harvested seeds from
individual racemes, (4) average number of seeds per plant, per area, per pod. Those characteristics are not shown, only Table 4 to be related to it.
Results of the experiment were evaluated with the help of statistic program Statgraphics Plus for Windows 4.0 of company Manugistic, Maryland, USA. It tests for significant interactions between the factors, given sufficient data.
RESULTS AND DISCUSSION
The primary racemes (including the terminal ra-cemes) show an increase in the number of generative organs in comparison to the 2nd date of counting (achieved maximal densities 60 and 110 plants/m2), respectively to the 3rd date of counting (achieved maximal densities 10, 40 and 80 plants/m2). The secondary racemes (densities 60, 80, 110 plants/m2) show an increase of the number until the 2nd date of counting (Tables 2 and 3).
The dynamics of increments of numbers of gen-erative organs in case of thin densities of plants (densities 10 and 40 plants/m2) is totally different due to the small or non-existent competition. The number of generative organs on plants of the thin-nest population has reached the maximum on the secondary racemes (Table 2) only in the 5th date of counting. This fact is from the agronomic point of view determined mainly by the lack of competi-tion, as a matter of fact, plants grew in the solitary way. There was no shadow casting on lower parts and sources of assimilates were not limited as in the case of the dense population, which enabled plants to create new generative organs. But those did not manage to ripe (see the index of the reduc-tion – 0.57 between the maximum and the harvest at the density 10 plants/m2). The population with the density 40 plants/m2 has reached the maximum number of generative organs on secondary racemes at the 4th date of counting.
[image:2.595.63.533.86.176.2]From the general point of view it came to a certain extent from the elimination of differences between primary and secondary racemes, i.e. densities 60, Table 1. Dates of counting in the individual years of experiments
Year Stage of development
DC 60 DC 63 DC 64 DC 65 DC 69 DC 80
1997 6.5. 12.5. 22.5. 2.6. 9.6. 10.7.
1998 29.4. 6.5. 14.5. 22.5. 28.5. 30.6.
1999 26.4. 3.5. 10.5. 17.5. 24.5. 2.7.
80 and 110 plants/m2 reach in average the maxi-mum in the 2nd date of counting (Tables 2 and 3), both mostly thin variants (10 and 40 plants/m2) in the 3rd date.
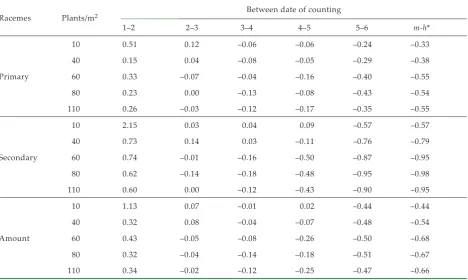
With the increasing density of population increases also the reduction of initiated genera-tive organs, both on the primary and secondary racemes (Tables 2 and 3). From the comparison of reductions in the period between the achieved maximum and the harvest (m-h) in case of all variants results in accordance to this trend up to the density of 60 plants/m2. They vary only in the extent of reduction on primary and secondary racemes. Reductions on secondary branches are almost twice as high. From the population density of 60 plants/m2 the extent of the reduction remains practically the same (± 1%).
Concerning the share on the reduction, genera-tive organs created in secondary racemes have the share on the entire decrease between the reaching of the maximum and the harvest (m-h) more than 60%, regardless of the density of the population. In the case of the thinnest populations the last
initiated flower organs simply do not ripe. There is no doubt, that the most early generative organs ripe to pods. We assume, that the reason for this nearly total reduction on secondary branches was mainly the stand density and the resulting com-petitive conditions: (1) architecture of individual plants, (2) plant cover, (3) shading. An important factor is obviously also the re-distribution of as-similates, when more developed generative organs are preferred in the period of insufficient nutrition. The distribution of assimilates in favour of earlier developed generative organs could be an answer to hormonal signals according to the hierarchy of developing organs (Rode 1988).
[image:3.595.63.532.402.748.2]In case of the thin populations (10 and 40 plans/m2), the highest reduction of generative organs were found determined in the period between the last date of counting, in the time of the intense growth of pods and the harvest (Tables 2 and 3). In the case of the remaining variants (60, 80 and 110 plants/m2) as a result of higher to high competition for as-similates between developing organs this process was initiated already in the fall. The most critical
Table 2. The total numbers of generative organs in the period of individual counting and significance of differences in the number of living generative organs (Scheffe, α = 0.05)
Racemes Plants/m2 Date of counting
1 2 3 4 5 6
Primary
10 302.5 456.3 510.8 479.3 450.3 340.7
40 247.0 285.1 297.3 272.7 260.0 185.7
60 257.9 342.7 317.8 305.9 255.9 153.3
80 219.8 269.3 270.2 235.7 217.5 123.4
110 184.3 232.1 225.3 197.1 162.8 105.3
Secondary
10 186.1 585.8 602.3 626.4 680.1 289.9
40 101.1 174.6 198.9 204.3 181.5 43.4
60 89.5 155.3 153.7 129.6 65.3 8.3
80 67.7 109.8 94.7 77.8 40.7 2.0
110 57.5 91.9 91.9 80.9 45.9 4.7
Amount
10 488.6 1 042.1 1 113.1 1 105.7 1 130.4 630.6
40 348.1 459.7 496.3 476.9 441.5 229.1
60 347.3 498.0 471.5 435.5 321.3 161.7
80 287.5 379.1 364.9 313.5 258.2 125.4
110 241.8 324.0 317.2 278.1 208.7 110.1
Amount
10 A A A A A A
40 ABC AB BC B B B
60 AB A B B B BC
80 BC AB BC B B BC
period from the point of view of losses of future pods commences by the fall, respectively by the beginning of pod growth, this in dependent on the density of population.
Nevertheless, in spite of this immense reduction, the share of secondary racemes on the yield on thin variants (10 and 40 plants/m2) is an important component of the yield. In the case of H10 it is al-most a share of 46% of secondary branches on the final yield of pods and in the case of 40 plants/m2 almost 19%.
Though it was harvested in more than 600 pods/ plant in the thinnest variant [Vašák et al. (1997) mentions the average number of harvested pods of 80–120 pieces per plant from the average popula-tion with the stand density ± 60 plants/m2]. The thin population is not able to compensate yield loss even by the increased number of pods. More im-portant is the number of pods per surface unit (m2), which is as follows (in brackets is given number of plants/m2): 6 306 pcs (10), 9 164 pcs (40), 9 702 pcs (60), 10 032 pcs (80) and 12 111 pcs (110).
Yield of grains was the highest on the variants with stand density 40 plants/m2 fertilized by 150 kg N/ha. In case of fertilizing with 150 kg N/ha, the low density of the population (10 plants/ m2) is not
compensated by the increase of generative organs on primary and secondary branches.
The final period of the living plant is not char-acterized by dynamic changes any more. We conclude from this, that in this period reductions of generative organs on all racemens are already terminated and the majority of pods, which we find on the plant, will ripe and more or less participate on the yield.
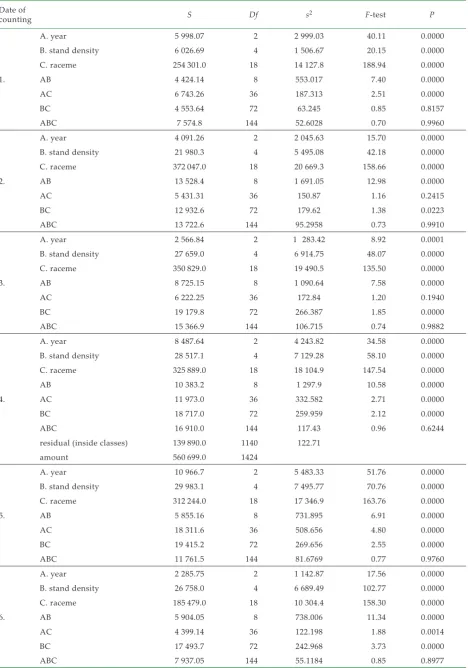
[image:4.595.65.534.97.377.2]Using the statistical evaluation by the analysis of mean squares by the method of Scheffe (95%) was determined a statistically significant influ-ence of the year, plants density and racemes on the number of generative organs on the significance level α = 0.05 (Table 5).
Table 4. Calculated yield for variants of stand density
Plants/m2 t/ha % on the check
10 7.83 80.1
40 10.34 105.7
60-check 9.78 100.0
80 8.32 85.1
[image:4.595.305.532.671.760.2]110 9.38 95.9
Table 3. Indexes of reduction in the period between individual counting, as well as the index of the entire reduction (m-h) be-tween the achieved maximum and the harvest; average values 1997–1999
Racemes Plants/m2 Between date of counting
1–2 2–3 3–4 4–5 5–6 m-h*
Primary
10 0.51 0.12 –0.06 –0.06 –0.24 –0.33
40 0.15 0.04 –0.08 –0.05 –0.29 –0.38
60 0.33 –0.07 –0.04 –0.16 –0.40 –0.55
80 0.23 0.00 –0.13 –0.08 –0.43 –0.54
110 0.26 –0.03 –0.12 –0.17 –0.35 –0.55
Secondary
10 2.15 0.03 0.04 0.09 –0.57 –0.57
40 0.73 0.14 0.03 –0.11 –0.76 –0.79
60 0.74 –0.01 –0.16 –0.50 –0.87 –0.95
80 0.62 –0.14 –0.18 –0.48 –0.95 –0.98
110 0.60 0.00 –0.12 –0.43 –0.90 –0.95
Amount
10 1.13 0.07 –0.01 0.02 –0.44 –0.44
40 0.32 0.08 –0.04 –0.07 –0.48 –0.54
60 0.43 –0.05 –0.08 –0.26 –0.50 –0.68
80 0.32 –0.04 –0.14 –0.18 –0.51 –0.67
110 0.34 –0.02 –0.12 –0.25 –0.47 –0.66
In case of negative values: index of reduction between particular dates of counting
Table 5. ANOVA for generative organs on primary and secondary racemes, five stand densities (10, 40, 60, 80 and 110 plants/m2),
based on three factors: year (A), stand density (B) and racemes (C); method 95% Scheffe
Date of
counting S Df s2 F-test P
1.
A. year 5 998.07 2 2 999.03 40.11 0.0000
B. stand density 6 026.69 4 1 506.67 20.15 0.0000
C. raceme 254 301.0 18 14 127.8 188.94 0.0000
AB 4 424.14 8 553.017 7.40 0.0000
AC 6 743.26 36 187.313 2.51 0.0000
BC 4 553.64 72 63.245 0.85 0.8157
ABC 7 574.8 144 52.6028 0.70 0.9960
2.
A. year 4 091.26 2 2 045.63 15.70 0.0000
B. stand density 21 980.3 4 5 495.08 42.18 0.0000
C. raceme 372 047.0 18 20 669.3 158.66 0.0000
AB 13 528.4 8 1 691.05 12.98 0.0000
AC 5 431.31 36 150.87 1.16 0.2415
BC 12 932.6 72 179.62 1.38 0.0223
ABC 13 722.6 144 95.2958 0.73 0.9910
3.
A. year 2 566.84 2 1 283.42 8.92 0.0001
B. stand density 27 659.0 4 6 914.75 48.07 0.0000
C. raceme 350 829.0 18 19 490.5 135.50 0.0000
AB 8 725.15 8 1 090.64 7.58 0.0000
AC 6 222.25 36 172.84 1.20 0.1940
BC 19 179.8 72 266.387 1.85 0.0000
ABC 15 366.9 144 106.715 0.74 0.9882
4.
A. year 8 487.64 2 4 243.82 34.58 0.0000
B. stand density 28 517.1 4 7 129.28 58.10 0.0000
C. raceme 325 889.0 18 18 104.9 147.54 0.0000
AB 10 383.2 8 1 297.9 10.58 0.0000
AC 11 973.0 36 332.582 2.71 0.0000
BC 18 717.0 72 259.959 2.12 0.0000
ABC 16 910.0 144 117.43 0.96 0.6244
residual (inside classes) 139 890.0 1140 122.71
amount 560 699.0 1424
5.
A. year 10 966.7 2 5 483.33 51.76 0.0000
B. stand density 29 983.1 4 7 495.77 70.76 0.0000
C. raceme 312 244.0 18 17 346.9 163.76 0.0000
AB 5 855.16 8 731.895 6.91 0.0000
AC 18 311.6 36 508.656 4.80 0.0000
BC 19 415.2 72 269.656 2.55 0.0000
ABC 11 761.5 144 81.6769 0.77 0.9760
6.
A. year 2 285.75 2 1 142.87 17.56 0.0000
B. stand density 26 758.0 4 6 689.49 102.77 0.0000
C. raceme 185 479.0 18 10 304.4 158.30 0.0000
AB 5 904.05 8 738.006 11.34 0.0000
AC 4 399.14 36 122.198 1.88 0.0014
BC 17 493.7 72 242.968 3.73 0.0000
REFERENCES
Bilsborow P.E., Norton G. (1984): A consideration of factors affecting the yield of oilseed rape. Asp. Appl. Biol., 6: 91–99.
Daniels R.W., Scarisbrick D.H. (1983): Oilseed rape physiology. Nat. Agr. Centre Course Pap.: 29–46. De Bouille P., Sotta B., Miginiac E., Merrien A. (1988):
Hormones et développement reproducteur chez le colza Brassica napus L., variété Oleifera Metzg, cultivar Bienvenu, Cetiom S.I.T. (103): 91–103.
Keiller D.R., Morgan G.G. (1988): Effect of pod removal and plant growth regulators on the growth, develop-ment and carbon assimilate distribution in oilseed rape (Brassica napus L.). J. Agr. Sci. Cambridge: 357–362. McGregor D.I. (1981): Patterns of flower and pod
devel-opment in rapeseed. Can. J. Plant Sci., 59: 819–830. Mendham N.J., Shipway P.A., Scott R.K. (1981): The
effects of dellayed sowing and weather on growth, development and yield of winter oil-seed rape (Brassica napus). J. Agr. Sci. Cambridge, 96: 389–416.
Mendham N.J., Scott R.K. (1975): The limiting effect of plant size at inflorescence initiation on subsequent qrowth and yield of oilseed rape (Brassica napus). J. Agr. Sci. Cambridge, 84: 487–502.
Rode J.C. (1988): Etude de quelques aspects de la croissance du colza de printemps en relation avec le déplacement des assimilats. Cetiom S.I.T., (103): 78–90.
Švachula V. et al. (1992): Pokusná a demonstrační pracoviště AF VŠZ Praha.
Tayo T.O., Morgan D.G. (1979): Factors influencing flower and pod development in oilseed rape (Brassica napus L.). J. Agr. Sci. Cambridge, 92: 363–373. Tittonel E.D. (1991): Reflexion sur l’élaboration du
rende-ment du colza. Texte de la présentation orale. Vašák J. et al. (2000): Řepka. Souhrnná pěstitelská
tech-nologie řepky. Agrospoj, Praha.
Vašák J., Fábry A., Zukalová H., Morbacher J., Baranyk P. et al. (1997): Systém výroby řepky. Česká pěstitelská technologie ozimé řepky pro roky 1997–1999. Svaz pěstitelů a zpracovatelů olejnin, Praha.
Received on September 25, 2003
ABSTRAKT
Vliv hustoty porostu ozimé řepky na tvorbu generativních orgánů
V letech 1996–1999 jsme experimentálně ověřovali vliv hustoty porostu na dynamiku tvorby a redukce generativních orgánů ozimé řepky (Brassica napus var. napus L.). Práce byly realizovány na pokusných pozemcích Výzkumné stanice Agronomické fakulty ČZU v Červeném Újezdě, okres Praha-západ. Vyhodnocení výsledků studia hustoty porostu potvrzuje, že z technologického hlediska je vhodnější volit řidší porosty řepky. Počínaje hustotou 60 rostlin/m2
nepozorujeme významné rozdíly mezi rostlinami v průběhu generativního období v počtu větví ani vytvořených generativních orgánů. U této hustoty (60 rostlin/m2) nastupuje významná redukce generativních orgánů, hlavně na
vedlejších větvích. Rozdíly v četnosti plodných větví jsou v případě hustších porostů zjistitelné pouze při sklizni. Z hlediska výnosu je mnohem výhodnější podpořit agrotechnickými zásahy tvorbu generativních orgánů na hlavních (primárních) květenstvích.
Klíčová slova: ozimá řepka; generativní orgány; tvorba; redukce; hustota porostu
Corresponding author: