Analysis of Quality Labels Included
in the European Union Quality Schemes
Šárka VelčoVská and Tomáš sadílek
department of Marketing and Business, Faculty of economics, Technical University of ostrava, ostrava, Czech Republic
Abstract
Velčovská Š., Sadílek T. (2014): Analysis of quality labels included in the European Union quality schemes. Czech J. Food Sci., 32: 194–203.
We analysed the use of European Union schemes of Protected Designation of Origin, Protected Geographical In-dication and Traditional Speciality Guaranteed labels in the European Union market according to selected criteria including type of label, country of origin, and product classes. The first part of the paper deals with the definition of food quality, quality labels, and European Union quality scheme specification. The second part includes the discus-sion of marketing research results. Secondary data from the Database of Origin and Registration are used. The sample consists of 1146 labels registered in this database as to the 28th of March 2013. The frequency of label utilisation is analysed according to country, type of label, and product classes, while the cluster analysis is also applied. Pearson’s chi-squared test of independence is used to determine if significant differences exist between the frequency of using the labels and the above-mentioned criteria.
Keywords: cluster analysis; DOOR database; food quality labels; Protected Designation of Origin; Protected Geographical Indication; Traditional Speciality Guaranteed
The paper is focused on the specific problem area of so-called quality labels and presents results of marketing research focused on the analysis of us-ing selected quality labels in the European Union (EU) agricultural and food products market. The production of food and agricultural products is an important part of the European Union economy. European food and beverages play a major role in the cultural identity of European citizens and regions. High quality of European food is a key advantage for European agriculture (Grunert 2005). Many food and agricultural products exhibit special character-istics linked to their geographical area, traditional composition or traditional production method.
An integral part of the EU agricultural policy is an effort to improve food quality and safety. Also consumers in the EU countries show a growing in-terest in quality as well as in traditional products. This generates a demand for food and agricultural
products with identifiable specific characteristics, in particular those linked to their geographical origin. Producers offering products with the value-adding attributes should communicate them in the market and highlight the characteristics of their products to consumers. Agricultural product quality policy should therefore provide producers with the right tools to better identify and promote such products and protect them against unfair practices (European Parliament and Council of the European Union 2012). Protection of original and traditional food from the EU is not only an important factor in preserving cultural and national traditions in the EU member states but also an important dimension of marketing for producers, taking into consideration consumers’ interest and confidence (Nagyová et al. 2011).
In order to allow producers to use the added value of their products as effectively as possible and to facilitate consumers’ choice of food products, in
1992 the EU established a quality labelling system known as Protected Designation of Origin (PDO), Protected Geographical Indication (PGI), and Tra-ditional Speciality Guaranteed (TSG) to protect the names of these products (European Commission 2012a; EUFIC 2013). The three schemes have been built on a long history of regional and traditional specialities, especially in southern European countries (Teuber 2010). The image of the region of origin and the specific product characteristics create a unique identity for food products bringing the added value in this way (van Ittersum et al. 2003). The PDO, PGI and TSG labels aim to provide consumers with clear information on the product origin or speciality character, enabling them to make more informed purchases and the best possible choices (Verbeke
et al. 2012).
In the context of the topic, the terms “food quality” and “quality labels” are explained, followed by the specification of surveyed labels PDO, PGI and TSG.
Food quality might be defined differently since it is a term defined by consumers, producers, distributors, certification institutions or any other subjects based on subjective and objective measurements of the product. Food quality definition also differs between countries and cultures and it is difficult to define this term on an international level (United Nations 2007). Generally, food quality can be explained as the degree to which a set of product characteristics meets consumer requirements, including safety re-quirements, sanitary rere-quirements, conformity to commodity standards, nutritional requirements, and sensory requirements.
Quality label is a term for a symbol that can be put on a product or its packaging indicating that the prod-uct or the process to make the prodprod-uct complies with given standards and that this compliance has been certified (Velčovská & Marhounová 2005; United Nations 2007). Quality labels guarantee compliance not only with current standards, but also with additional quality criteria determined in a corresponding certi-fication system. Quality labels give the added value to products and are usually used in communication with end consumers (The European Committee for the Valve Industry 2007). According to Grunert (2005), quality labels are an ambiguous category that covers many different things. They can be divided into obliga-tory (determined by legal rules and compulsory for all products in a given product category) and voluntary labels (bring a competitive advantage for a product), into general (address all product quality characteristics) and specific labels (focused only on particular quality
characteristics), or into regional, national, interna-tional and global labels. They can cover quality, safety, organic origin and other characteristics of the product (Grunert 2005; Velčovská & Marhounová 2005; Velčovská 2012).
Food quality labels are designed to promote and protect food products and should be a guarantee of quality products, their geographical origin, spe-cific characteristics and/or production methods (Velčovská & Marhounová 2005). They give the legal protection of a product against imitation throughout the market and eliminate the misleading of consumers by non-genuine products which may be of inferior quality; they help producers obtain a premium price for their authentic products, and finally they should provide clearer information to consumers about product characteristics and facili-tate the identification of food products with certified quality (O’Connor & Company 2005).
The following text is focused on the EU quality labelling scheme that identifies agricultural products and foodstuffs farmed and produced according to exacting specifications. As it was mentioned above, it includes Protected Designation of Origin (PDO) and Protected Geographical Indication (PGI) for agricultural products and foodstuffs as well as for wine and spirits (there are different rules for wine and spirits and they are not included in our analysis), and Traditional Speciality Guaranteed (TSG) for agricultural products and foodstuffs. While PDO covers agricultural products and foodstuffs which are produced, processed and prepared in a given geographical area using recognised know-how, PGI indicates a link with the geographical area at least in one of the stages of production, processing or preparation. For PDO food products, management conditions are regulated by very strict rules with the aim of obtaining a high quality process (Espejal et al. 2008), the link with the area is stronger; PGI is a more flexible regulation. TSG highlights the tradi-tional character of a product, either in the composi-tion or method of produccomposi-tion. According to the new Regulation on EU quality schemes for agricultural products and foodstuffs that entered into force at the beginning of 2013, in order to be “traditional” proven usage on the market during at least 30 years (instead of 25) is now required (European Commis-sion 2012a,b,c).
and foodstuffs [replacing Council Regulation (EC) No. 509/2006 on agricultural products and foodstuffs as traditional specialities guaranteed and Council Regulation (EC) No. 510/2006 on the protection of geographical indications and designations of origin for agricultural products and foodstuffs], Commission Regulation (EC) No. 1898/2006 of 14 December 2006 laying down detailed rules for the implementation of Council Regulation (EC) No. 510/2006 on the pro-tection of geographical indications and designations of origin for agricultural products and foodstuffs, and Commission Regulation (EC) No. 1216/2007 of 18 October 2007 laying down detailed rules for the implementation of Council Regulation (EC) No. 509/2006 on agricultural products and foodstuffs as traditional specialities guaranteed (Czech Agriculture and Food Inspection Authority 2013).
Regulation (EU) No. 1151/2012 establishes quality schemes which provide the basis for the identification and protection of names that indicate food and agri-cultural products with value-adding characteristics as a result of the farming or processing methods used in their production, or of the place of their produc-tion or marketing. The EU framework that protects designations of origin and geographical indications ensures a fair competition between the producers and enhances the credibility of the products in the consumers’ eyes (European Parliament and Council of the European Union 2012).
MATERIAL AND METHODS
The main purpose of marketing research was to analyse the use of PDO, PGI and TSG labels regis-tered in DOOR database for agricultural products and foodstuffs in the EU market. The DOOR data-base includes a list of product names (agricultural products and foodstuffs) registered as PDO, PGI or TSG as well as the names for the registration of which it has been applied. PDO and PGI cover also wine and spirits, however there are different rules for those products [in particular Regulation (EC) No. 1234/2007 for wines, Regulation (EEC) No. 1601/91 for aromatised wine products, and Regulation (EC) No. 110/2008 for spirits] and they are not included in DOOR database as well as other products out of Regulation No. 1151/2012 (European Commis-sion 2013c). Geographical indications protected in the European Community for wines originating in member States and third countries are registered in E-BACCHUS database, geographical indications for spirits are listed in E-SPIRIT-DRINKS database.
The DOOR database user can scan a list of product names registered as PDO, PGI or TSG (generally or in a selected country), and it is possible to sort the product names also according to product classes. However, the user can always see just a list of prod-ucts. The database does not offer summarized data and their comparison. Research studies dealing with the topic are focused only on partial aspects of PDO, PGI and/or TSG labels like analysis of food products registered as PDO, PGI and TSG in selected coun-tries (Becker & Staus 2008; Nagyová et al. 2011), analysis of customer loyalty and buying intention for PDO label (Fandos & Flavián 2006), consumer awareness and perception of labels (Velčovská et al. 2012; Verbeke et al. 2012), consumer behaviour (Espejal et al. 2007), customer satisfaction (Espejal
et al. 2008), or impact of labels on customer loyalty (Chrysochou et al. 2012). There is no comprehensive research study of PDO, PGI and TSG label utilisation, based on secondary data from the DOOR database, therefore the analysis presented in the paper was done. We set country of origin, type of label and product class as the criteria of analysis. Specific research purposes were as follows:
– to identify the frequency of PDO, PGI and TSG label utilisation,
– to compare the use of labels according to the EU countries,
– to compare the use of labels according to product classes,
– to compare the use of labels in selected EU coun-tries according to product classes.
The secondary data from the Database of Origin and Registration (DOOR) were used.
group (cluster), and conversely, so that the units of individual clusters differ as much as possible. The particular steps of cluster analysis differ depending on how the “closeness” or “distance” of the units is perceived within the groups, also depending on whether the set of units is gradually divided, sepa-rated or conversely composed, connected accord-ing to selected criteria (Everitt 2011). There are three main types of clustering methods: hierarchi-cal, parallel and sequential. Hierarchical clustering is a sequence of absorbed decompositions, which on the one hand starts with trivial decomposition, where each object of a given set of objects creates a separate single-element category cluster, and on the other hand the trivial decomposition ends with one cluster containing all objects (Hendl 2009). A hierarchical algorithm yields a dendrogram represent-ing the nested grouprepresent-ing of patterns and similarity levels at which grouping changes. The dendrogram can be broken at different levels to yield different clustering of data (Abonyi & Feil 2007).
RESULTS AND DISCUSSION
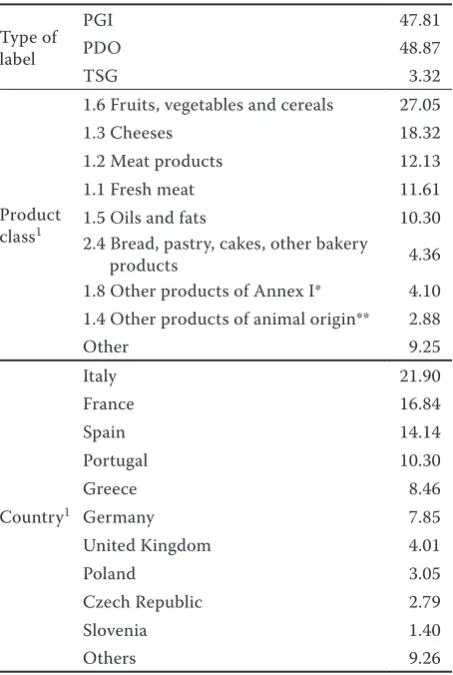
Research outcomes correspond with the date of 28th March 2013, when 1146 product items certified with PGI, PDO or TSG label were registered in the DOOR database. The sample structure is presented in Table 1.
As we can see in Table 1, PDO label has the highest share, followed by PGI label. The number of regis-tered PGI (548, i.e. 47.81%) and PDO labels (560, i.e. 48.87%) is relatively balanced, with the slight predominance of PDO. Only a minimum number of product names were registered as TSG (38, i.e. 3.32%). Based on product classes, the majority of the labels were awarded to fruits, vegetables and cereals. The most frequently certified products come from Italy (251 registered product names as PGI, PDO and TSG, i.e. 21.90% of all registered product names).
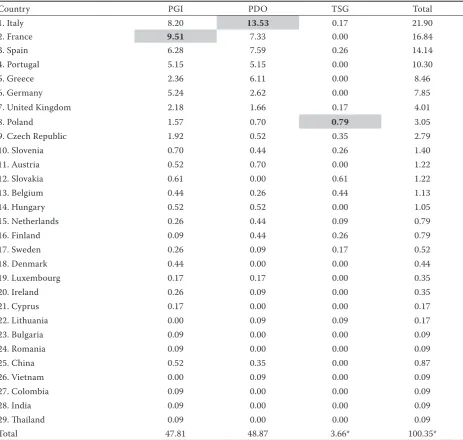
Frequency of PGI, PDO and TSG labels according to country. This part of analysis is based on the list of all countries and product names registered in the DOOR database. The ranking of all countries accord-ing to the total number of registered product names such as PGI, PDO and TSG was created (Table 2). Fields with the highest number of registered product names under PGI, PDO and TSG are highlighted in grey colour.
As it is evident from Table 2, 24 out of the 27 EU member countries have registered their product names as PGI, PDO or TSG in the DOOR database.
Malta, Latvia and Estonia have not used this type of protection yet. The first six countries of the ranking in Table 2 (i.e. 22% of all EU countries) have obtained PDO, PGI and TSG labels for 80% of product names registered in the DOOR database (interestingly, the Pareto rule is shown here). The first three countries in the ranking, Italy, France and Spain, have more than 50% of all registered product names. Italy has registered the highest number of product names as PDO; France is the first in the number of PGI labels. It is interesting that the majority of TSG labels be-long to countries at weaker positions in the overall ranking, i.e. to Poland, Slovakia, Belgium and the Czech Republic.
In order to discover reciprocal dependences of the studied characters, we performed the chi-square test at a significance level of α = 0.05, when sig F= 0, and we can confirm that variables depend reciprocally. Thereby, we accept the hypothesis about the high-Table 1. Sample characteristics (n = 1146, in %)
Type of label
PGI 47.81
PDO 48.87
TSG 3.32
Product class1
1.6 Fruits, vegetables and cereals 27.05
1.3 Cheeses 18.32
1.2 Meat products 12.13
1.1 Fresh meat 11.61
1.5 Oils and fats 10.30 2.4 Bread, pastry, cakes, other bakery
products 4.36
1.8 Other products of Annex I* 4.10 1.4 Other products of animal origin** 2.88
Other 9.25
Country1
Italy 21.90
France 16.84
Spain 14.14
Portugal 10.30
Greece 8.46
Germany 7.85
United Kingdom 4.01
Poland 3.05
Czech Republic 2.79
Slovenia 1.40
Others 9.26
[image:4.595.305.532.100.438.2]est distribution of labels in three Mediterranean countries, Italy, France and Spain. Reasons for this could be well-known gastronomic specialities as well as national cuisines of these countries which have a long history and are popular around the world. Overall, these countries have a higher impact on the global food market, compared with countries such as Luxembourg, Ireland and Lithuania, whose food products are not so popular in customers’ minds. Relations in the sample are described by Pearson’s contingency coefficient (0.514) and Cramer’s con-tingency coefficient (0.424), thus there is a weak
correlation between the number of product names registered in the database and the country of origin. These two contingency coefficients are the most basic measure of association between two nominal-level variables (Blaikie 2003).
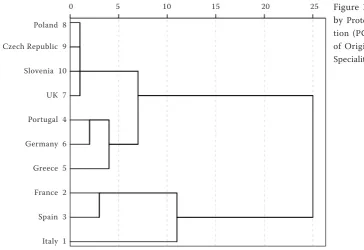
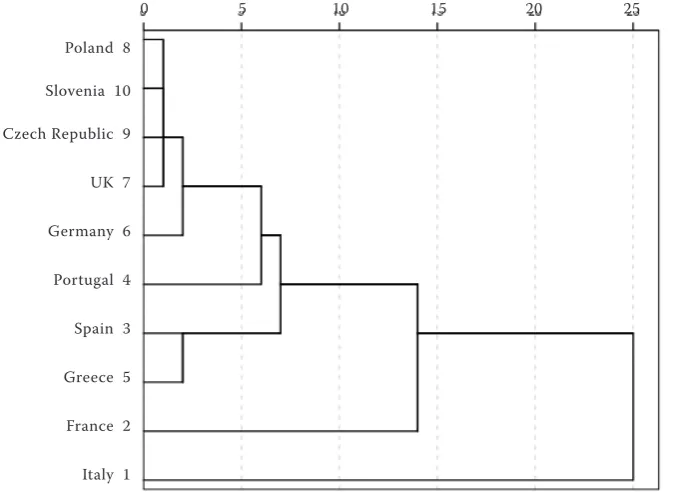
[image:5.595.66.530.101.541.2]Label distribution by countries is illustrated using also the cluster analysis and is represented graphically by a dendrogram (Figure 1). For better transparency of this dendrogram, only the first ten countries from ranking in Table 2 were included in cluster analysis. There are three clusters there. The first involves Mediterranean countries, Italy, France and Spain. Table 2. Numbers of product names registered as PGI, PDO and TSG according to countries (n = 1146, in %)
Country PGI PDO TSG Total
1. Italy 8.20 13.53 0.17 21.90
2. France 9.51 7.33 0.00 16.84
3. Spain 6.28 7.59 0.26 14.14
4. Portugal 5.15 5.15 0.00 10.30
5. Greece 2.36 6.11 0.00 8.46
6. Germany 5.24 2.62 0.00 7.85
7. United Kingdom 2.18 1.66 0.17 4.01
8. Poland 1.57 0.70 0.79 3.05
9. Czech Republic 1.92 0.52 0.35 2.79
10. Slovenia 0.70 0.44 0.26 1.40
11. Austria 0.52 0.70 0.00 1.22
12. Slovakia 0.61 0.00 0.61 1.22
13. Belgium 0.44 0.26 0.44 1.13
14. Hungary 0.52 0.52 0.00 1.05
15. Netherlands 0.26 0.44 0.09 0.79
16. Finland 0.09 0.44 0.26 0.79
17. Sweden 0.26 0.09 0.17 0.52
18. Denmark 0.44 0.00 0.00 0.44
19. Luxembourg 0.17 0.17 0.00 0.35
20. Ireland 0.26 0.09 0.00 0.35
21. Cyprus 0.17 0.00 0.00 0.17
22. Lithuania 0.00 0.09 0.09 0.17
23. Bulgaria 0.09 0.00 0.00 0.09
24. Romania 0.09 0.00 0.00 0.09
25. China 0.52 0.35 0.00 0.87
26. Vietnam 0.00 0.09 0.00 0.09
27. Colombia 0.09 0.00 0.00 0.09
28. India 0.09 0.00 0.00 0.09
29. Thailand 0.09 0.00 0.00 0.09
Total 47.81 48.87 3.66* 100.35*
Furthermore, Italy has its own cluster and category, because of the highest share of labels. The second cluster consists of Greece, Germany and Portugal and the third comprises the UK, Slovenia, Czech Republic, and Poland with a much lower share of labels, between 1.4 and 4.0% of the total.
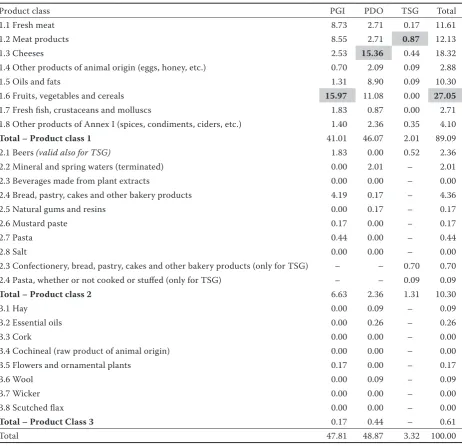
Frequency of PGI, PDO and TSG labels by product classes. To analyse the use of PGI, PDO and TSG labels according to product classes, the product classification specified in Council Regulation (EC) No. 510/2006 (for PGI and PDO) and Council Re-gulation (EC) No. 509/2006 (for TSG) was applied; this classification is also used in the DOOR database. Table 3 shows the number of product names (for all countries) registered as PDO, PGI and TSG in the particular product classes. Product classes with the highest number of registered product names under PGI, PDO and TSG are highlighted in grey colour. There are some differences in product classes speci-fied for PGI and PDO, and product classes defined for TSG. Crossed fields in the table mean that product classes are not relevant for PDO, PGI or TSG labels.
As it is presented in Table 3, a dominant product class for PGI label is the class Fruits, vegetables and cereals, followed by Fresh meat and Meat products. The highest number of PDOs is registered in the product class Cheeses, also in the class Fruits, vegetables and cereals and the class Oils and fats is frequent. TSG is the most typical in the product class Meat products and further in the product class Confectionery, bread, pastry, cakes, biscuits and other bakery products. If we
summarise the number of product names registered as PGI, PDO and TSG, the most common product class is Fruits, vegetables and cereals; it includes 27% of all registered product names.
Another view on the shares of product classes for PGI, PDO and TSG labels is shown in Figure 2. Under PGI label are mostly involved products from class 1 (86%) and class 2 (14%); PDO products come from class 1 in 94% of cases, only 5% of them are class 2 and less than 1% from class 3. 61% of products from class 1 and 39% of products from class 2 are registered as TSG; class 3 is not relevant for TSG.
[image:6.595.62.427.82.332.2]The χ2-test was performed to discover the depend-ence of characters at a significance level of α = 0.05,
Figure 1. Grouping EU countries by Protected Geographical Indica-tion (PGI), Protected DesignaIndica-tion of Origin (PDO), and Traditional Speciality Guaranteed (TSG) labels Poland 8
Czech Republic 9
Slovenia 10
UK 7
Portugal 4
Germany 6
Greece 5
France 2
Spain 3
Italy 1
0 5 10 15 20 25
0.36 0.89
13.87
4.82
39.47
85.77
94.29
60.53
0 10 20 30 40 50 60 70 80 90 100
PGI PDO TSG
Class 1
Class 2
Class 3 (%)
[image:6.595.315.523.543.729.2]sig F = 0 and we can confirm that there are depend-ences between the type of label and product classes where the label is used. It is seen in Figure 2 that the majority of PDO, PGI as well as TSG products come from class 1. TSG label differs only a little from the other labels because it does not include class 3. Pearson’s contingency coefficient is 0.604 and Cramer’s contingency coefficient is 0.563; there is a medium strong correlation between variables in the sample and asymmetric distribution of registered products was proved.
Comparison of selected EU countries according to numbers of product names registered in the particular product classes. In the last step of the
analysis, we compared the EU countries by numbers of product names registered in the particular product classes. We wanted to know which product class is the most typical in each country. Because of the too high number of items in the DOOR database, we have decided to focus only on countries which have registered more than 15 product names. These are the first ten countries mentioned in Table 2 which have registered 90% (1040) items as PGI, PDO and TSG (in March 2013).
[image:7.595.65.528.99.545.2]Table 4 shows the shares of the particular prod-uct classes in the total number of prodprod-uct names registered in the countries. Only product classes where the product names have been registered are Table 3. Numbers of product names registered as PGI, PDO and TSG according to product classes (n = 1146, in %)
Product class PGI PDO TSG Total
1.1 Fresh meat 8.73 2.71 0.17 11.61
1.2 Meat products 8.55 2.71 0.87 12.13
1.3 Cheeses 2.53 15.36 0.44 18.32
1.4 Other products of animal origin (eggs, honey, etc.) 0.70 2.09 0.09 2.88
1.5 Oils and fats 1.31 8.90 0.09 10.30
1.6 Fruits, vegetables and cereals 15.97 11.08 0.00 27.05
1.7 Fresh fish, crustaceans and molluscs 1.83 0.87 0.00 2.71 1.8 Other products of Annex I (spices, condiments, ciders, etc.) 1.40 2.36 0.35 4.10
Total – Product class 1 41.01 46.07 2.01 89.09
2.1 Beers (valid also for TsG) 1.83 0.00 0.52 2.36
2.2 Mineral and spring waters (terminated) 0.00 2.01 – 2.01
2.3 Beverages made from plant extracts 0.00 0.00 – 0.00
2.4 Bread, pastry, cakes and other bakery products 4.19 0.17 – 4.36
2.5 Natural gums and resins 0.00 0.17 – 0.17
2.6 Mustard paste 0.17 0.00 – 0.17
2.7 Pasta 0.44 0.00 – 0.44
2.8 Salt 0.00 0.00 – 0.00
2.3 Confectionery, bread, pastry, cakes and other bakery products (only for TSG) – – 0.70 0.70 2.4 Pasta, whether or not cooked or stuffed (only for TSG) – – 0.09 0.09
Total – Product class 2 6.63 2.36 1.31 10.30
3.1 Hay 0.00 0.09 – 0.09
3.2 Essential oils 0.00 0.26 – 0.26
3.3 Cork 0.00 0.00 – 0.00
3.4 Cochineal (raw product of animal origin) 0.00 0.00 – 0.00
3.5 Flowers and ornamental plants 0.17 0.00 – 0.17
3.6 Wool 0.00 0.09 – 0.09
3.7 Wicker 0.00 0.00 – 0.00
3.8 Scutched flax 0.00 0.00 – 0.00
Total – Product Class 3 0.17 0.44 – 0.61
Total 47.81 48.87 3.32 100.00
included in the table. The main product class (with the highest number of registered product names) for each country is highlighted in grey colour.
The most common product class is 1.6 (Fruits, vegetables and cereals), which is dominant in Italy,
[image:8.595.66.530.117.424.2]Spain, Greece and Poland. Portugal and Slovenia have the highest number of registered products in class 1.2 (Meat products), France in class 1.1 (Fresh meat), UK in class 1.3 (Cheeses). As we expected, the Czech Republic excels in class 2.1 (Beers). Germany
[image:8.595.63.401.512.759.2]Figure 3. Grouping EU countries by product classes
Table 4. Comparison of EU countries by the number of registered product names (such as PGI, PDO and TSG) in the particular products classes (the first ten countries, in %)
Product
class Italy France Spain Portugal Greece Germany UK Poland Republic SloveniaCzech 1.1 1.59 32.12 9.26 24.58 2.06 4.44 21.74 2.86 0.00 0.00 1.2 14.74 3.63 9.26 30.51 0,00 14.44 6.52 11.43 12.50 37.50
1.3 17.93 24.87 16.67 10.17 21.65 6.67 28.26 14.29 9.38 18.75
1.4 1.59 3.63 2.47 8.47 0.00 0.00 2.17 11.43 0.00 6.25
1.5 17.13 4.66 16.05 5.08 27.84 1.11 0.00 2.86 0.00 12.50 1.6 39.84 21.76 31.48 20.34 41.24 15.56 8.70 25.71 9.38 6.25
1.7 0.80 2.07 1.85 0.00 1.03 5.56 17.39 2.86 6.25 0.00
1.8 3.19 3.63 4.32 0.00 2.06 4.44 6.52 11.43 9.38 0.00
2.1 0.00 0.00 0.00 0.00 0.00 11.11 4.35 0.00 28.13 0.00
2.2 0.00 0.00 0.00 0.00 0.00 25.56 0.00 0.00 0.00 0.00
2.4 2.39 1.04 8.02 0.85 1.03 7.78 2.17 14.29 25.00 0.00
2.5 0.00 0.00 0.00 0.00 2.06 0.00 0.00 0.00 0.00 0.00
2.6 0.00 0.52 0.00 0.00 0.00 1.11 0.00 0.00 0.00 0.00
2.7 0.00 1.04 0.00 0.00 0.00 2.22 0.00 0.00 0.00 0.00
2.3 (TSG) 0.40 0.00 0.62 0.00 0.00 0.00 0.00 2.86 0.00 12.50 2.4 (TSG) 0.00 0.00 0.00 0.00 0.00 0.00 0.00 0.00 0.00 6.25
3.1 0.00 0.52 0.00 0.00 0.00 0.00 0.00 0.00 0.00 0.00
3.2 0.40 0.52 0.00 0.00 1.03 0.00 0.00 0.00 0.00 0.00
3.6 0.00 0.00 0.00 0.00 0.00 0.00 2.17 0.00 0.00 0.00
Total 100.00 100.00 100.00 100.00 100.00 100.00 100.00 100.00 100.00 100.00
Poland 8
Slovenia 10
Czech Republic 9
UK 7
Germany 6
Portugal 4
Spain 3
Greece 5
France 2
Italy 1
is the only country represented in class 2.2 (Mineral and spring waters) and at the same time this product class is dominant in Germany.
In order to discover a dependence between the country of origin and the most often registered prod-uct class, we performed the χ2-test at a significance level of α = 0.05, sig F = 0 and we confirmed cor-relations between these variables. In the next step, we measured the closeness of some variables using Pearson’s contingency coefficient. Its value is 0.707, which means a strong positive correlation between the country of origin and the most often registered product class, i.e. one important product class in which the majority of domestic products are regis-tered is specific of each country.
Results are also illustrated using the cluster analysis and are represented graphically by a dendrogram, see Figure 3. In this dendrogram, we can see two indi-vidual clusters of Italy and France with numbers of registered products different from others. The third cluster consists of the rest of the countries, but there are apparent distinctions between these countries, because Slovenia, Czech Republic, Poland, and UK have a much lower number of registered products than Germany or Greece. Spain and Portugal have a stable position with high amount of probability even though they are not concentrated in an individual cluster.
CONCLUSION
The present paper deals with the analysis of the European Union quality labelling scheme known as PDO, PGI and TSG used in the agricultural and food sector. Data comes from the DOOR database and statistical methods have been used for their processing. The main contribution of the paper is a comprehensive view on the topic, comparison of sum-marised data according to selected criteria including country of origin, type of label and product class, and statistical testing of the relations between the use of the labels and mentioned criteria. As results show, the highest number of product names is registered under PDO label followed by PGI label. There is only a minimum number of product names registered as TSG. A dominant country is Italy, followed by other Mediterranean countries like France, Spain, Portugal, and Greece. The reason for this could be a long his-tory of regional and traditional specialities in these countries and a higher importance of these products (such as olive oils, cheeses, vegetable products and others) in the global market. Based on the product
class, the most common classes are Fruits, vegetables and cereals (for PGI, PDO), Cheeses (PDO) and Meat products (TSG, PGI). In various countries different product classes dominate, but the most frequent are, in accordance with previous results, the classes Fruits, vegetables and cereals (Italy, Spain, Greece, and Poland) and Meat products (Portugal and Slovenia). Beer is the most typical product class in the Czech Republic. Statistical testing has confirmed a weak correlation between the number of product names registered as PDO, PGI and TSG and the country of origin, a medium strong correlation between the type of label and product classes where the label is used, and a strong correlation between the country of origin and the most often registered product class.
Original and traditional agricultural and food products can be perceived as an important part of tradition and image of the region. The PDO, PGI and TSG schemes bring benefits to consumers as well as to producers. Consumers are assured they are buying a genuine product with specific value-adding qualities. Produc-ers’ benefits lie in fair competition, protection, and promotion of their products. To take full advantage of these benefits, producers should communicate their products with the value-adding attributes and highlight the specific character of their products to consumers, enabling them to make more informed purchases and the best possible choices. The aim of the communication campaign should be to build awareness, credibility and favourable perceptions of the quality and distinctive-ness of PDO, PGI and TSG products, and to stimulate consumers’ interest in such products.
References
Abonyi J., Feil B. (2007): Cluster Analysis for Data Mining and System Identification. Birkhäuser, Boston.
Becker T.C., Staus A. (2008): European food quality pol-icy: the importance of geographical indications, organic certification and food quality insurance schemes in Euro-pean countries. In: International Congress ‘People, Food and Environments: Global Trends and European Strate-gies’. European Association of Agricultural Economists, August 26–28, 2008, Ghent: 1–15.
Blaikie N.W. (2003): Analyzing Quantitative Data: from Description to Explanation. SAGE Publications, London. Chrysochou P., Krystallis P., Giraud G. (2012):. Qual-ity assurance labels as drivers of customer loyalty in the case of traditional food products. Food Quality and Preference, 25:156–162.
cz/docDetail.aspx?nid =11314&docid=1002118&chnum=9 (accessed 2013-06-28).
Espejal J., Fandos C., Flavián C. (2008): Consumer sat-isfaction: A key factor of consumer loyalty and buying intention of a PDO food products. British Food Journal,
110: 865–881.
Espejal J., Fandos C., Flavián C. (2007): The role of intrinsic and extrinsic quality attributes on consumer behaviour for traditional food products. British Food Journal, 17: 681–701.
EUFIC (2013): Quality Logos in the European Union. [On-line] Available from: http://www.eufic.org/article/en/ artid/Quality-logos-in-the-European-Union/ (accessed 2013-03-14).
European Commission (2012a): Agricultural and rural development: Geographical indications and traditional specialities. [Online] European Union, 1995–2012. Avail-able at http://ec.europa.eu/agriculture/quality/schemes/ index_en.htm (accessed 2013-03-18).
European Commission (2012b): Agricultural and rural development: PDO, PGI, TSG logos. [Online] European Union, 1995–2012. Available at http://ec.europa.eu/ag-riculture/quality/schemes/logos/index_en.htm (accessed 2013-03-18).
European Commission (2013c): Agricultural and rural development: EU agricultural product quality policy. [Online] European Union, 1995–2012. Available at http:// ec.europa.eu/agriculture/quality/ (accessed 2013-03-18). European Commission (2013d): DOOR. [Online] European
Union, 1995–2012. Available at http://ec.europa.eu/ag-riculture/quality/door/list.html (accessed 2013-03-28). European Parliament and Council of the European Union
(2012): Regulation (EU) No 1151/2012 of the European Parliament and of the Council of 21 November 2012 on quality schemes for agricultural products and foodstuffs. Official Journal of the European Union, 55: 1–29. Everitt B. (2011): Cluster Analysis. Wiley, Chichester. Fandos C., Flavián C. (2006): Intrinsic and extrinsic
qual-ity attributes, loyalty and buying intention: an analysis for a PDO product. British Food Journal, 108: 646–662. Grunert K.G. (2005): Food quality and safety: consumer
perception and demand. European Review of Agricultural Economics, 32: 369–391.
Hendl J. (2009): Přehled statistických metod: analýza a metaanalýza dat. Portál, Praha.
Nagyová L., Horská E., Kádeková Z. (2011): Food quality policy and labelling. Delhi Business Review, 12: 85–100. O’Connor and Company (2005): Geographical indications and the challenges for ACP countries. [Online] Agritrade. Available at http://agritrade.cta.int/en/ content/view/ full/1794 (accessed 2013-04-09).
Teuber R. (2010): Geographical indications of origin as a tool of product differentiation: The case of coffee. Journal of International Food and Agribusiness Marketing, 22: 277–298.
The European Committee for the Valve Industry (2007): Standardisation guide for sanitary tapware. [Online] CEIR. Available at http://www.ceir-online.org/data/File/ Standardisation%20guide% 20for%20sanitary%20tap-ware.pdf (accessed 2012-01-28).
United Nations (2007): Safety and quality of fresh fruit and vegetables. A training manual for trainers. [On-line] United Nations, New York and Geneva. Available at http://www.unctad.org/en/docs/ditccom200616_en.pdf (accessed 2012-02-01).
van Ittersum K., Candel M.J.J.M., Meulenberg M.T.G. (2003): The influence of the image of a product’s region of origin on the product evaluation. Journal of Business Research, 56: 215–226.
Velčovská Š. (2012): Food quality labels and their per-ception by consumers in the Czech Republic. World Academy of Science, Engineering and Technology, 66: 154–160.
Velčovská Š., Janáčková H., Larsen F. (2012): Food quality labels; Insights from customers in two selected European countries. International Journal of Trade, Eco-nomics and Finance, 3: 52–58.
Velčovská Š., Marhounová M. (2005): Marketingové pojetí značky. VŠB-TU, Ostrava.
Verbeke W., Pieniak Z., Guerrero L., Hersleth M. (2012): Consumers’ awareness and attitudinal determi-nants of European Union quality label use on traditional foods. Bio-based and Applied Economics, 1: 213–229.
Received for publication April 17, 2013 Accepted after corrections July 8, 2013
Corresponding author: