Every classification equipment used to predict lean meat percentage in abattoirs in the EU must be approved according to Commission Regulation (EC) No. 3127/94. It stipulates various rules for the trial which needs to be carried out before the ap-proval. This also applies to the minimum accuracy of the equation developed for use in the classifica-tion equipment.
In most European countries slaughter pigs are brought to slaughterhouses at the age of six months, which means that their carcass weight is in the range of 75–90 kg and the average lean meat per-centage ranges from 55 to 60%. Their classifica-tion takes place in the framework of the SEUROP system, which provides for objective payments to pig producers as well as for a gradual increase in the lean meat proportion, which reflects the ori-entation of the breeding of meat type pigs and is regulated according to an EU scheme.
The scheme for grading by using objective meas-urements to estimate lean meat percentage was introduced in 1984. Leanness was calculated by means of full dissections, which was very expen-sive and this approach also introduced biases. To remove these distortions the EC decided to sim-plify the dissection by the definition of the lean meat percentage based on the dissection of 4 main cuts (Regulation (EC) No. 3127/94; Walstra and Merkus, 1995). As a consequence, all member states had to carry out a new dissection trial and assess new classification methods (Brondum et al., 1998; Busk et al., 1999; Scholz et al., 2002; Collewet et al., 2005).
Most of the classification methods use 2 or 3 pre-dictors: 1 or 2 fat depths and one muscle depth. One fat depth and the muscle depth are measured laterally to the midline, generally 6 cm off, in the rib area, in most cases at ¾ last ribs (LR). When a Supported by Eupigclass Brussels (Project G6RD-CT-1999-00127) and Ministry of Education, Youth and Sports of the Czech Republic (Project MSM No. 6046070901).
The accuracy of FOM instrument used in on-line pig
carcass classification in the Czech Republic
M. Šprysl, J. Čítek, R. Stupka, L. Vališ, M. Vítek
Department of Animal Science, Czech University of Life Sciences Prague, Czech Republic
ABSTRACT: The objective of this study was to document the accuracy of the classification equipment used in the Czech Republic with respect to measurement errors in lean meat percentage prediction such as point of measurement error, equipment error as well as operator error. To this end, a total of 720 pigs were measured in one abattoir. One can say from the results that the correlations between correct and surrogate measurements of fat depth are high (0.95–0.98), for muscle thickness they are lower ranging from 0.49 to 0.88, and for lean meat percentage they are in the range of 0.85–0.95. The lowest correlation (0.49) was calculated for muscle depth mea-surement between the 2nd and 3rd last rib when the place of measurement was moved 1 cm in the caudal direction, which influenced the level of the FOM correlation. It was further demonstrated that for the second insertion the differences in lean meat percentage prediction ranged from –6.07% to +9.29%. It was also demonstrated that various instruments provided identical measurements of fat depth (r = 0.57–0.97), while for muscle depth the performance was worse (r = 0.38–0.78), which caused a fluctuation in the prediction of lean meat percentage with differences ranging from –2.56% to +2.81%. It can also be concluded that a high agreement between operators was demonstrated for the determination of lean meat percentage (r = 0.71–0.80).
second fat depth is used, it is either at ¾ last lumbar vertebra (LV) 8 cm off the midline or at the LR 6 or 8 cm off the midline (Bruwe et al., 1991; Pulkrábek et al., 1992, 1994; Fortin, 2003).
For lean meat measurement most EU countries have used probes based on indirect measurements of back fat as well as loin eye area depth (reflect-ance, optical or ultrasound). It means that these values are determined indirectly. Unless the indi-rect measurement is related perfectly, the predicted values deviate from the true values because there are various measurement techniques which differ in resolution, profile analysis and quality of com-ponents and there is a lack of perfect correlation. Moreover, the use of different breed types and variation in production systems cause variation in carcass composition and conformation. This varia-tion must be taken into account when classificavaria-tion systems are implemented (Kien and Borzuta, 2002; Pulkrábek et al., 2004; Nissen et al., 2006).
However, the rules of Regulation (EC) No. 3127/94 do not mention anything about the test of reproduc-ibility and robustness of the types of classification equipment. Therefore, it is possible to carry out the test of classification equipment and to develop an equation on the basis of measurements from one piece of equipment and one operator. This means that the variation within copies of the same equip-ment is unknown, thus making the prediction of the maximum accuracy of equipment impossible due to different errors depending on the equipment used for the measurement of fat and muscle depth to predict lean meat percentage (Pulkrábek et al., 1998; Krška et al., 2002).
Invasive manual equipments penetrating the skin are influenced by the slaughter process and the operator. The slaughter process may also be influenced by differences between abattoirs as well as countries. If so, the penetration of the probe through the skin is different, which influences es-pecially the fat depth.
Errors can also occur because of differences be-tween copies of the same classification equipment. There are no rules for the testing and calibration of the equipment, which means that a variation between copies of the same type of equipment can exist. The reproducibility of measurements from the same type of equipment is unknown and must be determined (Engel and Walstra, 1991; Daumas et al., 1998; Olsen, 2003).
To document the accuracy of the classification equipment used in the Czech Republic it is
nec-essary to split the sources of error in lean meat percentage prediction to the following separate sources:
– point of measurement error (finding an adequate surrogate repeated measurement) or replication of measurement,
– equipment error (variation between copies of the same equipment, or the capacity of the instrument to measure fat depth and muscle depth correctly), – operator error (variation between operators).
MATERIAL AND METHODS
The sources of error (incorrect determination of lean meat percentage) tend to be as follows: 1. Incorrectly determined place of measurement. 2. Capacity of the instrument to measure fat depth
and muscle depth correctly. 3. Error of the operator (classifier).
In view of the sources of possible errors, the work has been divided into 3 parts.
Place of measurement
In order to determine the error from an incor-rectly determined place of measurement, the fol-lowing six classification insertions were done per animal:
2nd–3rd last rib 7 cm off the midline (right point),
2nd–3rd last rib 7 cm off the midline (repeat in the
same hole),
2nd–3rd last rib 1 cm cranial to the right point,
2nd–3rd last rib 1 cm caudal to the right point,
3rd–4th last rib 7 cm off the midline,
1st–2nd last rib 7 cm off the midline.
The measurement was done on 105 carcasses and
– insertion 2 should be identical with insertion 1, – insertions 3 and 4 were moved 1 cm off insertion 1 in the cranial and caudal direction, respectively, – insertions 5 and 6 were moved by 1 rib from
insertion 1 in the cranial and caudal direction, respectively.
Equipment error
– the instrument capacity to measure identical val-ues in a repeated insertion in the same carcass, – the capacity of various instruments of the same
type to measure identical values.
Instrument capacity to measure identical values in a repeated insertion in the same carcass – repeatability
Measurements were carried out in an abattoir under normal operating conditions on 357 slaugh-ter pigs. A single instrument was used to make 2 classification insertions in a single carcass. In order to remove potential effects of the classifier and the instrument, 3 classifiers and 2 instruments of the same type (FOM–SFK) were included in the test. Measurements were carried out according to the following scheme (Scheme 1).
Capacity of various instruments of the same type to measure identical values – reproducibility
Because it is expected that variation between in-dividual copies of the same type of equipment is small, but nobody knows its size, the objective of this experiment was to assess the variation between copies of the same type of equipment.
To this end, 360 carcasses were measured with three different copies of the same type of equip-ment by one operator according to the following scheme (Scheme 2).
Operator error
Operators influence the measurement different-ly because of different slaughter conditions, even
Scheme 2
Carcass No.
Operator
Σ equipment – F1 equipment – F2 equipment – F3
P1 P2 P1 P2 P1 P2
1–60 × × 60
61–120 × × 60
121–180 × × 60
181–240 × × 60
241–300 × × 60
301–360 × × 60
Σ 360
P1 – measuring position used for classification; P2 – repeated measuring position Scheme 1
Carcass No.
Equipment – F1 Equipment – F2
Σ operator 1 operator 2 operator 3 operator 1 operator 2 operator 3
P1 P2 P1 P2 P1 P2 P1 P2 P1 P2 P1 P2
1–60 × × 60
61–120 × × 60
121–180 × × 60
181–240 × × 60
241–300 × × 60
301–360 × × 60
Σ 360
though they have the same training. Therefore some differences between them exist. Because the biggest variation of measurements is expected to come from operators, the trial was carried out un-der industrial conditions.
The aim of the trial was to determine the repeat-ability of measurements with the same equipment with respect to the operator (differences between operators O1, O2 and O3).
The objective of this experiment was to assess the variation between operators. To this end, 720 pigs were used. Operator O3 and equipment 2 are nor-mally used in the abattoir. The measuring equip-ment (FOM) and the operators were alternated according to the following scheme (Scheme 3).
RESULTS AND DISCUSSION
Place of measurement
Results from the trial with the shifted place of measurement are summarised in Table 1.
Table 1 shows that the instrument measured the fat depth correctly in the second insertion (repeat-ed measurement). The average difference from the first insertion amounted to 0.26 mm and the corre-lation coefficient was 0.98. A higher measurement error was recorded for the muscle depth (average difference of 0.53 mm), but this had no effect on the
accuracy of the lean meat percentage estimate. For lean meat percentage, the average difference be-tween the second and the first insertion amounted to –0.12% with the correlation coefficient 0.95.
It follows from the results of the first and the second measurement that the instrument is capable of the correct measurement of fat depth and muscle depth. A small inaccuracy in the determination of muscle depth (which, however, had no large effect on the determination of lean meat percentage) can be explained by a possible distortion of the muscle caused by the first insertion.
In insertions 3 and 4, the place of measurement was moved by 1 cm in the cranial and caudal direc-tion, respectively. Compared with the measurement in the correct location, the differences in measured values are not high. For fat depth they amount to –0.30 mm and –0.02 mm, respectively, and for mus-cle depth to 0.17 mm and –0.19, mm respectively. This was further confirmed in the determination of lean meat percentage in carcasses. When the place of measurement was moved 1 cm in the cra-nial direction, the average difference from the first insertion amounted to 0.30% and when the place of measurement was moved 1 cm in the caudal direction, the average difference was negligible. As regards the correlations, they were high in this respect (0.92 and 0.85).
It is clear from the results that there is not a sig-nificant difference in the determined lean meat per-Scheme 3
Carcass No.
Equipment 1 Equipment 2
Σ operator 1 operator 2 operator 3 operator 1 operator 2 operator 3
P1 P2 P1 P2 P1 P2 P1 P2 P1 P2 P1 P2
1–60 × × 60
61–120 × × 60
121–180 × × 60
181–240 × × 60
241–300 × × 60
301–360 × × 60
361–420 × × 60
421–480 × × 60
481–540 × × 60
541–600 × × 60
601–660 × × 60
661–720 × × 60
Σ 720
Table 1. The effect of the place of measurement on the accuracy of the estimates of fat depth, muscle depth and lean meat percentage
Indicator n Uncorrected data Correct location – surrogate measurement
means sd diff sdd correlation Fat depth
Between 2nd and 3rd last rib 105 15.58 3.98
Between 2nd and 3rd last rib – repeat in the same hole 105 15.32 3.88 0.26 0.69 0.98 Between 2nd and 3rd last rib – 1 cm cranial 105 15.89 4.12 –0.30 0.75 0.98 Between 2nd and 3rd last rib – 1 cm caudal 105 15.60 3.89 –0.02 0.88 0.98 Between 3rd and 4th last rib 105 16.70 4.34 –1.11 1.01 0.97 Between 1st and 2nd last rib 105 14.64 3.63 0.94 0.96 0.97 Muscle depth
Between 2nd and 3rd last rib 105 61.84 8.83
Between 2nd and 3rd last rib – repeat in the same hole 105 61.30 8.84 0.53 4.39 0.88 Between 2nd and 3rd last rib – 1 cm cranial 105 61.67 8.57 0.17 6.50 0.72 Between 2nd and 3rd last rib – 1 cm caudal 105 62.03 9.07 –0.19 9.08 0.49 Between 3rd and 4th last rib 105 61.69 9.38 0.15 7.75 0.64 Between 1st and 2nd last rib 105 62.52 8.69 –0.69 6.43 0.73 Lean meat percentage
Between 2nd and 3rd last rib 105 55.79 3.99
Between 2nd and 3rd last rib – repeat in the same hole 105 55.91 3.72 –0.12 1.22 0.95 Between 2nd and 3rd last rib – 1 cm cranial 105 55.50 4.00 0.30 1.59 0.92 Between 2nd and 3rd last rib – 1 cm caudal 105 55.80 3.90 0.00 2.15 0.85 Between 3rd and 4th last rib 105 54.80 3.94 0.99 1.81 0.90 Between 1st and 2nd last rib 105 56.79 3.85 –1.00 1.51 0.93
centage in the carcass if the place of measurement is determined accurately between the 2nd and 3rd
last rib. A movement of the place of measurement between the 2nd and 3rd last rib by ±1 cm does not
play a role.
In insertions 5 and 6 the place of measurement was moved by 1 rib in the cranial and caudal direc-tion, respectively. In this case the differences in measured values compared with the correct place of measurement were higher. The lowest fat depth was determined in insertion 6 and the highest in insertion 5. It can be stated that in the examined area the fat depth is declining in the caudal direc-tion. Compared with the correct place of measure-ment, average differences in the measured fat depth amounted to +0.94 mm and –1.11 mm. A similar, but reverse trend was confirmed for the muscle depth which was increasing in the caudal direction from 61.69 mm to 62.52 mm. This had an effect on
the determined lean meat percentage which was growing with a more caudal place of measurement from 54.8% to 56.78%. This confirms that the place of insertion needs to be determined accurately.
When the place of measurement was moved by 1 vertebra in the caudal or cranial direction, the aver-age difference in the lean meat percentaver-age estimate, compared with the correct place of measurement, amounted to –1.00% and +0.99%, respectively. This corresponds with the findings of Čandek-Potokar (2003) and Font and Engel (2003).
Equipment error – repeatability
insertion the values identical with those obtained in the first insertion. Table 2 summarises the results of the measurement by the first and the second insertion regardless of the used instrument and operator.
The results show a good repeatability of the meas-ured values. The differences between the first and the repeated measurement were not significant. The second measurement determined lower fat and muscle depth. The average difference for fat depth amounted to 0.35 mm and for muscle depth to 0.20 mm. Slight differences were also found for the determined lean meat percentage, which was on average by 0.30% higher in the repeated measure-ment. The results suggest that the measurement of fat depth is more reliable (Čandek-Potokar, 2003). For the 357 examined animals, the difference be-tween the first and the repeated measurement ranged from –3 to +3 mm.
The results of the muscle depth determination were considerably worse, with the highest
differ-ence amounting to 38 mm. This relatively high dif-ference may be caused by distortion of the muscle after the first insertion. The instrument was not able to determine the muscle depth accurately in the repeated insertion. Logically, this in turn caused differences in the lean meat proportion determina-tion, with the differences between measurements ranging from –6.07% to +9.29%. It needs to be em-phasised that for the marketing of slaughter pigs, the classification needs to be done on the basis of the first insertion. In the event of unsuccess-ful measurement, it is better to move the second insertion by about 1 cm, however always between the 2nd and the 3rd thoracic vertebra.
Table 3 shows correlation coefficients between the first and the second insertion depending on the operator and the instrument used.
[image:6.595.65.532.102.248.2]The above table shows a high correlation between the first and the repeated fat measurement for all operators and both instruments (0.95–0.98), which corresponds with the results of Merks (2003) and Table 2. Differences in the FOM classification method regardless of the operator (1 equipment to 1 animal twice)
Variable n Minimum Maximum Mean Sd dev Sd error
Meat P1 (%) 357 45.00 70.40 55.88 4.72 0.25
Meat P2 (%) 357 43.90 70.50 56.19 4.76 0.25
DIF P1–P2 357 –6.07 9.29 –0.30 1.77 0.09
Fat depth P1 357 7 31 16.10 4.45 0.24
Fat depth P2 357 7 32 15.75 4.48 0.24
DIF P1–P2 357 –3 3 0.35 0.94 0.05
Muscle depth P1 357 37 90 64.29 9.09 0.48
Muscle depth P2 357 44 90 64.09 8.93 0.47
DIF P1–P2 357 –25 38 0.20 6.97 0.37
Table 3. Repeatability – correlations with respect to the operator
Operator Equipment Fat Muscle Meat (%)
O1 F1 correlation coeficient 0.98641 0.55047 0.90666
probability 0.00010 0.00010 0.00010
O1 F2 correlation coeficient 0.95026 0.65929 0.85007
probability 0.00010 0.00010 0.00010
O2 F1 correlation coeficient 0.95906 0.72660 0.90170
probability 0.00010 0.00010 0.00010
O2 F2 correlation coeficient 0.95318 0.19183 0.66885
probability 0.00010 0.15290 0.00010
O3 F1 correlation coeficient 0.97082 0.83246 0.91975
probability 0.00010 0.00010 0.00010
O3 F2 correlation coeficient 0.95730 0.77036 0.89549
[image:6.595.64.536.580.760.2]Table 4. Correlation coefficients with respect to the equipment – sequence
Equipment (sequence) Fat Muscle Meat (%)
F1 – F2 correlation coeficient 0.97422 0.70819 0.91888
probability 0.00010 0.00010 0.00010
F1 – F3 correlation coeficient 0.77082 0.40317 0.81297
probability 0.00010 0.00140 0.00010
F2 – F1 correlation coeficient 0.91552 0.52610 0.67575
probability 0.00010 0.00010 0.00010
F2 – F3 correlation coeficient 0.94384 0.76099 0.87615
probability 0.00010 0.00010 0.00010
F3 – F1 correlation coeficient 0.57444 0.38993 0.68847
probability 0.00010 0.00210 0.00010
F3 – F2 correlation coeficient 0.95239 0.77595 0.91123
probability 0.00010 0.00010 0.00010
Total correlation coeficient 0.83729 0.56160 0.70709
probability 0.00010 0.00010 0.00010
Table 5. Reproducibility – confirmativeness of differences with respect to the equipment (differences between measurements 1 and 2)
Equipment Mean Sd error T Prob > |T|
Fat depth
F1 – F2 2.25 0.14 16.087 0.0001
F1 – F3 –1.45 0.36 –4.036 0.0002
F2 – F1 2.03 0.26 7.683 0.0001
F2 – F3 0.32 0.13 2.453 0.0171
F3 – F1 –1.87 0.45 –4.165 0.0001
F3 – F2 0.21 0.15 1.427 0.1591
Muscle depth
F1 – F2 –4.600000 0.672377 –6.841400 0.0001
F1 – F3 6.566667 1.221365 5.376498 0.0001
F2 – F1 –5.750000 0.996782 –5.768570 0.0001
F2 – F3 1.583333 0.549418 2.881840 0.0055
F3 – F1 2.283333 1.123225 2.032838 0.0466
F3 – F2 –0.224140 0.534385 –0.419430 0.6765
Lean meat percentage
F1 – F2 –2.566670 0.178817 –14.353600 0.0001
F1 – F3 2.816328 0.375194 7.506319 0.0001
F2 – F1 –2.533330 0.452642 –5.596770 0.0001
F2 – F3 –0.024530 0.203983 –0.120230 0.9047
F3 – F1 2.115069 0.343112 6.164363 0.0001
F3 – F2 –0.240810 0.185150 –1.300620 0.1986
Čandek-Potokar (2003). Regarding the muscle depth, it is clear from the correlations that there is a problem with the muscle depth determination. In this respect, the correlation coefficient was only
[image:7.595.65.538.435.758.2]Equipment error – various copies of the same type of equipment (reproducibility)
Tables 4 and 5 show the results of the measure-ment of errors of various copies of the same type of equipment. Table 4 shows correlation coefficients between the determined fat depth, muscle depth and lean meat percentage.
The above table shows a trend confirmed in previ-ous tests. Variprevi-ous instruments measured the identical fat depth (r = 0.57 – 0.97) without greater problems while lower correlation coefficients were found for the muscle depth (0.38–0.78). Table 5 shows aver-age differences in the determination of fat depth, muscle depth and lean meat percentage between the first and the repeated measurement using various instruments of the same type (F1 – F2 – F3).
It can be seen that the lowest average differences were found for the fat depth, which corresponds with the results of Čandek-Potokar (2003). The greatest difference amounted to 2.25 mm and other differences were also statistically significant. Larger differences were found for the muscle depth, name-ly up to 6.56 mm. These differences in turn lead to different determinations of lean meat percentage. Depending on the instrument used, the differences ranged from –2.56% to +2.81%. It can also be seen that a significant difference was found for instance between instruments F1 and F2, while there was hardly any difference (statistically insignificant) be-tween instruments F2 and F3. It needs to be stated that the function of all instruments was verified by a calibration roller before the measurement.
Operator error
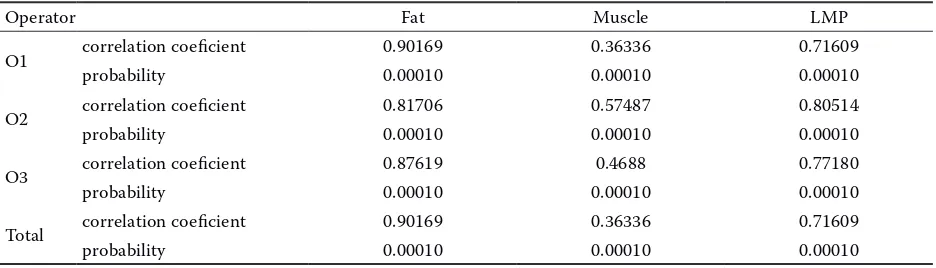
The results of the measurement of operator error are shown in Tables 6 and 7. Table 6 provides a
sum-mary of correlation coefficients for the results of measurement by a given operator and his controls (repeated measurements by the second and third operator). The results show a good agreement be-tween operators in the determination of fat depth, which is documented by the average correlation coefficient 0.90. The agreement between measure-ments was lower for the muscle depth, where corre-lation coefficients ranged from 0.36 to 0.57. For the lean meat proportion, the correlation coefficient between the first and the control measurement was in the range of 0.71–0.80.
Table 7 shows the absolute values of differences measured between the first and the control measure-ment for individual operators. The smallest differences in the measured fat depth were found for operator 2. For operators 1 and 3, statistically significant differ-ences between the first and the control measurement of fat depth were determined, but these differences were not very large, –0.36 and –1.26 mm. Slightly larger differences ranging from +3.51 to –3.66 mm were found for the measurements of muscle depth, and the situation was similar for lean meat percent-age, where average differences ranged from +1.59 to –0.43% depending on the operator. It can therefore be concluded that the operator may also have in part an effect on the classification of slaughter pigs (Čandek-Potokar, 2003; Oksama 2003).
CONCLUSION
[image:8.595.65.533.624.758.2]The results document that the correlations be-tween correct and surrogate measurements of fat depth are high (0.95–0.98), for muscle thickness they are lower ranging from 0.49 to 0.88, and for lean meat proportion they are in the range of 0.85 to 0.95. The lowest correlation (0.49) was calculated for the muscle depth measurement between the
Table 6. Correlation coefficients with respect to the operator
Operator Fat Muscle LMP
O1 correlation coeficient 0.90169 0.36336 0.71609
probability 0.00010 0.00010 0.00010
O2 correlation coeficient 0.81706 0.57487 0.80514
probability 0.00010 0.00010 0.00010
O3 correlation coeficient 0.87619 0.4688 0.77180
probability 0.00010 0.00010 0.00010
Total correlation coeficient 0.90169 0.36336 0.71609
2nd and 3rd last rib where the place of measurement
was moved 1 cm in the caudal direction, which influenced the level of the FOM correlation.
As for the equipment error (repeatability) or, in other words, the possibility of repeated insertion, it was demonstrated that in the second insertion the equipment is not capable of an accurate measure-ment of muscle depth. Differences in the predicted lean meat percentage may range from –6.07% to +9.29%. Therefore, it is necessary to carry out the classification on the basis of the first insertion. If the insertion needs to be repeated, it is better to move the place of insertion by about 1 cm in the cranial or caudal direction, but it is necessary to keep it always between the 2nd and the 3rd thoracic vertebra.
In relation to the measurement of errors of vari-ous instruments of the same type it can be stated that various instruments can provide the identical measurements of fat depth without greater prob-lems (r = 0.57–0.97). The performance is worse for muscle depth (0.38–0.78), which causes a fluctua-tion in the predicfluctua-tion of lean meat percentage with differences ranging from –2.56% to +2.81%. It can also be concluded that a high agreement between operators was proved in the measurement of fat depth (r = 0.90), while it was lower for muscle depth (r = 0.36–0.57) and the determination of lean meat percentage (r = 0.71–0.80).
REFERENCES
Brondum J., Egebo M., Agerskov C., Busk H. (1998): On-line carcass grading with the Autofom ultrasound system. J. Anim. Sci., 76, 1859–1868.
Bruwe G.G., Heinze P.H., Zondach I.B., Naude R.T. (1991): The development of a new classification system for pig carcasses in the RSA. Porcus, 6, 27–31. Busk H., Olsen E.V., Brondum J. (1999): Determination
of lean meat in pig carcasses with the Autofom clas-sification system. Meat Sci., 52, 307–314.
Collewet G., Bogner P., Allen P., Busk H., Dobrowolski A., Olsen E., Davanel A. (2005): Determination of the lean meat percentage of pig carcasses using magnetic resonance imaging. Meat Sci., 70, 563–572.
Čandek-Potokar M. (2003): The accuracy of on-line meth-ods. In: Eupigclass – Final workshop, Danish Meat Research Institute. Roskilde.
Daumas G., Causer D., Shodne T., Schollhammer E. (1998): Les méthodes de classement des carcasses de porc autorisées en France en 1997. J. Res. Porc. France, 30, 1–6.
Engel B., Walstra P. (1991): A simple method to increase precision or reduce expense in regression experiments to predict the proportion of lean meat of carcasses. Anim. Prod., 53, 353–359.
Font M., Engel B. (2003): Sampling in pig grading. In: Eupigclass – Final workshop, Danish Meat Research Institute. Roskilde.
Fortin A. (2003): Carcass grading: Recent results. In: Eu-pigclass – Final workshop, Danish Meat Research In-stitute. Roskilde.
Kien S., Borzuta K. (2002): Polish protocol for updating of pig carcass classification methods in 2002. Meat and Fat Research Institute Warsaw, Poznań. 6 pp.
[image:9.595.69.532.100.294.2]Krška P., Bahelka I., Demo P., Peškovičová D. (2002): Meat contents in pigs estimated by various methods and compared with objective lean meat content. Czech J. Anim. Sci., 47, 206–211.
Table 7. Confirmativeness of differences with respect to the operator (differences between measurements 1 and 2)
Operator Mean Sd error T Prob > |T|
Fat
O1 –1.264960 0.099665 –12.69210 0.0001
O2 0.029412 0.168989 0.174046 0.8620
O3 –0.360170 0.137752 –2.614630 0.0095
Meat
O1 1.897436 0.586327 3.236139 0.0014
O2 3.512605 0.501522 7.003895 0.0001
O3 –3.661020 0.531566 –6.887240 0.0001
Lean meat percentage
O1 1.597319 0.165743 9.637349 0.0001
O2 0.790826 0.170709 4.632599 0.0001
Merks P. (2003): Future trends in pig-production- how does classification fit into that? In: Eupigclass – Final workshop, Danish Meat Research Institute. Roskilde. Nissen P.M., Busk H., Oksama M., Seynaeve M., Gispert
M., Waltra P., Hansson I., Olsen E. (2006): The esti-mated accuracy of the EU reference dissection method for pig carcass classification. Meat Sci., 73, 22–28. Oksama M. (2003): The accuracy of on-line methods. In:
Eupigclass – Final workshop, Danish Meat Research Institute. Roskilde.
Olsen E.V. (2003): The accuracy of the reference for on-line measurements in pig carcass classification. In: Eupigclass – Final workshop, Danish Meat Research Institute. Roskilde.
Pulkrábek J., Wolf J. Adamec T., Fiedler J., Houška L., Jakubec V., Štefunka F. (1992): Determination of the lean meat share by FOM and ZP method on the strenght of detailed dissection in carcass pigs. ZZ, VÚŽV Prague-Uhříněves, 26 pp. (in Czech)
Pulkrábek J., Fiedler J., Smital J., Houška L., Adamec T. (1994): Tissue percentages in the side of pork of pig bruds raised in the Czech Republic. Živ. Výr., 39, 743– 751. (in Czech)
Pulkrábek J., Pavlík J., Smital J., Fiedler J., Houška L. (1998): Quantification of changes of the carcass at various slaughter weight. Sci. Agric. Bohem., 29, 119– 127.
Pulkrábek J., Wolf J., Vališ L., Vítek M., Höteth R. (2004): Verglech verschiedener Methoden zur Bestimung des Muskelfleischanteils im Schlachtkörper des Schweines. Züchtungskunde, 76, 6–17.
Scholz A., Soffner P., Littmann E., Peschke W., Förster M. (2002): Genauigkeit der Dualenenergie-Röntgen-absorptiometrie (DXA) zur Ermittlung der Slacht-körperzusammensetzung von Schweinehälften (kalt, 30–39 kg) anhand der EU-Referenzzrlegung. Züch-tungskunde, 74, 376–391.
Walstra P., Merkus G.S.M. (1995): Procedure for assess-ment of the lean meat percentage as a consequence of the new EU reference dissection method in pig carcass classification. DLO-Res. Institute Animal Science and Health Research Branch, Zeist, 22 pp.
Received: 2007–03–26 Accepted after corrections: 2007–04–10
Corresponding Author
Doc. Ing. Michal Šprysl, CSc., Department of Animal Science, Czech University of Life Sciences Prague, Kamýcká 129, 165 21 Prague 6-Suchdol, Czech Republic