warwick.ac.uk/lib-publications
A Thesis Submitted for the Degree of PhD at the University of Warwick
Permanent WRAP URL:
http://wrap.warwick.ac.uk/92537
Copyright and reuse:
This thesis is made available online and is protected by original copyright.
Please scroll down to view the document itself.
Please refer to the repository record for this item for information to help you to cite it.
Our policy information is available from the repository home page.
U N
IV
ER
SITAS WARWICEN SIS
Analytical Modelling for the Performance
Prediction and Optimisation of Near-Neighbour
Structured Grid Hydrodynamics
by
James Alfred Davis
A thesis submitted to The University of Warwick
in partial fulfilment of the requirements
for admission to the degree of
Doctor of Philosophy
Department of Computer Science
The University of Warwick
The advent of modern High Performance Computing (HPC) has facilitated the
use of powerful supercomputing machines that have become the backbone of
data analysis and simulation. With such a variety of software and hardware
available today, understanding how well such machines can perform is key for
both efficient use and future planning. With significant costs and multi-year
turn-around times, procurement of a new HPC architecture can be a significant
undertaking.
In this work, we introduce one such measure to capture the performance
of such machines – analytical performance models. These models provide a
mathematical representation of the behaviour of an application in the context
of how its various components perform for an architecture. By parameterising
its workload in such a way that the time taken to compute can be described
in relation to one or more benchmarkable statistics, this allows for a reuseable
representation of an application that can be applied to multiple architectures.
This work goes on to introduce one such benchmark of interest, Hydra.
Hy-dra is a benchmark 3D Eulerian structured mesh hydrocode implemented in
Fortran, with which the explosive compression of materials, shock waves, and
the behaviour of materials at the interface between components can be
inves-tigated. We assess its scaling behaviour and use this knowledge to construct a
performance model that accurately predicts the runtime to within 15% across
three separate machines, each with its own distinct characteristics. Further,
this work goes on to explore various optimisation techniques, some of which see
a marked speedup in the overall walltime of the application. Finally, another
software application of interest with similar behaviour patterns, PETSc, is
ex-amined to demonstrate how different applications can exhibit similar modellable
I owe a great appreciation of thanks to many people for their support, advice
and friendship during my time as a postgraduate student at the University of
Warwick.
Foremost, I would like to thank my research supervisor, Professor Stephen
Jarvis, whose insight and contributions proved invaluable and without whom
none of this would have been possible.
I would also like to acknowledge both past and present members of the High
Performance and Scientific Computing Group in the Department of Computer
Science at the University of Warwick, as well as other friends for their support
In particular, I would like to thank Steven Wright, Simon Hammond, Gihan
Mudalige, John Pennycook, Oliver Perks, Richard Bunt, Robert Bird, Peter
Coetzee, Faiz Sayid, Matthew Leeke, Adam Chester, Stephen Roberts, Timothy
Law, Andrew Mallinson, David Beckingsale and James Dickson. In addition,
thanks must be given to the administrative staff of the department, including
Dr Christine Leigh, Catherine Pillet, Dr Roger Packwood, Paul Williamson,
Richard Cunningham, Sharon Howard and the secretarial staff whose aid behind
the scenes has always provided invaluable.
Thanks must be given to those at the Atomic Weapons Establishment (AWE)
for their support in not only resources but also knowledge, including Andy
Herdman, Wayne Gaudin, Wadud Miah, Ash Vadgama, Dr Iain Miller and Dr
Satheese Maheswaran.
Further general thanks must also go to the institutions of the Centre for
Scientific Computing (CSC) at the University of Warwick, Lawrence Livermore
National Laboratory (LLNL), Edinburgh Parallel Computing Centre (EPCC),
STFC Daresbury and Nag Ltd for the access provided to HPC architectures
This thesis is submitted to the University of Warwick in support of my
appli-cation for the degree of Doctor of Philosophy. It has been composed by myself
and has not been submitted in any previous application for any degree. The
work presented (including data generated and data analysis) was carried out by
the author except in the cases below:
• The compilation of the Hydra benchmark and the collection of benchmark
execution data on the Hera and DawnDev architectures was performed by
Simon Hammond. Data processing and analysis was performed by the
author.
Parts of this thesis have been published by the author:
• Davis, J. and Mudalige, G. and Hammond, S. and Herdman, J. and Miller,
I. and Jarvis, S., Predictive Analysis of a Hydrodynamics Application
on Large-Scale CMP clusters, International Supercomputing Conference
(ISC11), Computer Science — Reseach and Development,
26(3–4):175-185, June 2011.
Other research works associated with the author but not used within this thesis
are:
• To upgrade or not to upgrade? Catamount vs Cray Linux Environment,
Hammond, S.D. and Mudalige, G.R. and Smith, J.A. and Davis, J.A. and
Jarvis, S.A. and Holt, J. and Miller, I. and Herdman J.A. and Vadgama,
A., Large Scale Parallel Processing Workshop 2010 (LSPP10) held in
The research presented in this thesis was made possible by the support of the
following benefactors and sources:
• The Engineering and Physical Sciences Research Council (EPSRC)
(2009-2012).
• Access to the Hydra Benchmark was provided by the United Kingdom
Atomic Weapons Establishment (AWE) under grants CDK0660 (The
Pro-duction of Predictive Models for Future Computing Requirements) and
CDK0724 (AWE Technical Outreach Program)
• Use of computing resources was provided by the Centre for Scientific
Re-search (CSC) at the University of Warwick under the Science ReRe-search
Investment Fund and Joint Research Equipment Initiative under grant
JR00WASTEQ.
• Further compute resources were provided by the Lawrence Livermore
Na-tional Laboratory (LLNL) which is supported by the Office of Science
of the United States Department of Energy (DoE), contract
DE-AC52-07NA27344.
• Finally, use of the HECToR computing resources is managed by the
AMG Algebraic Multi-Grid
API Application Program Interface
AVX Advanced Vector Instructions
AWE Atomic Weapons Establishment
BSP Bulk Synchronous Parallel
CAF Co-array Fortran
CFD Computational Fluid Dynamics
CMP Chip Multi-Processor
CPU Central Processing Unit
CG Conjugate Gradient
CRCW Concurrent Read, Concurrent Write
CREW Concurrent Read, Exclusive Write
CSC Center for Scientific Computing
CSR Compressed Sparse Row
CUDA Compute Unified Device Architecture
DMA Direct Memory Access
DPOP Double Precision Floating Point Operation
EPCC Edinburgh Parallel Computing Centre
FLOP Floating-Point Operation
FLOP/s Floating-Point Operations per Second
FPGA Field Programmable Gate Array
GPU Graphics Processing Unit
GPGPU General Purpose Graphics Processing Unit
HDL Hardware Description Language
HPC High Performance Computing
HYPRE Parallel High Performance Preconditioners
HPL High Performance LINPACK
IBM International Business Machines
ILP Instruction Level Parallelism
IMB Intel MPI Benchmark
I/O Input/Output
IPC Instructions Per Cycle
LANL Los Alamos National Laboratory
LLNL Lawrence Livermore National Laboratory
MIC Many Integrated Core
MIMD Multiple Instruction, Multiple Data
MISD Multiple Instruction, Single Data
ML MultiLevel Preconditioning Package
PCIe Peripheral Component Interconnect Express
PE Processing Element
PETSc Portable, Extensible Toolkit for Scientific Computing
PMPI MPI Profiling Interface
PMTM Performance and Modelling Timing Interface
PRACE Partnership for Advanced Computing in Europe
PRAM Parallel Random Access Machine
PPE Power Processing Element
PVM Parallel Virtual Machine
RAM Random Access Memory
RWM Read/Write/Modify
SIMD Single Instruction, Multiple Data
SISD Single Instruction, Single Data
SMP Shared Memory Parallelism
SoA Structure-of-Arrays
SPE Synergistic Processing Element
SPMD Single Program Multiple Data
SPOOLES Sparse Object Oriented Linear Equations Solver
SSE Streaming SIMD Extensions
UPC Unified Parallel C
Abstract ii
Acknowledgements iii
Declarations v
Sponsorship and Grants vi
Abbreviations vii
List of Figures xviii
List of Tables xxv
1 Introduction 1
1.1 Motivation . . . 3
1.2 Thesis Contributions . . . 9
1.3 Thesis Overview . . . 11
2 Performance Analysis, Modelling and Optimisation 14 2.1 Forms of Parallelism . . . 15
2.1.1 Flynn’s Taxonomy — Program Classification . . . 15
2.1.2 Single-Thread Parallelism . . . 17
2.1.3 Shared Memory Parallelism . . . 18
2.1.4 Distributed Memory Parallelism . . . 20
2.1.5 Accelerators . . . 22
2.1.6 High Performance Clusters . . . 24
2.2 Machine Cluster Architecture . . . 26
2.2.1 The Central Processing Unit . . . 27
2.3 Performance Analysis and Modelling . . . 34
2.3.1 Amdahl’s Law . . . 35
2.3.2 Gustafson’s Law . . . 36
2.3.3 Benchmarking . . . 37
2.3.4 Profiling . . . 40
2.3.5 PRAM Model . . . 43
2.3.6 The Bulk Synchronous Parallel Model . . . 45
2.3.7 LogP/LogGP . . . 46
2.3.8 Statistical and Analytical Modelling . . . 46
2.3.9 Simulation . . . 49
2.4 Summary . . . 50
3 Software and Hardware Overview 52 3.1 Libraries . . . 53
3.2 Benchmarks . . . 54
3.2.1 Network Interconnect Micro-Benchmarks . . . 54
3.2.2 Memory Micro-Benchmarks . . . 55
3.2.3 Macro-Benchmarks . . . 56
3.3 Machines . . . 58
3.3.1 Minerva — Warwick Commodity Cluster . . . 58
3.3.2 HECToR . . . 61
3.3.3 DawnDev . . . 64
3.3.4 Hera . . . 66
3.3.5 Intel X3430 workstation . . . 67
3.4 Summary . . . 68
4.2.2 Mixed Cells . . . 74
4.2.3 Memory Management . . . 75
4.2.4 Grid Kernels . . . 76
4.2.5 Stencil Kernels . . . 76
4.2.6 Update Boundary Kernels . . . 77
4.3 Parallel Behaviour . . . 78
4.3.1 Decomposition . . . 78
4.3.2 Point-to-Point Communications . . . 79
4.3.3 Collective Communications . . . 83
4.4 Function Breakdown . . . 84
4.5 Scaling Behaviour . . . 88
4.5.1 Serial Results . . . 89
4.5.2 Weak-Scaling Results . . . 92
4.5.3 Strong-Scaling . . . 100
4.5.4 Dynamic Central Processing Unit (CPU) Scaling . . . 104
4.6 Summary . . . 106
5 Modelling Hydra - A Performance Prediction Case Study 108 5.1 Input Parameters . . . 108
5.2 Iteration Model . . . 110
5.2.1 MDT . . . 112
5.2.2 Mlagh . . . 112
5.2.3 Madv . . . 113
5.2.4 Madvx . . . 114
5.2.5 Madvy . . . 114
5.2.6 Madvz . . . 114
5.2.7 Madvmx . . . 115
5.2.11 Lartvis . . . 116
5.2.12 Leosdrv . . . 116
5.3 Process and Cell Layout . . . 117
5.4 Compute - Work Per Unit (Wg) . . . 123
5.4.1 Grid Kernels . . . 124
5.4.2 Boundary Kernels . . . 126
5.5 Point-To-Point Communication . . . 126
5.5.1 Message Sizes . . . 126
5.5.2 Intra/Inter-Node Communication . . . 131
5.6 Collective Communication . . . 142
5.7 Model Validation . . . 142
5.7.1 DawnDev/Hera . . . 142
5.7.2 Minerva . . . 144
5.8 Summary . . . 147
6 Optimisation 148 6.1 Optimisation Potential . . . 150
6.2 Memory Optimisations . . . 158
6.2.1 Memory Access Pattern Techniques . . . 161
6.2.2 Cache Optimisation In Hydra . . . 163
6.3 Compute Optimisation . . . 171
6.3.1 Results . . . 173
6.4 Compute-Communication Overlap . . . 178
6.4.1 Implementation . . . 180
6.4.2 OpenMP Threaded Hydra . . . 186
6.4.3 MPI Threaded Overlap . . . 190
6.5 Node Core-Count . . . 193
7.1.1 Portable, Extensible Toolkit for Scientific Computing (PETSc)
Descomposition Behaviour . . . 200
7.2 Conjugate Gradient Performance Analysis . . . 202
7.2.1 CG Breakdown . . . 203
7.2.2 Coalesced CG . . . 212
7.3 Summary . . . 219
8 Conclusions 220 8.1 Thesis Limitations . . . 222
8.2 Future Work . . . 223
8.3 Final Words . . . 224
A Figure Data 245 B Other Validation Data 289 B.1 OpenMPI Comparison . . . 290
B.2 Hydra Critical Path by Function . . . 290
4.1 MPI Point-to-Point Data Exchange – Psudeocode . . . 80
4.2 Single Hydra Iteration — Pseudocode . . . 84
4.3 MDT Function — Pseudocode . . . 85
4.4 Mlagh Function — Pseudocode . . . 86
4.5 Madv Function — Psuedocode . . . 87
4.6 Madv{x/y/z} Function — Psuedocode . . . 87
4.7 Madvm{x/y/z}Function — Psuedocode . . . 88
4.8 Lartvis Function — Psuedocode . . . 88
4.9 ShortPrint Function — Psuedocode . . . 88
5.1 Barriered MPI Point-to-Point Data Exchange – Psudeocode . . . 135
6.1 Madvmx1Order-of-Operations — Variant A . . . 164
6.2 Madvmy1 Order-of-Operations — Variant A . . . 164
6.3 Madvmz1 Order-of-Operations — Variant A . . . 164
6.4 Madvmz1 Order-of-Operations — Variant B . . . 164
6.5 Madvmz1 Order-of-Operations — Variant C . . . 164
6.6 Variant G . . . 182
6.7 Variant H . . . 182
1.1 Top 500 Machine Performance Trends [161] . . . 5
2.1 Flynn’s Taxonomy . . . 16
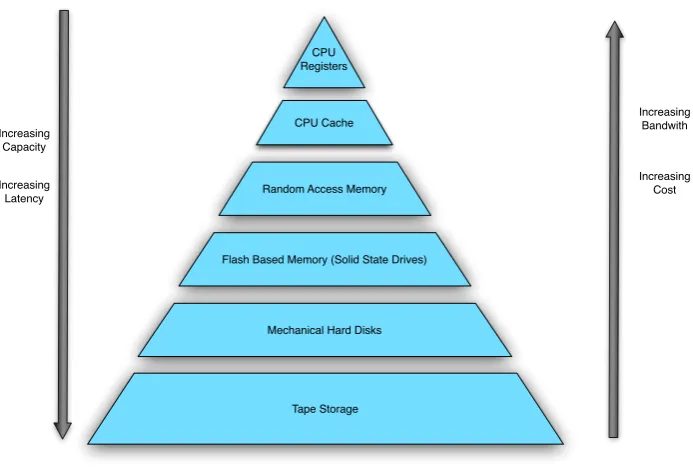
2.2 The Memory Hierarchy Pyramid . . . 29
3.1 Memory Benchmarks — Minerva (Intel v12.0) . . . 59
3.2 Intel MPI Benchmark (OpenMPI v1.4.3) — Minerva . . . 60
3.3 HECToR STREAM Benchmark (PGI 12.10) . . . 62
3.4 HECToR IMB Benchmark Measurements (MPICH2) . . . 63
3.5 Network Benchmark — DawnDev . . . 65
3.6 Point-to-Point Timings, Intel MPI Benchmark/SKaMPI . . . 67
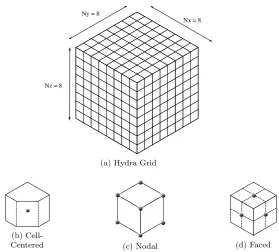
4.1 An 8×8×8 Cell Structured Mesh . . . 73
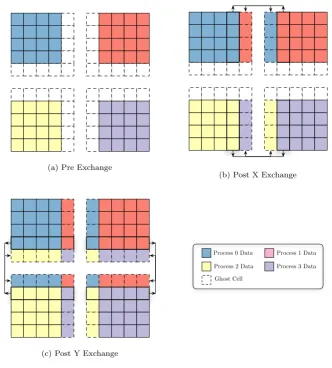
4.2 Hydra 2D Message Exchange — 2×2 Decomposition . . . 82
4.3 Hydra Function Mean Walltime per Iteration . . . 90
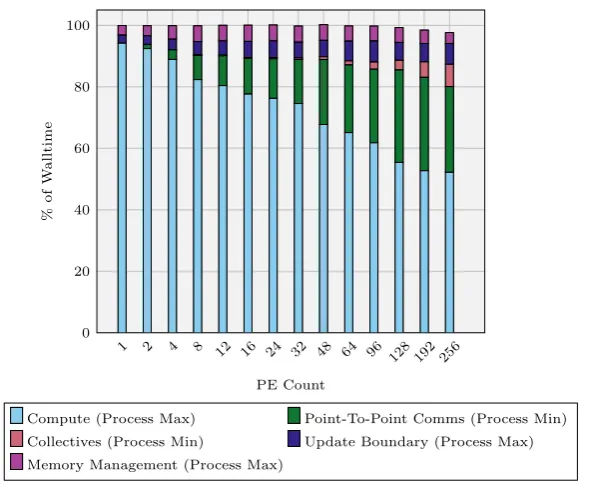
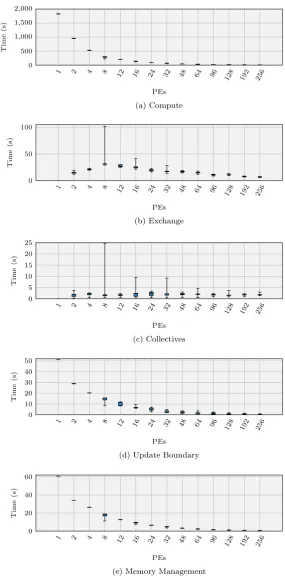
4.4 Max Walltime Breakdown — Weak Scaling — Minerva (Node Fill) 94 4.5 Total Time Spent by Component Across All Ranks, Weak-Scaling — Minerva . . . 95
4.6 Hydra Socket/Node Load Balancing - Minerva . . . 97
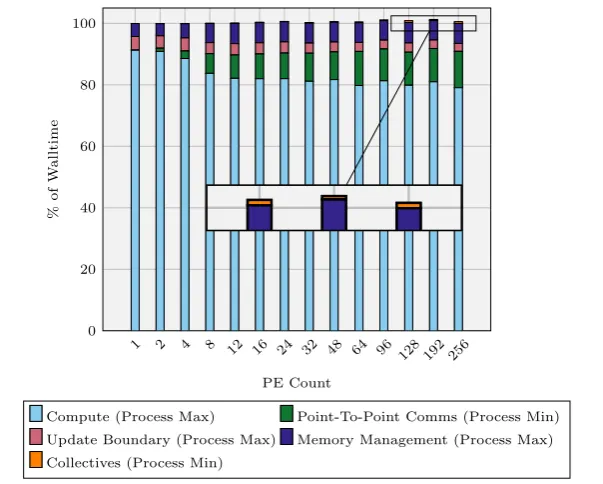
4.7 DawnDev/Hera 753 Weak-Scaling Hydra Walltime by Component 100 4.8 Max Walltime Percentage Breakdown . . . 102
4.9 Total Time Spent by Component Across All Ranks, Strong-Scaling — Minerva . . . 103
5.1 Lartvis1 Kernel Timings – Minerva, 6 Cores Per Socket . . . 125
5.2 Madvm Exchange Stage Walltimes - Minerva, OpenMPI-1.4.4 . . 133
(Dashed Line) . . . 136
5.5 IMB PingPong vs PingPing vs Exchange - Single Process Pair . . 139
5.6 IMB Exchange (Process Chain Scaling) . . . 139
5.7 IMB Simultaneous Chains (Chain Length 2 Processing Elements
(PEs)) . . . 139
5.8 Model Breakdown – Weak Scaled, 503per Core, Hera [44] . . . . 143
5.9 Model vs Empirical by Component Breakdown, Minerva . . . 146
6.1 Hydra Kernel Floating-Point Operation (FLOP)/s and Double
Precision Floating Point Operations (DPOPs):Cache Access
Ra-tio — Serial, Minerva (No VectorisaRa-tion) . . . 155
6.2 Minerva, Hydra Serial Execution, Walltime vs. Mean Kernel
DPOPs . . . 160
6.3 DPOPs, Cache Accesses — Hydra Variants A/B/C, Serial,
Min-erva) . . . 167
6.4 Memory Optimisation - Variant Total Walltimes . . . 170
6.5 Hydra Variants C, Dand E— Kernel Walltimes . . . 175
6.6 Message Passing Interface (MPI) Overlap Performance —
Non-Blocking Variants . . . 184
6.7 Non-Blocking Madv Behaviour — Minerva 1003 Weak-Scaling,
256 PEs . . . 185
6.8 MPI Overlap Performance — OpenMP Variants . . . 187
6.9 OpenMP Dynamic Schedule (Variant J), 1503, 12 Threads . . . . 188
6.10 MPI Communication/Computation Overlap - Non-Blocking, Threaded
Approach . . . 190
6.11 MPI Overlap Performance — Threaded Overlap Variants . . . . 191
6.12 Communication and Compute Overlap — Madvmx and Lartvis . 192
Preconditioner, HECToR, Weak-Scaled, 503 . . . 206
7.4 Single Matrix-Multiply Call (Mean) Breakdown by Function in
CG, CG/No Preconditioner, HECToR, Weak-Scaled, 503. . . 208
7.5 VecNorm Components, CG/No Preconditioner, HECToR,
Weak-Scaling 503 . . . 209
7.6 VecTDot Components, CG/No Preconditioner, HECToR,
Weak-Scaling 503 . . . 211
7.7 Solve Time per Iteration, CG/No Preconditioner, Weak-Scaled,
503 . . . 214
7.8 Base vs Coalesced CG Function Breakdown, CG/No
Precondi-tioner, HECToR, Weak-Scaled, 503, 16384 Cores . . . 215
7.9 Base vs Coalesced CG, VecNorm, CG/No Preconditioner,
HEC-ToR, Weak-Scaled, 503 . . . 217
7.10 Base vs Coalesced CG, VecDot, CG/No Preconditioner,
3.1 STREAM Benchmark Operations [111] . . . 56
3.2 Machine Specification — Minerva . . . 58
3.3 Machine Specification — HECToR . . . 61
3.4 Machine Specification — DawnDev . . . 64
3.5 Machine Specification — Hera . . . 66
4.1 Quantity grid sizes for aNx×Ny×Nz problem . . . 76
4.2 SamplePx, Py andPz values at scale [44] . . . 79
4.3 Minerva, Hydra Serial Walltimes . . . 89
4.4 Minerva, Hydra Weak-Scaling Walltimes (1003, Node-Fill) . . . . 92
4.5 Socket Process Allocation. Format — (Socket Core Count)×[Number of Sockets] . . . 96
4.6 Hera/DawnDev, Hydra Weak-Scaling Walltimes [44] . . . 99
4.7 Minerva, Hydra Strong-Scaling Walltimes (1503, Node-Fill) . . . 101
4.8 Minerva, Hydra, Process 0 Clock Speeds . . . 105
5.1 Model Summary - Hydra Input Parameters . . . 109
5.2 Model Summary - Iteration Model Overview . . . 111
5.3 Model Summary - Process and Cell Layout . . . 118
5.4 Model Message Size Parameters . . . 127
5.5 Message Size Models – Summary . . . 128
5.6 Pure Phase Type Quantity Frequency . . . 130
5.7 Hydra Walltime - Original vs. Global Barrier - Minerva . . . 135
5.8 Number of ISend/IRecv Pairs Total (Worst-Case Node) . . . 137
5.9 Minerva Communication Linear Regression Parameters . . . 141
5.10 Hera/DawnDev Model Validation, Weak Scaled, 503 Per Core [44] 143
1.4.3 . . . 145
5.14 Hydra Model Validation, Strong Scaling, Minerva Intel-12.0/OpenMPI-1.4.3 . . . 146
6.1 Summary of Hydra Variants . . . 149
6.2 Performance Application Programming Interface (PAPI) Hard-ware Counter Identifiers . . . 163
6.3 Kernel Loop Ordering — Outermost→Innermost . . . 166
6.4 Minerva, Hydra Serial, Variant E Streaming SIMD Extensions (SSE) — Vector Operation (VECOP):Total DPOP Ratio . . . . 174
6.5 Hydra 1003, Serial, PAPI Statistics — Intel X3430 . . . 177
6.6 Model Timings — Cores Per Socket, Minerva, Weak Scaled 1503 194 7.1 CG Function Sum Validation, CG/No Preconditioner, HECToR, PGI-12.10/MPICH-5.6.1, Weak Scaling (503) . . . 205
7.2 CG Function Call Frequency acrossi Iterations . . . 213
A.1 Experimental Parameters by Figure . . . 245
A.2 Experimental Parameters by Table . . . 246
A.3 Top 500 Max/Peak Performance, June 1993 - June 2016 - Data for Figure 1.1 . . . 247
A.4 STREAM – Data for Figure 3.1(b) . . . 248
A.5 IMB AllReduce Time, 4 Bytes – Data for Figure 3.2(b) . . . 248
A.6 IMB PingPong Intra/Inter-Node — Figure 3.2(a) . . . 249
A.7 CacheBench – Data for Figure 3.1(a) . . . 250
A.8 STREAM – Data for Figure 3.3 . . . 251
A.9 Intel MPI Benchmark (IMB) AllReduce, 8 Bytes – Data for Fig-ure 3.4(b) . . . 251
A.13 Hydra – Function Serial Scaling – Time Per Iteration –
Intel-12.0/OpenMPI-1.4.3 – Data for Figure 4.3 . . . 255
A.14 Hydra, Minerva, Walltime Breakdown by Component (Min/Max)
– Data for Figure 4.4 . . . 256
A.15 Hydra, Minerva, Process Timing Range, Compute and Exchange
– Data for Figure 4.5(a) . . . 256
A.16 Hydra, Minerva, Process Timing Range, Collectives and Update
Bounds – Data for Figure 4.5(c) . . . 257
A.17 Hydra, Minerva, Process Timing Range, Memory Management –
Data for Figure 4.5(e) . . . 257
A.18 Hydra, Minerva, Weak-Scaling - Node/Socket Load-Balancing –
Data for Figures 4.6(a), 4.6(b) . . . 258
A.19 Hydra, DawnDev/Hera, Weak-Scaling - Walltime Breakdown –
Data for Figure 4.7 . . . 258
A.20 Hydra, Minerva, Walltime Breakdown by Function (Min/Max) –
Data for Figure 4.8 . . . 259
A.21 Hydra, Minerva, Process Timing Range, Compute and Exchange
– Data for Figure 4.9(a) . . . 260
A.22 Hydra, Minerva, Process Timing Range, Collectives and Update
Bounds – Data for Figure 4.9(c) . . . 260
A.23 Hydra, Minerva, Process Timing Range, Memory Management –
Data for Figure 4.9(e) . . . 261
A.24 Minerva, Data for Figures 5.2, 5.3 . . . 262
A.25 Minerva, Data for Figure 5.9a . . . 262
A.26 Minerva, Data for Figure 5.9b . . . 263
A.27 PAPI Serial Mean Statistics for Kernel Madvx2, Variant A– Data
A.29 PAPI Serial Mean Statistics for Kernel Madvz2, Variant A– Data
for Figures 6.1, 6.2, 6.3(c) . . . 266
A.30 PAPI Serial Mean Statistics for Kernel Madvmx1, Variant A–
Data for Figures 6.1, 6.2, 6.3(d) . . . 266
A.31 PAPI Serial Mean Statistics for Kernel Madvmy1, Variant A–
Data for Figures 6.1, 6.2, 6.3(e) . . . 266
A.32 PAPI Serial Mean Statistics for Kernel Madvmz1, Variant A–
Data for Figures 6.1, 6.2, 6.3(f) . . . 267
A.33 PAPI Serial Mean Statistics for Kernel MDT1, Variant A– Data
for Figures 6.1 . . . 267
A.34 PAPI Serial Mean Statistics for Kernel MDT2, Variant A– Data
for Figures 6.1 . . . 267
A.35 PAPI Serial Mean Statistics for Kernel Mdivu, Variant A– Data
for Figures 6.1 . . . 268
A.36 PAPI Serial Mean Statistics for Kernel Lartvis1, Variant A– Data
for Figures 6.1 . . . 268
A.37 PAPI Serial Mean Statistics for Kernel UpdVel, Variant A– Data
for Figures 6.1 . . . 268
A.38 PAPI Serial Mean Statistics for Kernel Madv1, Variant A– Data
for Figures 6.1 . . . 269
A.39 PAPI Serial Mean Statistics for Kernel Madvx2, Variant B – Data
for Figures 6.3(a) . . . 269
A.40 PAPI Serial Mean Statistics for Kernel Madvy2, Variant B – Data
for Figures 6.3(b) . . . 270
A.41 PAPI Serial Mean Statistics for Kernel Madvz2, Variant B – Data
for Figures 6.3(c) . . . 270
A.42 PAPI Serial Mean Statistics for Kernel Madvmx1, Variant B –
A.44 PAPI Serial Mean Statistics for Kernel Madvmz1, Variant B –
Data for Figures 6.3(f) . . . 271
A.45 PAPI Serial Mean Statistics for Kernel Madvx2, Variant C – Data
for Figures 6.3(a) . . . 271
A.46 PAPI Serial Mean Statistics for Kernel Madvy2, Variant C – Data
for Figures 6.3(b) . . . 272
A.47 PAPI Serial Mean Statistics for Kernel Madvz2, Variant C – Data
for Figures 6.3(c) . . . 272
A.48 PAPI Serial Mean Statistics for Kernel Madvmx1, Variant C –
Data for Figures 6.3(d) . . . 272
A.49 PAPI Serial Mean Statistics for Kernel Madvmy1, Variant C –
Data for Figures 6.3(e) . . . 273
A.50 PAPI Serial Mean Statistics for Kernel Madvmz1, Variant C –
Data for Figures 6.3(f) . . . 273
A.51 Hydra Serial Walltimes, Minerva Intel-12.0/OpenMPI-1.4.3 – Data
for Figure 6.4(a) . . . 273
A.52 Hydra Strong and Weak-Scaling Walltimes – Data for Figures
6.4(b), 6.4(c), 6.6(a), 6.6(b) . . . 274
A.53 PAPI Serial Mean Statistics for Kernel MDT1, Minerva, Variants
D and E – Data for Table 6.4, Figure 6.5(a) . . . 274
A.54 PAPI Serial Mean Statistics for Kernel MDT2, Minerva, Variants
D and E – Data for Table 6.4, Figure 6.5(b) . . . 275
A.55 PAPI Serial Mean Statistics for Kernel UpdVel, Minerva,
Vari-ants D and E – Data for Table 6.4, Figure 6.5(c) . . . 275
A.56 PAPI Serial Mean Statistics for Kernel Lartvis1, Minerva,
Vari-ants D and E – Data for Table 6.4, Figure 6.5(d) . . . 275
A.57 PAPI Serial Mean Statistics for Kernel Mdivu, Minerva, Variants
A.59 PAPI Serial Mean Statistics for Kernel Madvmx1, Minerva,
Vari-ants D and E – Data for Table 6.4, Figure 6.5(g) . . . 276
A.60 Minerva – Strong and Weak-Scaling Walltime – Data for Figures
6.6(a), 6.6(b) . . . 277
A.61 Minerva – 256 PEs, 1003, Weak-Scaling – Communication Phase
Timings – Data for Figure 6.7(a) . . . 277
A.62 Minerva – 256 PEs, 1003, Weak-Scaling – Compute Kernel
Tim-ings – Data for Figure 6.7(b) . . . 278
A.63 Minerva, Strong and Weak-Scaling Walltimes — Variants C, I, J
— Data for Figure 6.8 . . . 278
A.64 Minerva Intel-12.0/OpenMPI-1.4.4, Dynamic Block Size
Perfor-mance, 1503, 12 Threads – Data for Figure 6.9 . . . 279
A.65 Minerva, Intel-12.0/OpenMPI-1.4.4 – 1003, Strong-Scaling
Wall-times – Data for Figure 6.11(a) . . . 280
A.66 Minerva, Intel-12.0/OpenMPI-1.4.4 – 1003, Strong-Scaling
Wall-times – Data for Figure 6.11(b) . . . 281
A.67 Minerva, Intel-12.0/OpenMPI-1.4.4 – 1003, Weak-Scaling, Lartvis
Walltimes – Data for Figure 6.12(a) . . . 282
A.68 Minerva, Intel-12.0/OpenMPI-1.4.4 – 1003, Weak-Scaling, Lartvis
1
Walltimes – Data for Figure 6.12(a) . . . 282
A.69 Minerva, Intel-12.0/OpenMPI-1.4.4 – 1003, Weak-Scaling, Lartvis
Walltimes – Data for Figure 6.12(a) . . . 283
A.70 Minerva, Intel-12.0/OpenMPI-1.4.4 – 1003, Weak-Scaling, Madvmx
Walltimes – Data for Figure 6.12(b) . . . 283
A.71 Minerva, Intel-12.0/OpenMPI-1.4.4 – 1003, Weak-Scaling, Madvmx1
Walltimes – Data for Figure 6.12(b) . . . 284
A.72 Minerva, Intel-12.0/OpenMPI-1.4.4 – 1003, Weak-Scaling, Madvmx
A.74 HECToR, PGI-12.10/MPICH2-5.6.1 – Single Matrix-Multiply Call
Mean Breakdown – Data for Figure 7.4 . . . 285
A.75 HECToR, PGI-12.10/MPICH2-5.6.1 – Data for Figure 7.5 . . . . 286
A.76 HECToR, PGI-12.10/MPICH2-5.6.1 – Data for Figure 7.6 . . . . 286
A.77 Minerva (Intel-12.0/OpenMPI-1.4.3), HECToR
(PGI-12.10/MPICH2-5.6.1) – Data for Figures 7.7(a), 7.7(b) . . . 286
A.78 HECToR (PGI-12.10/MPICH2-5.6.1), 16384 Cores, Weak-Scaling
503, CG Function Breakdown – Data for Figures 7.8 . . . 287
A.79 HECToR (PGI-12.10/MPICH2-5.6.1) – Data for Figures 7.9(a) . 287
A.80 HECToR (PGI-12.10/MPICH2-5.6.1) – Data for Figures 7.9(b) . 287
A.81 HECToR (PGI-12.10/MPICH2-5.6.1) – Data for Figures 7.10(b) 288
A.82 HECToR (PGI-12.10/MPICH2-5.6.1) – Data for Figures 7.10(b) 288
B.1 OpenMPI 1.4.3 vs 1.4.4 Hydra Walltime Comparison – Strong
Scaling . . . 290
B.2 Minerva, Serial, Time spent by Function . . . 290
B.3 Comparison of Measured L1 Data Cache Accesses . . . 291
Introduction
The advent of modern computing has unveiled a wide array of potential for
modern science. Enabling fast computation on a grand scale, it facilitates
the use of new techniques that enhance and compliment traditional scientific
practices within multiple disciplines. Simulations, mathematical models that
parameterise and capture the behaviour of real-world systems, constitute one
such tool; used in tandem with more traditional empirical investigations, they
have applications across a wide range of domains such as biology [47, 101, 145],
chemistry/physics [87, 91] and weather prediction [26]. In doing so, they have
become a driving force for the advancement of supercomputing, fueling demand
for ever-more powerful machines.
As part of a scientific or industrial workflow, the power of these High
Perfor-mance Computing (HPC) architectures has become intrinsically tied to the yield
of both simulation and data analysis, not only in achieving faster results [146]
but also in enabling more complex, refined simulations that were previously
unattainable due to the time prohibitive nature of their execution. Across the
course of long running executions, even a minor boost can result in significant
time savings. The effective use of these machines has thus become the primary
drive in HPC at all levels, from machine procurement and configuration to
per-formance optimisation and prediction. The field of HPC has developed around
these concepts, focusing upon both improving existing architectures as well as
looking ahead, predicting and planning for the architectures of the future.
With an ongoing push towards the major milestone of Exascale
comput-ing [48], the adoption of more novel architectures such as accelerators/co-processors
importance of the network has resulted in an increase in overall machine
com-plexity, making understanding the behaviour of a machine more crucial than
ever. The use of a significant multitude of algorithms across the domains
re-sults in a variety of different unknown demands upon these machines; ensuring
a high degree of efficiency promises to only become more difficult without
guid-ance on their usage. These HPC machines now represent a significant expense,
both in their initial procurement and in ongoing maintenance costs; achieving a
high throughput thus becomes neccessary to ensure a strong return from these
investments.
One approach towards achieving this goal has been the use ofperformance
models, constructs that aim to capture the key characteristics of a system and
algorithms in order to enable the prediction of their performance without the
hardware and/or time required to execute a real-time execution of the algorithm
in question. The work in this thesis represents the result of research into one such
approach, exploring the use of analytical modelling to capture the behaviour of
near-neighbour communication, structured grid applications. In particular, this
work focuses on Hydra, a key benchmark provided by the Atomic Weapons
Establishment (AWE) that is representative of a real-world application,
con-structing the first performance model that is able to accuractely describe its
behaviour. It is shown how such a model can be used alongside an
understand-ing of the application to identify and optimise bottlenecks, explorunderstand-ing a multitude
of potential opportunities for enhancement. Further, this thesis explores the
ap-plicability of such an approach to the Conjugate Gradient (CG) linear solver
within the Portable, Extensible Toolkit for Scientific Computing (PETSc), a
popular project with a different purpose/function but a demonstrably similar
behaviour in its implementation, showing how such techniques can be applied
on an application to application basis. In doing so, these methods can aid both
1.1
Motivation
Commenting on what he believed the future of computing hardware would
achieve, in 1965 Gordon E. Moore observed a trend that would come to
domi-nate the depiction of computing performance in the decades that followed:
The complexity for minimum component costs has increased at a rate
of roughly a factor of two per year... Certainly over the short term
this rate can be expected to continue, if not to increase. Over the
longer term, the rate of increase is a bit more uncertain, although
there is no reason to believe it will not remain nearly constant for at
least 10 years. Gordon E. Moore [118]
Moore’s observation (known as Moore’s Law) resulted in the prediction that
the future trend of the Central Processing Unit (CPU) transistor density was to
see an exponential growth, doubling approximately every two years. This trend
has typically been matched by an increase in theperformanceof a chip [25, 136].
In the early period following Moore’s publication, the most apparent
out-come of this was an improvement in the clock speed of the CPU. In conjunction
with Pollack’s Rule [25], which states “performance increases (when not limited
by other parts of the system) as the square root of the number of transistors
or area of a processor”, this has traditionally implied an overall improvement
in the performance of a chip as the transistor density improves. In the past
this improvement has previously offered easily accessable gains for serial
appli-cations with few to no changes required on the part of code maintainers, useful
for developers dealing with large or complex codes where refactoring and
opti-misation of such applications would require significant developmental resources.
This ultimately led to the period being described as a “free lunch” [164], yet it
was inevitable that such gains were unsustainable.
The physical consequences of increasing the tranistor density on a core have
proven to be an impediment to making such an approach permanently viable;
physical lower limit, voltage leakage [25] and heat generation [21, 96] threaten
to become prohibitive to efforts to improve CPU technology. Previously “easy”
gains in clock speed have become difficult to maintain, or are at the very least no
longer cost-effective [164], culminating in a paradigm shift towardsconcurrency.
Rather than making a single CPU core faster, tasks are distributed amongst
multiple computing entities to allow for their execution in parallel [165]. The
increase in transistor count on a chip has continued to observe Moore’s Law
for the present, but is no longer achieved through transistor density on a single
core of a CPU; rather multiple cores on a chip are now employed instead, in
some cases even resulting in an intentionally slower clock speed to provision for
heat, power or space requirements. Extending this concept past a single CPU,
work can be spread across multiple multi-core chips, installed in distributed
machines (nodes) that are physically separated but can communicate via some
form of network interconnect. This has resulted in the modern HPC field being
dominated by large scale, multi-core, multi-node cluster/grid supercomputing
systems that now handle the significant majority of the community’s workload,
typified by the concept of Beowulf clusters [159], with an additional shift towards
accelerator-based computing (see Section 2.2).
Due to the increasingly demanding requirements of modern simulations,
there is an ever-growing dependence upon the use of these modern
supercomput-ers. Their use has become the focus of a significant amount of research in both
industry and academia, addressing not only the development of efficient parallel
algorithms but also the implementation of new architectures or hardware
con-figurations, exploring what opportunities are available to increase the scientific
yield of such machines. The Top500 [84, 161] is dedicated to documenting
trends in the advancement of such machines, maintaining a bi-annually refreshed
report of the LINPACK [50] benchmark on the highest rated HPC machines.
Reporting both the practical (Rmax) and theoretical (Rpeak) peak number of
Floating-Point Operations per Second (FLOP/s), the rankings aim to provide
1993 1997 2001 2005 2009 2013 2017 10−1
102
105
Date
P
erformance
(TFLOP/s)
Rmax
Rpeak
(a) Linpack Performance
1993 1997 2001 2005 2009 2013 20170.0 20.0 40.0 60.0 80.0 100.0
Date
Efficiency
(RMax/RP
eak
-%)
(b) Machine Efficiency
Figure 1.1: Top 500 Machine Performance Trends [161]
machines that is both historical and current in nature. During the past 23 years
a substantial change can be observed, from an initial 0.053 TFLOP/s in 1993
to the first reported Petascale machine, RoadRunner, in 2008 that heralded a
new landmark in sustained performance and beyond. As of June 2016 the
highest FLOP/s result (as reported by LINPACK) sits at a substantial 93.01
PFLOP/s (Figure 1.1(a)), with efforts now ongoing towards achieving the next
major milestone —Exascale computing [20].
The use of the LINPACK benchmark as a simple means of comparing the
computational capacity of HPC machines has proven to be a useful one.
How-ever, the scientific/industrial community at large has a wide-range of
poten-tial applications for these computing resources, with no guarantee that any
two codes exhibit the same underlying performance characteristics; as a
conse-quence, they can make different demands of the underlying hardware. A strong
LINPACK performance does not mean that another application will achieve a
similar efficiency, and from Figure 1.1(b) it can be seen that even LINPACK
(Rmax) does not achieve 100% efficiency for numerous architectures when
con-trasted against a machine’s theoretical peak (Rpeak). Identifying the
perfor-mance characteristics of a particular workload is thus crucial when selecting an
architecture; it can greatly boost the scientific throughput of a machine if it is
enables the optimisation of applications through the identification of notable
bottlenecks.
While both clusters and grids are capable of executing HPC workloads, the
predominant architecture used in HPC is that of cluster machines. As evidenced
by how heavily they are represented in the Top500, they possess characteristics
that are more suited towards the features of such workloads, specifically:
• Clusters are often more homogeneous in their node hardware, as opposed
to grid systems which may use a multitude of differing compute devices.
Since parallel codes can often operate at the speed of the slowest compute
device (due to blocking communication behaviours), the use of similar
hardware can prevent any need for extra oversight in the assignment and
decomposition of data to prevent load imbalance.
• Unlike cluster machines, the nodes of grid computers are typically more
geographically dispersed, resulting in the use of slower interconnects such
as the internet rather than the faster network interconnects often utilised
by cluster machines.
This is not to say however that there are not also complexities to the use of
cluster architectures. The modern HPC cluster can possess a number of different
architectural components, each of which can have complex interactions with
one another that impact upon the overall performance of an application. As
well as the underlying CPU performance, the data-processing throughput of
many applications can put great demands upon the memory bandwidth and/or
latency of a system. The difference in parity between the advancement of CPU
performance and memory performance has given rise to a problem known as
the “memory-wall” [178], where systems are often becoming more performance
bound by the bandwidth and latency of memory rather than the maximum
computational throughput a system is capable of. Further, the nature of parallel
compute means that the neccessity of data communication between remotely
both bandwidth and latency, of the network interconnect becomes crucial to
ensuring speedy transmission of such data. A wide range of different potential
network topologies can mean that the effective distribution of parallel work is
crucial to minimising these overheads.
Finally, more recent advancements in the HPC domain have seen the
intro-duction of accelerators such as the IBM Cell accelerator [85], General Purpose
Graphics Processing Units (GPGPUs) using CUDA [134, 131]/OpenCL [125,
160] and Intel’s Xeon Phi architecture [38, 139], add-on components that seek
to enhance the parallel compute performance of individual nodes, marking a
shift to a more hybrid/hetrogeneous style of HPC where multiple different
com-pute hardware elements are available. At the time of writing many of the highest
rated Top-500 machines exploit such hardware indicating that this is a trend
that is unlikely to change in the immediate future. While not all codes yet use
such technologies, understanding and designing for hybrid systems early in the
development cycle can mitigate the cost of significant re-engineering efforts later
in an application’s lifecycle.
It is in this context that understanding the software and hardware that
un-derpins modern HPC architectures has become crucial to the effective use of
resources. The complexity of modern HPC architectures increases the risk of
introducing major performance bottlenecks, while the cost and time required
to procure, operate, and maintain such machines makes the impact of an
un-suitable/inefficient machine significant. Selecting the most appropriate machine
during the procurement phase is paramount to its longevity and usefulness
dur-ing its lifetime. The use of performance models provides a means by which
a user can assess their workload on a HPC machine when active or
poten-tially even prior to its purchase. Other works have demonstrated the use of
performance models not only in their capacity for predicting performance
run-time [32, 71, 72, 90, 107, 108, 122, 123, 124], but also in their ability to aid
in the procurement and configuration of HPC machines [74, 89]. The trend of
unfore-seen complexity to maintaining high throughput, especially given the variety of
workloads/applications of interest within the realm of academia and industry.
Providing a means to explore performance without having the full hardware
available, these models enable the user to explore not only alternate
configura-tion on existing hardware, but also to explore the domain of future architectures.
Of the various scientific domains, hydrodynamics applications fall into one
such class of codes of interest, representing a significant part of the HPC
work-load at organisations such as AWE in the UK and the U.S. national
labora-tories. For this reason, benchmark codes representative of these applications,
such as SAGE from the Los Alamos National Laboratory (LANL) [90] and
Hydra from AWE [44], provide a key tool for evaluating HPC systems
dur-ing design, procurement, installation and maintenance. The development of
such HPC codes, the evaluation of their performance on candidate systems and
sustaining performant execution is a costly and time consuming exercise. To
aid in these activities, much academic research has been conducted into
de-veloping accurate performance modelling tools and techniques for application
analysis [75, 90, 109, 124, 163].
The subject of this thesis is the use of predictive models to capture an
understanding of performance and use this knowledge to explore potential
op-timisation opportunities that may exist. The core focus of this thesis is based
around Hydra, a high-performance hydrodynamics benchmark developed and
maintained by AWE. The developed model elucidates the parallel
computa-tion of Hydra, with which it is possible to predict its run-time and scaling
performance on varying large-scale Chip Multi-Processor (CMP) clusters. A
key feature of the model is its granularity; the model is able to separate the
contributing costs, including computation, point-to-point communications,
col-lectives, message buffering and message synchronisation. We also explore how
these techniques can be portable to other applications of interest such as PETSc,
a linear solver library commonly in use among a number of scientific
The aims and objectives of this work are to demonstrate how the use of
per-formance models can aid in the development and execution of HPC applications
in a fast-changing environment. The rapid development of new architectures and
programming paradigms, combined with the frequent turnover of HPC
architec-tures in favour of more modern hardware, leads to a scenario where it is crucial
to not only understand the existing performance constraints of an application,
but to also be aware of future hindrances that might prevent a developer from
taking full advantage of new advances. Through the use of performance models,
it is possible to not only develop a strong understanding of existing performance
hotspots, but also to permit the adjustment of hardware parameters or to
in-vestigate the impact on overall performance when modifying a subset of the
application. This can have uses in not only the development and optimisation
of a code, but also during machine procurement where projections can aid in the
decision making process. The development of one such performance model in
this work is intended to show how such models can be constructed and applied,
highlighting their potential use as part of a HPC workflow.
1.2
Thesis Contributions
This thesis makes the following contributions:
Contribution 1: An initial performance analysis of Hydra
A strong and weak scaling study is used to identify the key performance
in-fluencing characteristics of Hydra, a structured-grid hydrodynamics
bench-mark. Seperately distinguishing these key contributors of performance into
compute, collective communications and near-neighbour data exchange
com-munications, it is revealed how different machine characteristics can influence
the application’s parallel behaviour. In addition, areas of unusual behaviour
are identified for further study, showing how a performance model could
Contribution 2: Construction and validation of an analytical perfor-mance model of Hydra
Building upon this empirical knowledge of Hydra, a performance model is
constructed that enables the prediction of run-time performance to within
15% of error at scale. As well as establishing the compute kernel behaviour,
communication patterns are also captured, modelling both intra- and
inter-node communications, as well as the influence of an increasing process count
and synchronisation upon collective MPI operations. This granular model
enables the exploration of various characteristics upon performance,
chang-ing not only the configuration parameters but also a machines performance
metrics , enabling model-led investigation of alternate runtime environments.
This can lead to more accurate assessment of such machines during
procure-ment, ensuring that they meet the demands placed upon them during their
operation, as well as highlighting unusual behaviour in the benchmarks
per-formance when contrasted against model predicted outcomes.
Contribution 3: Optimisation of the Hydra benchmark
Following from the observed behaviour, there exist a number of deviations
from what might be expected of model-predicted performance of some
ker-nels. With the knowledge provided by both the model and the scaling
inves-tigations, potential optimisations are explored to both correct and improve
upon the existing benchmark; this targets three machine linked
characteris-tics of interest — compute performance, memory access patterns and
com-pute/communication overlap. Further, demonstrating how the model can be
used to predict configuration changes, the impact of modifying the number
of compute cores used per node is explored. Such improvements can lead
to improved performance not only for existing hardware but potentially also
across future hardware, showing how the upfront cost of performance
Contribution 4: Linear solver analysis
It is expected that, within the scientific domain, interest will exist for other
benchmarks beyond that of a limited sample. As such, performance
mod-elling techniques must have some degree of portability in their
implementa-tion or usage. To this end, the performance of PETSc, a linear solver library
that is an integral part of many other scientific benchmarks, is investigated,
focusing upon the CG linear solver algorithm. While the purpose of PETSc
may differ, the underlying compute and communication behaviour of the
CG algorithm exhibit many similarities with Hydra, showing how the
per-formance modelling techniques used within this thesis could be applicable
to other applications.
1.3
Thesis Overview
The remainder of this thesis is structured as follows:
Chapter 2provides a detailed theoretical background of the basic concepts and
techniques employed by the HPC community in the fields of performance
analy-sis, engineering and modelling. In particular, it focuses upon current techniques
for effective parallelisation, the theoretical laws that govern the performance of
parallel algorithms and the tools used to achieve these goals.
Chapter 3details the experiment setup of the investigations undertaken within
this thesis; specifically, the machines, tools, libraries and software configurations
used to obtain empirical data. A selection of benchmark results for base
ma-chine parameters such as memory or network interconnect performance are also
Chapter 4 introduces Hydra, a benchmark Hydrodynamics application
pro-vided by AWE. Used as a case study herein, it is a representative benchmark of
a workload of interest, and contains characteristics that are exhibited by other
scientific applications of interest in the HPC domain. We explore the
perfor-mance of the current implementation and identify a number of areas for further
investigation — in particular underperforming kernels and the impact of the
machine’s hardware metrics.
Chapter 5 expands upon the initial performance analysis work of Chapter 4.
The understanding of Hydra’s behaviour is used to construct a parallel
per-formance model of Hydra, providing insight into a number of characteristics
including compute performance, point-to-point communication patterns,
quan-tity of data communicated and collective behaviour.
Chapter 6applies our knowledge of Hydra from both performance analysis and
performance modelling to investigate a broad range of optimisations, applicable
to a variety of potential bottlenecks that can exist in modern HPC
architec-tures. Techniques of interest include memory pattern optimisation, the use of
vectorisation, hybrid OpenMP/Message Passing Interface (MPI) execution and
message-passing overlap with compute. Machine configuration guided by
mod-elling insights is also explored.
Chapter 7 introduces PETSc, a linear solver library, from which the
perfor-mance of the CG linear solver algorithm is examined. Demonstrating the use of
techniques previously applied to Hydra to capture performance characteristics
of interest, similarities in the structure of its parallel implementation to Hydra
are identified despite differences in their purpose. By extension, it is shown how
similar modelling techniques could be applied to CG, showing an example of
the portability of such techniques. Further, the performance of the CG solver
reduce the number of collective operations, highlighting the performance impact
of collective operations and their effect on scalability.
Chapter 8 concludes this work, providing a summary of the outcomes and
Performance Analysis, Modelling and Optimisation
Within the fields of science and industry, the adoption of parallelism for the
pur-poses of High Performance Computing (HPC) has led to widespread demand
for a variety of tools. The complexity of parallelism is such that while the
op-portunities are great, the development process can be difficult, expensive and
time-consuming. As a consequence, the available range of parallel hardware and
techniques developed by both academia and industry has matured as the field
has grown. However, despite the progress made in developing powerful tools
for implementing parallelism, some degree of manual process remains. Even
with automated techniques, an application must be designed in such a way that
makes it amenable to executing tasks in parallel, with a range of approaches
still necessitating direct implementation within the codebase itself. Identifying
which parallel techniques are of interest, and understanding how they behave,
is crucial during the development process to ensure both correct and
perfor-mant code. Switching from a serial to parallel design can introduce a number
of potential error vectors, such as race-conditions, lack of data coherency or
performance degradation resulting from complex interactions between machine
components and the introduction of data commmunication overheads.
Address-ing this, much work has occurred in the field towards classifyAddress-ing parallel
appli-cations, understanding their behaviours and constructing toolchains that can
aid in their development.
In this chapter a background of work from the field of HPC is introduced,
focusing primarily upon its importance to the performance of an application.
Specifically:
different forms that it can take;
• Section 2.2 describes the critical components that can influence the parallel
performance of a machine;
• Section 2.3 introduces the core concepts of performance modelling and
analysis. This details the various models and laws used to describe the
parallel performance of an application, as well as analytical and
simula-tion techniques that can be used to construct a performance model of an
application.
2.1
Forms of Parallelism
Unlike a serial application, which can only conduct operations sequentially, a
parallel program can vary in the order of execution across multiple distinct
hard-ware units. Capable of performing two or more operations simultaneously, such
programs are potentially able to scale their performance with the introduction
of additional compute components and a means to share data between them.
However, these advantages often come with a number of constraints that dictate
their usage; this complicates their implementation, debugging and performance
optimisation. This section introduces a number of parallel concepts,
includ-ing different algorithmic categories and the various hardware architectures that
enable their implementation.
2.1.1
Flynn’s Taxonomy — Program Classification
Flynn’s Taxonomy [55] describes four different classifications in an effort to
bet-ter capture the types of parallelism available. The Single Instruction, Single
Data (SISD) classification (Figure 2.1(a)) describes the characteristics of a serial
application, i.e., one that possesses no form of parallelism. In contrast to this,
the three remaining classifications all distinguish between the parallelisation of
D1 I1 D2 I2 D3 I3 D4 I4 1 2 3 4 Step Instruction Stream StreamData
(a) SISD
D1 D2 D3 D4 I1
D5 D6 D7 D8 I2
D9 D10 D11 D12 I3
D13 D14 D15 D16 I4 1 2 3 4 Step Instruction
Stream StreamData
(b) SIMD
I1 I2 I3 D1
D2 D3 D4 1 2 3 4 Step Instruction Stream Data Stream
I4 I5 I6
I7 I8 I9
I10 I11 I12
(c) MISD D1 I1 D3 I3 D5 I5 D7 I7 1 2 3 4 Step Instruction Stream 1 Data Stream 1 D2 I2 D4 I4 D6 I6 D8 I8 Instruction Stream 2 Data Stream 2 (d) MIMD
Figure 2.1: Flynn’s Taxonomy
Data (SIMD); Multiple Instruction, Single Data (MISD); and, Multiple
Instruc-tion, Multiple Data (MIMD).
A SIMD program (Figure 2.1(b)) uses parallelism of the data stream but
not of the instruction stream. It is capable of applying the same instruction to
multiple pieces of data simultaneously, enabling a much greater throughput of
data processing, albeit with the restriction that the problem must be amenable
to repeating the same operation across a large dataset.
MISD (Figure 2.1(c)) is the opposite of this, parallelising the instruction
stream but not the data stream, enabling the execution of multiple operations
on the same piece of data. This category sees little use in modern HPC, due to
repeat-ing a similar set of instructions across large datasets, for which this approach is
not suitable.
MIMD (Figure 2.1(d)) is a combination of these two parallel approaches,
enabling the parallelisation of both the instruction and the data stream. This
is one of the more common forms of parallelism in HPC today, as it enables
the distribution of data across multiple parallel units while each is capable of
operating a different instruction stream. Darema [43] extends this
classifica-tion one step further to introduce the Single Program Multiple Data (SPMD)
category. This better describes parallel applications of a Shared Memory
Paral-lelism (SMP) or distributed nature that execute the same program concurrently
on various Processing Elements (PEs), resulting in the execution of similar (but
distinctly separate) instruction streams asynchronously upon different datasets
(or portions thereof). The critical path of such programs is usually similar
between processing elements, yet cannot be classified as SIMD due to the
po-tential for variation and there being no guarantee that the same operations on
different parallel units are being conducted simultaneously as part of their
asyn-chronous nature. It is this characteristic which adds an additional complexity
to understanding the performance of SPMD applications.
2.1.2
Single-Thread Parallelism
A number of hardware designs exist to exploit parallelism within an application
at the instruction level; such an approach is classified as Instruction Level
Par-allelism (ILP) [150]. Examples include:
Instruction Pipelining
Instructions are decomposed into a number of micro-instructions. Different
micro-instructions that do not share the use of the same resources can be
conducted in parallel. By employing pipelining, micro-instructions from two
or more instructions are able to be executed in parallel, permitting the
Superscalar Processors
A superscalar processor is designed with multiple execution resources,
per-mitting the execution of more than one instruction per cycle. This is different
from instruction pipelining where only micro-instructions are conducted in
parallel. It can be the case that a processor is both superscalar and capable
of pipelining.
Out-of-Order Execution
Out of order execution permits, data dependancies withstanding, the
exe-cution of instructions in an order different to that of the original program.
When an instruction is waiting on data to become available for processing,
an action that would normally result in a processor stall, the execution unit
can use these idle cycles to execute an alternate, non-dependent instruction
instead, mitigating the impact of a potential delay. The results are reordered
such that they appear as if they had been executed as per the original
pro-gram flow.
Vectorisation
Vector units take advantage of vector instructions to implement SIMD level
parallelism within a core, enabling the processing of multiple units of data for
a single instruction from an instruction stream. Examples include SSE and
AVX [54, 79] (Intel/AMD), Altivec [46] (PowerPC) or NEON [9] (ARM).
2.1.3
Shared Memory Parallelism
SMP exploits multi-core architectures, where multiple processing cores exist
on the same chip but must share the remaining machine resources such as its
main memory. The one notable exception to this is the use of cache memory,
where a multi-core processor can possess one or more cache levels unique to each
among the various cores through the use of threading Application Programming
Interfaces (APIs) such as POSIX threads [99, 130] or OpenMP [42] to allocate
at least one work-thread to a core. Approaches such as Intel’s Hyper-Threading
Technology [93, 106] support the creation of two virtual/logical threads per
physical core, but still share the resources of a core among its bound threads.
This enables one thread to exploit resources underused by another thread such
as when stalling occurs.
The benefits of SMP are readily apparent; by distributing and executing a
workload in parallel significant speedups can be obtained. However there are a
number of restrictions upon the use of this form of parallelism. Use of libraries
such as OpenMP permits the automation of the threading process to a degree,
but a developer must still ensure that suitable regions of code are parallelisable,
with no data-dependancies that impede the parallelisation process.
In addition to the mechanics of its implementation, ensuring performant
threading has a set of additional requirements for consideration. Algorithms
must have their workload decomposed and distributed in a manner that results
in a reasonable workload balance, such that a single core is not required to
perform a significantly greater amount of work than any other core. Further
to this, the creation of a thread and allocation of work can be expensive, thus
sufficient work must be made available for it to be worthwhile.
The use of shared memory also introduces the issues of concurrency, race
conditions and cache-coherency, where the order of threads accessing memory
can result in different output if not handled correctly. Critical regions can
combat issues of concurrency, but introduce a serial bottleneck into a parallel
application, as well as the overhead of locking and unlocking a region of code.
Finally the use of shared resources incorporates the problems of contention, that
a shared resource such as memory bandwith may reach a saturation point where
an execution unit is starved of data — commonly referred to as the memory
2.1.4
Distributed Memory Parallelism
Distributed memory parallelism is built upon the foundation of SMP; the
prin-ciple of sharing a workload across multiple PEs remains. However SMP relies
upon particular characteristics of the underlying hardware — each compute
unit is able to access a shared memory space where the results of other compute
units can be stored and accessed freely, for example, via main memory. Since
a compute unit may require the results of computation from another compute
unit, such access is a neccessity. Distributed architectures however can consist
of multiple distinct machines or nodes, with no shared resources in common
(other than the hardware that comprises the network routing and
communica-tion facilities).
The advantage of this is clear — a shared memory unit is limited by the
number of available cores that can be placed into a single machine and the
saturation of its shared resources. A distributed architecture however, ignoring
the limitations of sufficient power, cooling and space, could continue to scale
its PE count by continuously adding more and more machines to the overall
structure. In doing so they offer a far greater scale of parallelism by increasing
the capacity for the overall system to distribute the workload across a larger
number of compute units.
A distributed setup does however come with its own set of disadvantages
and limitations. Data sharing between distinct nodes requires some form of
communication interconnect, the bandwidth and latency of which will typically
be slower than the intra-node counterpart. These data exchanges are also
typ-ically managed manually by the application due to individual processes being
unaware of data stored on remote nodes, yet said data is necessary to prevent
the propogation of errors that would otherwise arise. Failure to retrieve this
data results in a lack of coherency across the cluster and invalid computation.
This introduces a greater complexity in the development and debugging of
par-allel applications, as it is possible to bring about race conditions when data is
for the output of another node that never communicates its data. In addition,
while the hardware may be able to scale in its quantity/capacity, this does not
necessarily translate into equivalent performance, as addressed later in Sections
2.3.1 and 2.3.2 of this chapter.
The need for parallel data communication has resulted in a number of
at-tempts to standardise the API used by parallel applications to provide a
con-sistent and understandable description of how data is handled by the nodes. A
number of different approaches have been attempted, including the Parallel
Vir-tual Machine (PVM) [65], Message Passing Interface (MPI) [59, 67] and global
address space languages such as Co-array Fortran (CAF) [133] and Unified
Par-allel C (UPC) [39, 51]. Of these, the MPI standard has seen the most widespread
adoption, providing a standard with a wealth of descriptive API functions with
well defined outcomes, but leaving the specifics of their implementation to both
academia and industry. As such, a variety of different MPI libraries exist,
tar-geted at either providing a general-purpose solution available to the community
at large, such as OpenMPI [61] and MPICH [68], or to provide an optimised
library attuned to the characteristics of a particular architecture, such as MPI
on the BlueGene/L architecture [5].
Within the MPI standard, each unique MPI process is treated as a distinct
separate processing element with no shared memory space, regardless of the
underlying hardware that they are bound to. As such, data sharing between
the MPI processes can only occur through the MPI API — even if two MPI
processes both use a different core on the same node, they are unable to see
one another’s allocated block of memory; all communication occurs through
the use of MPI point-to-point communication functions, such as Send or Recv,
that communicate directly between two processes, or collective functions, such
as MPI AllGather/AllReduce, which communicate from one-to-many,
2.1.5
Accelerators
Recent advances in computing have seen the introduction of a new addition
to the field of parallel computing — accelerators. As highly parallel compute
devices, they are typically installed alongside a Central Processing Unit (CPU)
within a machine to form a hybrid architecture, where work is offloaded in part
from the CPU to the accelerator device for processing. They can see a sizeable
initial overhead in data transfer, but potentially offer a significant increase in
the level of parallelism a machine is capable of. Examples of accelerators that
have been introduced to the scientific community, either past or present, include:
Cell Broadband Engine Architecture
The Cell Processor [85], introduced in HPC as a component of
Roadrun-ner [18], contains 9 processing units — a geRoadrun-neral purpose Power Processing
Element (PPE) that acted as a scalar main processing unit and 8 Synergistic
Processing Elements (SPEs) that functioned as vector processors to provide
the bulk of the Cell’s parallel processing power. However, while the chip
provided the boost in power required to make Roadrunner the first
Petas-cale architecture in the TOP500 [161], it did not see a widespread adoption
among the HPC community. This was in part due to its overall complexity
— the PPE acted as the primary device for orchestrating how the SPEs were
used, but each SPE possessed its own reserved block of memory from which
it could draw instructions and data for processing. This neccesitated the use
of explicit Direct Memory Access (DMA) requests for data transfer, placing
a significant degree of difficulty in modifying existing codebases for use on
the architecture. In addition, the heavily restricted size of SPE memory
meant that such requests had to be carefully managed, raising the degree of
micro-management required to handle data for processing.
General Purpose Graphics Processing Units