Predictive analytical model for chloride concentrations in the Port of Rotterdam : for analyzing the effect of human interventions in the Rhine Meuse Delta
86
0
0
Full text
(2) Cover image: New Waterway. https://beeldbank.rws.nl, Rijkswaterstaat / Joop van Houdt. i.
(3) Predictive analytical model for chloride concentrations in the Port of Rotterdam For analysing the effect of human interventions in the Rhine-Meuse delta by R.H. Linneman. In partial fulfilment of the requirements for the degree of Master of Science in Water Engineering and Management at the University of Twente. September 2019, Amersfoort. Contact: ralflinneman@hotmail.com Graduation Committee: Prof. Dr. Kathelijne M. Wijnberg Dr. ir. Erik M. Horstman Glenn M. Morvan MSc Ir. Matthijs van den Brink. University of Twente University of Twente HydroLogic HydroLogic. ii.
(4) Preface First, I would like to thank Glenn for all the time and effort that he put into supporting and guiding me during this research. Our numerous meetings on how to improve and expand this research made this thesis into something that I am very proud of. Also, I would like to thank Matthijs for keeping sight on the bigger picture of this complex subject. Whenever you joined the conversation, I was always better able to structure the thesis. Also, I would like to thank all my colleagues at HydroLogic for the very pleasant time during my stay. I owe many thanks to Erik for his major support in structuring and focussing this thesis during our weekly Skype meetings and improving my writing skills with the use of the reviews he provided. I would also like to thank Kathelijne for her feedback which helped a lot in presenting the advantages of this research. I hope you find this report informative and I hope that you enjoy reading it. Ralf Linneman Amersfoort, September 2019. iii.
(5) Summary Fresh water from estuaries is widely used, from drinking water production to agricultural use. The water quality standards for these various applications are regulated. One of these standards concerns the chloride concentration. Alterations in estuaries, such as deepening, may affect the chloride concentration inside the estuary. The Rhine-Meuse delta is such an estuary in which the fresh water is widely used for e.g. shipping but also for drinking water production and cooling. Therefore, predicting chloride concentrations in estuaries is important. Based on previously obtained measurement data, an analytical model is developed which provides insight in the importance and influence of boundary conditions on chloride concentrations. Chloride concentrations within the estuary are affected by many processes, which can be summarized in three main factors; the inflow of salt water due to tides; the inflow of fresh water due to river discharge and the mixing processes between these inflows. Previous research indicated that deepening of the New Waterway and Botlek may lead to increased chloride concentrations in the Rhine-Meuse delta. In this research daily averaged values were used. Due to the dependence of the inflow of salt water on the tidal water movement, however, this analysis is best performed at the time scale of the in- and outflow of the tidal wave. The inflow of fresh water in the Rhine-Meuse delta originates from the Waal, Meuse and Lek rivers, of which the discharge volumes are measured upstream of the estuary. These discharges take a certain amount of time to reach the measurement locations for chloride concentrations in the estuary. Similarly, the inflow of salt water with the tidal wave, measured as the water level at the mouth of the estuary, takes time to propagate into the estuary and reach the chloride concentration measurement locations. These time lags are determined, with the use of a cross-correlation analysis between the observed boundary conditions and the chloride concentrations, at four different locations in the estuary. Resulting time lags vary from 110 minutes to 280 minutes regarding the tide and 750 minutes to 1900 minutes regarding the discharges of the Waal, Meuse and Lek. Variations in chloride concentrations at all four examined measurement locations are best explained with a non-linear analytical model, including parameters that describe the autocorrelation of the input parameters with a moving weighted average. Performance of the developed predictive analytical model of Lekhaven on the training dataset was determined at a R2 value of 0.87 and a RMSE value of 469.4 mg/L and on the validation dataset at a R2 value of 0.80 and a RMSE value of 579.1 mg/L. Similar results were found for the three other measurement locations. For the analysis of the effects of human interventions on chloride concentrations in the estuary of the Rhine-Meuse Delta, such as deepening of the New Waterway and Botlek, the developed analytical predictive models can be applied on post human-intervention gathered data. This analysis on measurement data can be used to validate results of theoretical models, and as indication on how relations between input parameters have changed due to human intervention in the Rhine-Meuse Delta. Furthermore, the developed prediction models can be used for predictions of chloride concentrations with the use of expected values for the discharge of the Rhine and the astronomical tide.. iv.
(6) Predictive analytical model for chloride concentrations in the Port of Rotterdam. Contents Preface. ......................................................................................................................... iii. Summary. ......................................................................................................................... iv. 1. 2. 3. Introduction ................................................................................................................ 4 1.1. Background. 5. 1.2. The Rhine-Meuse Delta. 6. 1.2.1 Salt intrusion dynamics 1.2.2 Chloride concentration measurement locations. 7 11. 1.3. Effects of deepening. 12. 1.4. Objective and research questions. 13. 1.5. Research approach and reading guide. 14. Optimization of dataset.......................................................................................... 16 2.1. Available measurements. 17. 2.2. Analysis period. 18. 2.3. Correlation method. 19. 2.4. Time lag of boundary conditions. 21. 2.4.1 Water level 2.4.2 Discharge. 21 22. 2.5. Sampling interval. 26. 2.6. Summary. 28. Chlorinity predictor model development ........................................................... 30 3.1. 3.2. 3.3. hydrologic.com. Regression model building and validation methodology. 31. 3.1.1 3.1.2 3.1.3 3.1.4 3.1.5 3.1.6. 32 32 34 35 37 37. Training and validation datasets Parameter normalization and non-linear weighting Autocorrelation of boundary conditions Parameter selection Sensitivity analysis Uncertainty analysis. Lekhaven prediction model. 38. 3.2.1 3.2.2 3.2.3 3.2.4 3.2.5 3.2.6. 38 40 41 41 42 44. Parameter selection with multi-step analysis Performance on training dataset Performance on validation dataset Sensitivity analysis Uncertainty analysis Model selection. Spijkenisserbrug prediction model. 45. 1.
(7) Predictive analytical model for chloride concentrations in the Port of Rotterdam. 3.3.1 3.3.2 3.3.3 3.3.4 3.3.5. 4. 5. 6. Brienenoordbrug and Beerenplaat prediction models. 49. 3.5. Summary. 50. Model application ................................................................................................... 52 4.1. Methodology for analysis of residuals. 54. 4.2. Example on synthetic timeseries. 56. Discussion ................................................................................................................ 60 5.1. Gained insight on salt intrusion in the Port of Rotterdam. 61. 5.2. Impact of model assumptions. 62. 5.3. Identifying salinity changes in the Port of Rotterdam. 64. 5.4. Benefits and other applications of model. 65. Conclusion and recommendations ....................................................................... 66. 6.2. hydrologic.com. 45 47 48 48 49. 3.4. 6.1. 7. Parameter selection with multi-step analysis Performance on training dataset Performance on validation dataset Sensitivity analysis Model selection. Conclusion. 66. 6.1.1 Optimization of dataset 6.1.2 Predictive analytical model development 6.1.3 Future application of predictive analytical models. 66 66 67. Recommendations. 68. Bibliography............................................................................................................. 69. Annex A. Discharge Rhine and chloride concentrations ........................................ 72. Annex B. Lekhaven - model parameter coefficients ............................................... 74. Annex C. Spijkenisserbrug - model parameter coefficients .................................. 75. Annex D. Model development Brienenoordbrug .................................................... 76. Annex E. Model development Beerenplaat .............................................................. 79. 2.
(8) Predictive analytical model for chloride concentrations in the Port of Rotterdam. hydrologic.com. 3.
(9) Predictive analytical model for chloride concentrations in the Port of Rotterdam. 1 Introduction. hydrologic.com. image: Haringvlietsluices. https://beeldbank.rws.nl, Rijkswaterstaat / Joop van Houdt. 4.
(10) Predictive analytical model for chloride concentrations in the Port of Rotterdam. 1.1. Background The Port of Rotterdam is Europe’s largest seaport and the New Waterway forms its connection to the North Sea. It is a shipping canal especially designed for sea-going vessels of which yearly over 15.000 pass along to reach the port (Port of Rotterdam, 2016). The New Waterway and adjoining ports are constantly dredged to maintain navigability. In order to handle ships with a draught of up to 15 meters, and to match with international standards, the New Waterway and adjacent Botlek were deepened. The New Waterway is located in the Rhine-Meuse Delta, forming the final terminal of these rivers before they discharge into the North Sea (Figure 1).. Figure 1. Rhine-Meuse Delta and New Waterway in the Netherlands.. A delta or estuary is the transition between a river and a sea (Nguyen, 2008). The salinity of the estuarine water is the result of two opposing fluxes: a saltwater flux, and a freshwater flux. The saltwater flux is driven by the tidal motion of the sea and the freshwater flux is driven by the river that discharges freshwater into the estuary (Savenije, 2012). Chloride concentrations in estuaries are the result of interaction between these two opposing fluxes. Savenije (2012) states both fluxes are strongly dependant on the estuary topography: “.. the salt water flux because the amount of water entering the estuary depends on the surface area of the estuary; and the fresh water flux, because the cross-sectional area of the estuary determines the efficiency of the fresh water flow to push back the salt”. Alterations to the estuary, such as deepening, affect the estuaries topography, which in turn influences the interaction between the saltwater and freshwater fluxes. Water in the estuary of the Rhine-Meuse Delta is widely used. Drinking water companies take in fresh water from these rivers for the production of drinking water. Water quality is regulated by law and for the production of drinking water, the maximum chloride concentration is 150 mg/l (Ministerie van Infrastructuur en Milieu, 2019).. hydrologic.com. 5.
(11) Predictive analytical model for chloride concentrations in the Port of Rotterdam. Similarly, maximum chloride concentrations are determined for industrial and agricultural use and for areas marked as Natura 2000 areas (HydroLogic, 2015a). Interventions are necessary to extend the navigability in the Port of Rotterdam to maintain the global economic position. However, these interventions may have a negative effect on the production of drinking water, agricultural and industrial use of fresh water and on natural habitats. Therefore, studying the effect of human interventions on chloride concentrations is important. For that reason, salinity concentrations have been monitored at several locations in the Rotterdam harbour area, since 2011. At each of these locations the chloride concentration is measured at various depths. Changes of chloride concentrations at these measurement locations could also be an indicator of changes further upstream in the delta. Complex processes in deltas can be approximated with the use of analytical models (van Rijn, 2011 and Xu, et al. 2017). This study focuses on developing an analytical model predicting chloride concentrations at these measurement locations in the Port of Rotterdam.. 1.2. The Rhine-Meuse Delta The study area is part of the complex Rhine-Meuse Delta, consisting of several bifurcations and convergences. Within the system, weirs and dams are constructed to control water levels as to facilitate shipping, but these constructions are also obstructing free flow of river water into the North Sea. In the east of the study area, the Rhine enters the Netherlands at Lobith. It is then called the Upper Rhine. At Pannerdense Kop, the Upper Rhine bifurcates into the Waal and the Pannerden Canal (Figure 2). Further downstream, the Pannerden Canal bifurcates into the IJssel, which flows into the Lake IJssel, and the Lower Rhine. At Hagestein, water is let into the Amsterdam-Rhine Canal. After this bifurcation of the Lower Rhine the river is called the Lek. The southern part of the Rhine delta, the Waal, reaches the New Meuse through the Lower Merwede and Noord. Via the New Merwede it converges with the Meuse. The New Meuse is fed by water from the Lek and Waal. The Old Meuse is fed by water from the Waal and the Meuse. Water from the Meuse and Waal (through the New Merwede) flows into the Old Meuse either through the Dordtsche Kil in the east or through the Spui in the west. The New Meuse and Old Meuse converge into the New Waterway which flows into the North Sea. Water from the Rhine-Meuse Delta may also be discharged through the Haringvliet sluices, located south of the New Waterway. In contrast to the discharge through the New Waterway, discharge through the Haringvliet sluices is controlled.. hydrologic.com. 6.
(12) Predictive analytical model for chloride concentrations in the Port of Rotterdam. Figure 2. Overview of Meuse and Rhine water in the Netherlands, location of discharge measurements and locations of weirs or dams with sluices (Rijkswaterstaat, 2015).. 1.2.1. Salt intrusion dynamics Salt intrusion is a dynamic interaction between two opposing fluxes: a saltwater flux, and a freshwater flux. The saltwater flux, driven by tidal motion, and the freshwater flux, driven by the river discharge, are subjected to many influencing processes outside the estuary. Inside the estuary, the saltwater and freshwater fluxes meet under the influence of several mixing processes (Figure 3). The main factors influencing these fluxes and mixing processes are described below.. Figure 3. Schematics visualization of saltwater flux, freshwater flush and mixing processes in the transition from river to sea.. Saltwater flux The saltwater flux at the mouth of the estuary has two characteristics, volume and salinity (Savenije, 2012). The volume of the flux varies, with constant geometry, with the water level.. hydrologic.com. 7.
(13) Predictive analytical model for chloride concentrations in the Port of Rotterdam. The water level at the mouth of the estuary is the sum of the astronomical tide and the effect of wind. Tide is caused by gravitational interactions in the planetary system and is the main driver of the saltwater flux. At the mouth of the Rhine-Meuse Delta, at Hoek van Holland, the tidal amplitude varies between 1.4 and 2 meters with a period of 12 hours and 25 minutes (Deltares, 2014). The tidal amplitude varies due to the spring/neap cycle (Figure 4), with a period of approximately 14 days.. Figure 4. Astronomical tidal water level fluctuation at Hoek van Holland, showing the spring/neap cycle.. Wind on the surface of the North Sea may either increase or decrease water levels at the mouth of the estuary, generally referred to as wind setup or setdown, depending on the wind direction. The salinity of the saltwater flux at the mouth of the estuary is dependent on the chloride concentration of the North Sea and the inflow of freshwater along the coast. In- and outflow of tide In- and outflow of the tidal wave is caused by the water level difference between the water level at the mouth of the estuary and the water level further upstream in the estuary (Deltares, 2016). The water level at the mouth of the estuary is influenced by the height of the astronomical tide and wind, as explained above. The water level upstream of the estuary is dependent on the discharge volume of the river, and thus the freshwater flux.. Freshwater flux The freshwater flux is driven by the inflow of fresh river water, and similar to the saltwater flux, has two characteristics; volume and salinity. The volume is equal to the discharge. The most downstream discharge measurement locations in the Rhine-Meuse Delta are situated at Tiel, Hagestein and Megen, measuring the discharge of the Waal, Lek and Meuse, respectively (Figure 2). The freshwater flux is also affected by precipitation and evapotranspiration directly at the water surface of the estuary and in the hinterland, downstream of the discharge measurement locations. During times of large precipitation events in the hinterland, water is being discharged via the regional water system into the Rhine-Meuse Delta, through. hydrologic.com. 8.
(14) Predictive analytical model for chloride concentrations in the Port of Rotterdam. various pumping stations. During times of precipitation shortages, mainly during the growth season, water is withdrawn from the Rhine-Meuse Delta for, for example, agricultural usage. Especially during periods of relatively low discharge, this water withdrawal may affect the chloride concentrations in the delta significantly. Due to the multi-channel layout of the Rhine-Meuse Delta, and lack of discharge measurement stations at every channel, exact discharge volumes via each branch are difficult to determine. Water in the system is discharged into the North Sea trough the New Waterway and, dependant on the open sluice area, through the Haringvliet sluices. Discharge through Haringvliet sluices Before deepening of the New Waterway and Botlek in 2018, the opening of the Haringvliet sluices occurred based on the LPH’84 policy. In this policy the sluice opening of the Haringvliet sluices is set based on the discharge of the Rhine at Lobith (Figure 6). During flood, the sluices are closed. During ebb, below a discharge of 1100 m3/s all sluices are closed, between 1100 m3/s and 1700 m3/s the total sluice opening is equal to 25m2, with discharges of the Rhine at Lobith above 1700 m3/s the sluice opening increases with increasing discharge (Deltares, 2016). The actual discharge through the Haringvliet sluices in not measured. However, model simulations have been performed within SOBEK from which a relation between Rhine discharge at Lobith and discharge through the sluices was composed (Figure 5) (Rijkswaterstaat, 2011).. Figure 5. Relation between discharge of Rhine at Lobith and discharge through Haringvliet sluices corresponding with the LPH’84 policy (Rijkswaterstaat, 2011).. On the 15th of November 2018 the ‘Kierbesluit’ was set in motion. This meant the opening of the Haringvliet sluices during high tide (Figure 6), based on the discharge quantity of the Rhine measured at Lobith. This way, saline water from the North Sea can enter the Haringvliet and migratory fish can enter. During ebb, the opening of the sluices is increased as well, in order to discharge the saltwater that entered during high tide back into the North Sea (Deltares, 2017).. hydrologic.com. 9.
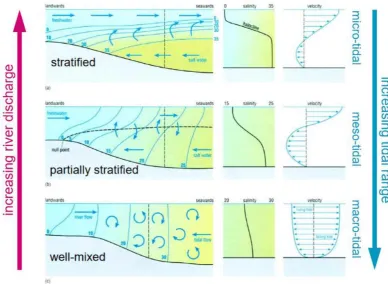
(15) Predictive analytical model for chloride concentrations in the Port of Rotterdam. Figure 6. Opening of Haringvliet sluices based on Rhine discharge at Lobith before 'Kierbesluit' (LPH’84, solid blue) and after 'Kierbesluit' in 2018 (Kier, red) (Deltares, 2017).. The size of the sluice opening with the LPH’84 and Kier policies is very similar below a Rhine discharge of 1500 m3/s at Lobith. Below this limit, the Haringvliet sluices are almost completely closed in order to direct all freshwater discharge through the New Waterway and minimize salinization in the Port of Rotterdam. If a period of low discharge of the Rhine is expected, the Haringvliet is flushed with fresh water during several tidal periods to maintain a fresh Haringvliet as long as possible (Deltares, 2017). Salinity of freshwater flux The freshwater inflow also contains a certain amount of chloride, the background concentration. This chloride concentration is dependent on the volume of discharge (Kranenbrug, et al., 2015).. Mixing processes “There is virtually no limit to the number of mixing processes that can be identified” stated Savenije (2012). However, three main factors were identified which cause mixing and dispersion in an estuary; tidal flow, river flow and wind stresses. Mixing by tidal flow is probably the most important factor (Savenije, 2012) and is dependent on the salt flux. Mixing due to river flow is dependent on the freshwater flux. Mixing due to wind stresses have little influence compared to the other main factors (Savenije, 2012), and is therefore neglected in this research. The saltwater flux, freshwater flux and the mixing processes lead to a certain vertical and horizontal distribution of chloride concentrations in the estuary (Figure 7, left panels, blue lines are isohalines), often referred to as the salt wedge (Savenije, 2012). With increasing river discharge or decreasing tidal range, the vertical salinity gradient increases.. hydrologic.com. 10.
(16) Predictive analytical model for chloride concentrations in the Port of Rotterdam. Figure 7. Schematic representation of water circulation, salinity distribution and velocity gradients in the estuary from stratified (top), through partially stratified or mixed (centre), to well-mixed (bottom) under increasing river discharge and increasing tidal range. The broken horizontal lines in the left panels indicate the positions of the salinity distributions and the velocity profiles (adapted from: Open University. Oceanography Course Team, 1999).. 1.2.2. Chloride concentration measurement locations In order to monitor salt intrusion in the Rhine-Meuse Delta, chloride concentrations are being monitored at several locations within the system. Measurement locations Lekhaven and Brienenoordbrug (Figure 8), are situated in the New Meuse on the north side of the study area. At the southern part of the Port of Rotterdam, in the Old Meuse, measurement locations Spijkenisserbrug and Beerenplaat are situated. Under normal river discharges of the Rhine and Meuse, daily fluctuations in chloride concentrations are measured at Lekhaven and Spijkenisserbrug (Annex A). During dry periods, with decreased river discharges, increased chloride concentrations are measured at Brienenoordbrug and Beerenplaat.. hydrologic.com. 11.
(17) Predictive analytical model for chloride concentrations in the Port of Rotterdam. Figure 8. Locations of chloride measurement stations in the New Meuse and Old Meuse.. At Spijkenisserbrug and Lekhaven chloride concentrations are measured at three different depths. At Brienenoordbrug, chloride concentrations are measured at two depths and at Beerenplaat at one depth (Table 1). Table 1. Measuring depths of chloride concentrations at each of the four measurement locations.. Measurement location Lekhaven Spijkenisserbrug Brienenoordbrug Beerenplaat. 1.3. Measuring depth [m NAP] -2.5, -5.0, -7.0 -2.5, -4.5, -9.0 -2.5, -6.5 -2.0. Effects of deepening No research has been performed on the effects of deepening on chloride concentrations at a specific location in an estuary. The intrusion length of the salt wedge, which can be used as indication of chloride concentrations at a specific location, has been widely examined with the use of analytical models (van den Burgh, 1972; Savenije, 1993; Nguyen, 2008). Cai et al. (2012) derived a tidally averaged analytical model based on Savenije et al. (2008) for the effects of river discharge and channel deepening on the tidal amplitude and tidal wave travel time in the riverine Modaomen Estuary in China. It proved to be efficient and effective. With the use of this model, effects of dredging were calculated under constant discharges. Deepening of an estuary by dredging, increased the tidal wave propagation which in turn lead to increased chloride concentrations, and decreased the tidal wave travel time.. hydrologic.com. 12.
(18) Predictive analytical model for chloride concentrations in the Port of Rotterdam. Alterations to the Rhine-Meuse Delta, such as deepening of the New Waterway, change the morphological characteristics of the delta, potentially causing changes in the intrusion length of the salt flux. Increased chloride concentrations at the measurement locations in the Old Meuse and New Meuse may be an indicator of changes in chloride concentrations further upstream where fresh river water is used for drinking water production, agricultural and industrial processes and Natura 2000 areas are present. During relatively dry periods, in which the discharge of the Rhine at Lobith is below 1500 m3/s, discharge distributions in the Rhine-Meuse Delta are assumed to be stable due to the closing of the Haringvliet sluices. During these dry periods, at high tide saltwater intrudes up to all four chloride concentration measurements stations. Changes in morphology due to deepening of the New Waterway and the effects on chloride concentrations are especially of interest during these dry periods. Previous research has disregarded the effect of tides and wind setup above 0.15 meter, deepening of the New Waterway and adjacent Botlek potentially affected the influence of these processes on chloride concentrations in the Port of Rotterdam. During its most recent deepening, the New Waterway was deepened by approximately 1.5 meter along its entire length to facilitate accessibility of ships with a draught of up to 15 meters (Port of Rotterdam, 2016). The dredging works for this deepening started in March 2018 and were finished at the end of 2018. Prior to the start of the dredging project, Svašek Hydraulics performed a model analysis on the potential effects of this deepening on the salinity concentrations in the Rotterdam harbour area (Svasek Hydraulics, 2015). From this work, HydroLogic deduced a synthetic dataset of chloride concentrations after deepening. These synthetic data for the situation after deepening were compared to the measured chloride concentrations prior to the deepening. With a z-score test for analysing different statistical means (Blaas & van den Boogaard, 2006), HydroLogic concluded that at the location Lekhaven a significant difference in chloride concentrations was to be expected due to the deepening (z = 6.1). A significant difference in chloride concentrations at Spijkenisserbrug could not be proven with this analysis (z = 1.25). Within this analysis, day-averaged data was used and this analysis was restricted to situations in which the discharge of the Rhine at Lobith was below 1500 m3/s. Situations at which the recorded wind setup at Hoek van Holland were above 0.15 meter were disregarded as well (HydroLogic, 2015a). By using day-averaged data the correlation with discharges were optimized but effects of the tidal variations were disregarded.. 1.4. Objective and research questions Currently it is unknown how deepening of the New Waterway and Botlek has affected chloride concentrations in the Port of Rotterdam and further upstream. Model simulations show that chloride concentrations are expected to increase due to deepening of the New Waterway and Botlek. However, these expectations are not validated with measurements of chloride concentrations post-deepening. The use of an analytical model, developed with the use of measurements, can provide this validation. The salt intrusion process is mostly determined by the independent boundary conditions of the system: river discharge, intruding tidal wave and wind setup. This research intends to. hydrologic.com. 13.
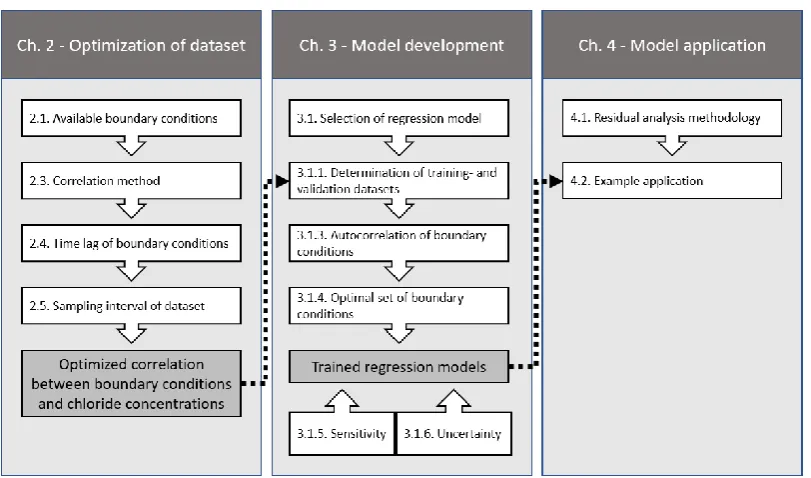
(19) Predictive analytical model for chloride concentrations in the Port of Rotterdam. use these parameters to build improved analytical models for the chloride concentration at each of the four measurement locations in the Port of Rotterdam. By comparing these new analytical models with measurement data collected post human interventions, the effect of human alterations in the Rhine-Meuse delta on chloride concentrations in the Port of Rotterdam can be assessed. As the construction of the Maasvlakte 2 potentially had an influence on the relation between the salt intrusion processes due to geometrical change of the mouth of the New Waterway (Blaas & van den Boogaard, 2006), the period after completion of the Maasvlakte 2 in 2011, to present is examined. The research objective is stated as follows: How can measurement of hydrodynamic conditions best be used in an analytical model for predicting chloride concentrations in the Port of Rotterdam, and how can this model be applied for analysing effects of human interventions in the Rhine-Meuse delta?. 1.5. 1.. How do monitored boundary conditions relate to chloride concentrations in the Rhine-Meuse basin and how can these data best be used as an input for the analytical model?. 2.. What relation between salinity, at each of the four measurement locations, and the boundary conditions can be composed from measurement data obtained before deepening of the New Waterway and Botlek?. 3.. How can effects of human interventions on chloride concentrations in the Port of Rotterdam be analysed by application of the analytical model?. Research approach and reading guide To answer each of the research questions an overview of the research approach is provided in Figure 9. Chapter 2 answers the first research question in which the correlation between boundary conditions and chloride concentrations is optimized in four steps. Firstly, the availability of measurement data is elaborated on. Secondly, the most optimal correlation method is determined in order to correctly relate boundary conditions to chloride concentrations. This is done by visual interpretation of scatter diagrams of the boundary conditions in relation to chloride concentrations and of the distributions of the boundary conditions. Thirdly, measurements of the boundary conditions are performed up- or downstream of the chloride concentration measurement locations. Measurements at one location take time to propagate to and affect parameters at another location, a time lag. The time lag of the boundary conditions is determined by calculating the correlation coefficient between each boundary condition and the chloride concentrations at various time shifts of the boundary conditions. With the use of the time lag analysis, multiple time series can be aligned to optimize correlation. Finally, the sampling interval of the dataset is optimized. Within this optimization, the effect of three sampling intervals on the correlation coefficients between the boundary conditions and chloride concentrations is analysed. From this analysis, the sampling interval with the highest correlation coefficients is selected. In Chapter 3 the analytical models are developed. Firstly, the applied models in this study and corresponding optimization techniques is elaborated on. Secondly, the training- and. hydrologic.com. 14.
(20) Predictive analytical model for chloride concentrations in the Port of Rotterdam. validation datasets are determined from the optimized dataset obtained in Chapter 2. Thirdly, in order to describe the ‘memory’ that exists in the system an autocorrelation analysis is performed on the boundary conditions. From this analysis new parameters are determined. Fourthly, the optimal set of boundary conditions in relation to observed chloride concentrations is determined by evaluating the added value of each parameter. The result are trained analytical models for each of the four measurement locations, which are evaluated with a sensitivity analysis and an uncertainty analysis. The sensitivity analysis provides insights into the importance of the boundary conditions in relation to chloride concentrations at each of the four measurement locations. The uncertainty analysis, performed for Lekhaven, is applied to analyse the effect of uncertainty in the discharge on chloride concentrations. Chapter 4 contains a methodology for analysis of model residuals followed by an example analysis with the use of a synthetical dataset. Chapter 5 contains the discussion of the applied methodology and outcomes. Finally, the conclusions and recommendations are provided in Chapter 6.. Figure 9. Flow chart of research approach.. hydrologic.com. 15.
(21) Predictive analytical model for chloride concentrations in the Port of Rotterdam. 2 Optimization of dataset. image: Spijkenisserbrug, https://beeldbank.rws.nl, Rijkswaterstaat / Harry van Reeken. hydrologic.com. 16.
(22) Predictive analytical model for chloride concentrations in the Port of Rotterdam. Optimization of the dataset is performed with the use of the correlation between the boundary conditions and chloride concentration measurements. The optimization consists of four parts. First, the availability of each factor affecting the salt- and freshwater flux is described. Second, the correlation method is determined by examining the type of relation between individual boundary conditions and chloride measurements. Third, the time lag of boundary conditions relative to the chloride concentration measurement, due to data monitoring at different distant locations, is optimized. Finally, the optimal sampling interval is determined by examining several time intervals for analysis.. 2.1. Available measurements Not all processes are continuously measured in the Rhine-Meuse Delta from 2011 to present. Therefore, not all processes described in Section 1.2.1. can be included in the analysis. Regarding the saltwater flux and the freshwater flux, each available parameter is briefly described. Finally, the available dataset on chloride concentrations is described.. Processes affecting the saltwater flux At Hoek van Holland, the water level is measured at a 10-minute interval. This water level measurement can be translated in two components; the astronomical tide, which is predicted based on interactions between the planetary movements, and the wind setup, by subtracting the astronomical tide from the observed water level. The chloride concentration of the incoming seawater is mostly constant over time and is not included in this study.. Processes affecting the freshwater flux The main inflow of freshwater is measured at a 10-minute interval by the measurement stations at Tiel, Hagestein and Megen, measuring the discharge of the Waal, Lek and Meuse, respectively. By examining observations in which the Haringvliet sluices are (almost) completely closed, corresponding to a discharge of the Rhine of 1500 m3/s at Lobith, variation in discharge distribution through the lower branches of the Rhine-Meuse Delta is assumed to be constant. Lateral inflow or outflow by pumping stations connecting the Rhine-Meuse delta with the surrounding hinterland is not continuously measured and is therefore disregarded.. Chloride concentration measurements As mentioned in Section 1.2.2., chloride concentrations are measured at several depths, except for Beerenplaat. Nguyen (2008) classified the New Waterway as a partially mixed estuary, where chloride concentrations gradually vary in the horizontal and vertical direction. At Lekhaven the shape of the salt wedge is very similar under various discharge conditions during low tide (Figure 10, top panels). During high tide and with increasing discharge, the vertical variation of chloride concentration decreases, by which the estuary can be classified as well-mixed. At Lekhaven, the estuary can be classified as partially mixed or well-mixed, slight variations are observed based on the quantity of discharge. Similarly, at Spijkenisserbrug the vertical variation in chloride concentrations retains a similar shape. hydrologic.com. 17.
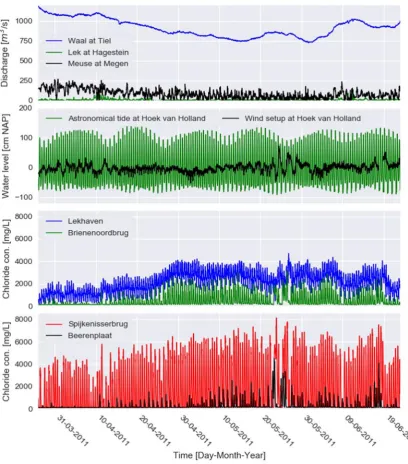
(23) Predictive analytical model for chloride concentrations in the Port of Rotterdam. under various discharge volumes (Figure 10, bottom panels). Due to the presence of little vertical variation in concentration, a depth-averaged chloride concentration is determined, in order to obtain a single time-dependant observation. This is applied to each chloride concentration measurement location.. Figure 10. Shape of the salt wedge at Lekhaven (top panels) and Spijkenisserbrug (bottom panels), for three different discharge conditions of the Rhine measured at Lobith, indicated with the chloride concentration at various depths.. 2.2. Analysis period During droughts, in which the discharge of the Rhine at Lobith is below 1500 m 3/s, salinization occurs at each of the four measurement locations. Determination of the time lag, which describes the propagation time of the boundary conditions to each of the measurement locations, is performed on a long period of drought in the spring of 2011. This period is selected because of the absence of long-lasting extreme wind setup events, resulting in a ‘clean’ signal for correlation with tide and discharge. During this period of drought from 27th of March 2011 until 23rd of June 2011 (Figure 11), discharge of the Waal varied from 740 m3/s to 1250 m3/s and discharge of the Lek varied from 0 m3/s to 110 m3/s. Discharge of the Meuse varied from 19 m3/s to 260 m3/s. In this period substantial wind setup (>80 cm) only occurs for short time around the 24th of May 2011. Chloride concentrations at Lekhaven did not return to the background concentration of the Rhine (80-130 mg/l), indicating constant salinization at this measurement location. At the other measurement locations, the chloride concentrations did return to Rhine background concentrations, indicating the river discharge was able to flush out the intruded salt wedge.. hydrologic.com. 18.
(24) Predictive analytical model for chloride concentrations in the Port of Rotterdam. Figure 11. Overview of boundary conditions and chloride concentration measurements from 27-03-2011 until 23-06-2011.. 2.3. Correlation method Assessing correlations between water quality parameters, such as chloride concentration, and hydrodynamic processes, is a common practice in the field of hydrology (Shrestha & Kazama, 2007). Widely used correlation coefficients are the Pearson coefficient and Spearman R coefficient. The Pearson coefficient is best applied to parameters that have a normal distribution and show a linear relation between parameters. Spearman R coefficient can also handle non-normal distributed parameters and non-linear relations between parameters. Spearman R coefficient is similar to Pearson correlation, except that it is computed from ranked data (Alberto, et al., 2002). The most basic determination of a suitable correlation method is with the use of a scatter diagram, a scatter plot of the variables. If a clear linear relation is visually detectable, the. hydrologic.com. 19.
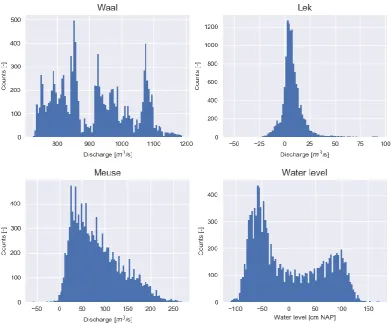
(25) Predictive analytical model for chloride concentrations in the Port of Rotterdam. Pearson correlation coefficient is applicable. If a clear non-linear relation is detectable or a linear relation cannot be observed the Spearman correlation method can be applied. In this study, determination of suitable correlation methods is performed based on a visual interpretation of a scatter plot of the individual boundary conditions and chloride measurements during the analysis period (Figure 12).. Figure 12. Scatter diagram of boundary conditions with chloride measurement locations in the analysis period from 27th of March 2011 until 23rd of June 2011.. No clear relations can be observed from the scatter diagrams in Figure 12, correlating the chloride concentrations with the boundary conditions for all measurement locations and boundary conditions simultaneously. Therefore, the distribution of each parameter is examined individually. All boundary conditions show a clear non-normal distribution (Figure 13). As the Spearman R-coefficient is capable of assessing correlation between nonnormally distributed parameters, it is applied for all further analysis.. hydrologic.com. 20.
(26) Predictive analytical model for chloride concentrations in the Port of Rotterdam. Figure 13. Distribution of boundary conditions in the analysis period from 27th of March 2011 until 23rd of June 2011. As non-normal distributions are observed, Spearman R-coefficient is applied for further analysis.. 2.4. Time lag of boundary conditions In time series analysis with a spatial orientation, observations of influencing processes at one location take time to propagate to and affect parameters at another location: a time lag. Discharges measured at Hagestein, Lek and Megen have a certain travel time before they reach the chloride measurement locations at the Port of Rotterdam. Equally, the intruding tide, measured as a water level at the mouth of the river, takes time to reach the measurement locations. With the use of time lag analysis, multiple time series can be aligned to optimize Spearman correlation. Common practice for analysing time lags of correlated variables is with a Spearman cross correlation function (CCF).. 2.4.1. Water level Correlation of the water level, measured at Hoek van Holland (HvH), and chloride concentrations at each of the four measurement locations all show a similar pattern of a sinusoidal wave when varying the time lag of the water level (Figure 14). During the spring of 2011, the highest correlation coefficients are observed at Spijkenisserbrug, in the Old Meuse, at a time lag of 190 min. Further upstream on the Old Meuse, at Beerenplaat, 90 minutes later, at a time lag of 280 min the highest correlation is found between water level at HvH and chloride concentrations at this measurement location. In the New Meuse, effects. hydrologic.com. 21.
(27) Predictive analytical model for chloride concentrations in the Port of Rotterdam. of the intruding tide reach Lekhaven first at a time lag of 110 min, and further upstream at Brienenoordbrug at 200 min.. Figure 14. Spearman cross correlation function diagram of water level at Hoek van Holland and chloride concentrations at measurement locations during analysis period from 27th of March 2011 until 23rd of June 2011.. 2.4.2. Discharge Discharge through the port of Rotterdam mostly consists of discharge from the Waal, followed by Meuse discharge and Lek discharge (Section 2.2). Firstly, the time lag of Waal discharge with each of the four measurement locations is determined with a Spearman cross-correlation function (CCF). Secondly, the time lag of Meuse discharge is, simultaneously with discharge of the Waal, determined with the use of a two-dimensional CCF. Finally, with a similar methodology, the time lag of Lek discharge is determined. In order to determine time lags of discharges, a 24-hour average of the chloride concentrations, as well as the discharge, are computed. This averaging is performed after the application of each time shift.. Waal discharge The optimum correlation between Waal discharge, measured at Tiel, and chloride concentrations at Brienenoordbrug, is found at a time lag of 780 minutes. Further downstream, at Lekhaven, an optimal time lag of 1170 minutes is observed (Figure 15). Regarding the measurement location Beerenplaat, an optimum time lag is observed at 1200 minutes. Further downstream, at Spijkenisserbrug, the optimum is observed at 1070 minutes. The time lags on the Old Meuse, at Beerenplaat and Spijkenisserbrug, are unexpected, as one would expect the discharge of the Waal to reach Beerenplaat first, followed by Spijkenisserbrug sometime later. This might be caused by the relatively low correlation of both locations with Waal discharge, compared to locations on the New Meuse (Figure 15).. hydrologic.com. 22.
(28) Predictive analytical model for chloride concentrations in the Port of Rotterdam. Figure 15. Spearman cross correlation function (CCF) of Waal discharge measured at Tiel and the chloride concentration measurement locations using Spearman correlation, during analysis period from 27th of March 2011 until 23rd of June 2011.. Addition of Meuse discharge By varying the time lags for both the Waal and the Meuse discharge, a two-dimensional Spearman cross correlation function is created. With this two-dimensional CCF the optimum time lag, at which the maximum correlation exists between discharges of the Waal and the Meuse and the chloride concentrations at the measurement locations, can be determined. The optimum for Spijkenisserbrug, with a correlation coefficient of -0.771, is observed with a Waal time lag of 1250 min and a Meuse time lag of 1650 min (Figure 16, left panel). However, an optimum range can be observed in which the correlation coefficient does not differ much from the maximum value, indicated in black and blue shades. Similarly, an optimal range is observed at measurement location Beerenplaat (Figure 16, right panel). As the highest correlation between discharge and chloride concentration is observed at Spijkenisserbrug (Table 2), this observed optimum is assumed to be most representative for the time lag. From a physical perspective, discharge from the Waal and Meuse will reach the more upstream measurement location Beerenplaat first, before reaching Spijkenisserbrug. As the distance between Beerenplaat and Spijkenisserbrug is around 10 percent of the total distance from the measurement location of Waal discharge, at Tiel, to Beerenplaat. Based on this, the time lag of the Waal and Meuse for Beerenplaat are estimated to be 1100 min and 1500 min, respectively. These estimated time lags are within the optimum range of Beerenplaat (Figure 16, right panel, indicated in blue/black). Figure 16. Correlation heatmaps of time lag between discharges of the Waal and Meuse and salinity at measurement locations Spijkenisserbrug (left) and Beerenplaat (right), both situated on the Old Meuse.. hydrologic.com. 23.
(29) Predictive analytical model for chloride concentrations in the Port of Rotterdam. Optimum at Spijkenisserbrug indicated with white star. Estimated time lags at Beerenplaat indicated with yellow star.. Similarly to the time lag determination on the Old Meuse, time lag determination of the measurement locations on de the New Meuse is guided by the most downstream measurement location, Lekhaven. At Lekhaven an optimum is found for a Waal time lag of 1150 min and Meuse time lag of 1900 min (Figure 17). Again, based on distance of measurement locations, the time lags at Brienenoordbrug are estimated at 1000 min regarding the Waal and 1750 min regarding the Meuse.. Figure 17. Correlation heatmaps of time lag between discharges of the Waal and Meuse and chloride concentrations at measurement locations Lekhaven (left) and Brienenoordbrug (right), both situated on the New Meuse. Optimum at Lekhaven indicated with white star. Estimated time lags at Brienenoordbrug indicated with yellow star.. The addition of Meuse discharge improves the correlation compared to an analysis based on just the Waal discharge, especially at the measurement locations on the Old Meuse: Spijkenisserbrug and Beerenplaat (Table 2). This is to be expected based on discharge distribution as mentioned in Section 1.3.1. At Lekhaven, no change in correlation is observed, and at Brienenoordbrug only a small change occurs due to the addition of the Meuse.. Addition of Lek discharge Similarly to the addition of the Meuse, discharge of the Lek is added to the Waal discharge. At Spijkenisserbrug (Figure 18, left panel) a wide range of time lags for both the Waal, indicated with a wide spread in the x-direction, as well as the Lek, indicated with a wide spread in the y-direction, is observed. The optimal correlation is found at a Waal time lag of 1200 min and a Lek time lag of 1750. The corresponding Spearman R-coefficient is -0.730. At Beerenplaat (Figure 18, right panel) no clear range of Lek discharge can be observed. For the Waal the correlation is optimal for time lags below 1500 min. Again, the time lag of the Waal and Lek at Beerenplaat is estimated based on the distance between measurement locations (Table 2).. hydrologic.com. 24.
(30) Predictive analytical model for chloride concentrations in the Port of Rotterdam. Figure 18. Correlation heatmaps of time lag between discharges of the Waal and Lek and chloride concentrations at measurement locations Spijkenisserbrug (left) and Beerenplaat (right), both situated on the Old Meuse. Optimum at Spijkenisserbrug indicated with white star. Estimated time lags at Beerenplaat indicated with yellow star.. At Lekhaven (Figure 19, left panel) as well as at Brienenoordbrug (Figure 19, right panel) again a wide range of time lags of the Lek can be observed, possibly caused by the low discharge during the analysis period. The time lag of the Waal at Lekhaven is optimal at 1150 min and of the Lek at 900 min. The time lags of the Waal and Lek at Brienenoordbrug are again estimated based on the distance between measurement locations.. Figure 19. Correlation heatmaps of time lag between discharges of the Waal and Lek and chloride concentrations at measurement locations Lekhaven (left) and Brienenoordbrug (right), both situated on the New Meuse. Optimum at Lekhaven indicated with white star. Estimated time lags at Brienenoordbrug indicated with yellow star.. At none of the measurement locations the addition of Lek discharge improves the Spearman R-coefficient compared to an analysis only including the Waal discharge (Table 2). Contrary, at all locations the correlation between discharge and chloride concentrations decrease. The observed and estimated time lag of the Waal discharge is similar to the time lag when only considering the Waal or when considering the Waal with addition of the Meuse (Table 2).. hydrologic.com. 25.
(31) Predictive analytical model for chloride concentrations in the Port of Rotterdam. Table 2. Spearman R-coefficients (Corr.) and time lags for Waal discharge and for Waal discharge with the addition of Meuse and Lek discharge, at each of the four measurement locations.. Measurement location: Old Meuse Spijkenisserbrug Beerenplaat New Meuse Lekhaven Brienenoordbrug. 2.5. Waal discharge Corr. Time lag [-] [min]. Waal and Meuse Corr. [-] Time lag [min] Waal Meuse. Waal and Lek Corr. [-] Time lag [min] Waal Lek. -0.736 -0.660. 1070 1200. -0.771 -0.708. 1250 1100. 1650 1500. -0.730 -0.651. 1250 1100. 1750 1600. -0.820 -0.796. 1170 780. -0.820 -0.805. 1150 1000. 1900 1750. -0.815 -0.784. 1150 1000. 900 750. Sampling interval Previous research used 24-hour averaged values for the determination of the Rhine discharge time lag (HydroLogic, 2015a). In section 2.4.2 again 24-hour averaged values were used to determine correlations between Waal, Meuse and Lek discharges in relation to chloride concentrations. For the determination of time lags of the astronomical tide in relation to chloride concentration measurements, in Section 2.4.1., the original data interval of 10 minutes was applied. Considering the most appropriate averaging interval, it needs to be considered that in order to incorporate tides, wind and discharges into a single analysis, the sampling interval may not exceed the duration of half a tidal cycle, as this will cause information loss from the tidal signal. Three time intervals are examined, the original 10-minute interval of the data, an hourly average and data sampling based on half a tidal cycle. The tidal sampling is based on peaks and troughs in the tide signal (Figure 20). The cycle is split in two parts, from low water level to high, the incoming tidal wave, and from high to low water, the outgoing tidal wave. During the incoming tidal wave (or flood), the minimum chloride concentration and minimum water level and tidal water lever are selected. An average over half a cycle is taken of the discharge and wind setup during the flood period. During the outgoing tidal wave (or ebb), the maximum chloride concentration and maximum water level and tidal water level are taken. Again, the average is taken of the discharge and wind setup during the ebb period. The Spearman correlation method and time lags determined in previous sections are used.. Figure 20. Applied sampling for tidal sampling technique based on the peaks and throughs in the astronomical tide signal.. hydrologic.com. 26.
(32) Predictive analytical model for chloride concentrations in the Port of Rotterdam. Compared to the correlation of the 10 min data, an hourly average of water level measured at Hoek van Holland shows a slight improvement in correlation coefficient between the water level and chloride concentrations (Table 3). Applying the tidal sampling technique further improves the correlation between chloride concentrations and water level measurements for all measurement locations except Spijkenisserbrug. Regarding Spijkenisserbrug, a slight decrease of the Spearman R coefficient is observed. Wind setup and astronomical tidal water level show a similar pattern (Table 4 and Table 5). By taking an hourly average, the Spearman R-coefficient slightly increases, and by applying tidal sampling the coefficient further increases, except for Spijkenisserbrug. Table 3. Spearman R correlation coefficients between water level, measured at Hoek van Holland, and chloride concentrations at each of the four measurement locations for three sampling intervals.. Measurement location. 10 min (original data). 1 hour. Tidal sampling. Brienenoordbrug Lekhaven Spijkenisserbrug Beerenplaat. 0.6924 0.3835 0.8674 0.3900. 0.7027 0.3885 0.8796 0.4075. 0.8005 0.4933 0.8456 0.6523. Table 4. Spearman R correlation coefficients between wind setup, derived from water level measured at Hoek van Holland, and chloride concentrations at each of the four measurement locations for three sampling intervals.. Measurement location. 10 min (original data). 1 hour. Tidal sampling. Brienenoordbrug Lekhaven Spijkenisserbrug Beerenplaat. 0.1074 - 0.0049 0.0933 0.1528. 0.1019 - 0.0003 0.0908 0.1554. 0.1243 0.0401 0.1813 0.1748. Table 5. Spearman R correlation coefficients between astronomical tide determined at Hoek van Holland and chloride concentrations at each of the four measurement locations for three sampling intervals.. Measurement location. 10 min (original data). 1 hour. Tidal sampling. Brienenoordbrug Lekhaven Spijkenisserbrug Beerenplaat. 0.6555 0.3792 0.8333 0.3619. 0.6665 0.3840 0.8472 0.3772. 0.7690 0.4929 0.8011 0.5946. Correlating hourly averages of the discharge has no influence on the Spearman R coefficient (Table 6, Table 7 and Table 8) compared to the correlation coefficients of the 10 minute data. When applying the tidal sampling on Waal, Waal + Lek and Waal + Meuse the correlation decreases, except for a minor improvement at Spijkenisserbrug. Table 6. Spearman R correlation coefficients between Waal discharge measured at Tiel and chloride concentrations at each of the four measurement locations for three sampling intervals.. Measurement location. 10 min (original data). 1 hour. Tidal sampling. Brienenoordbrug Lekhaven Spijkenisserbrug Beerenplaat. - 0.5483 - 0.7185 - 0.3130 - 0.6686. - 0.5479 - 0.7309 - 0.3034 - 0.6640. - 0.4247 - 0.7628 - 0.3524 - 0.5450. Table 7. Results of correlations for three sampling intervals regarding Waal and Lek discharge.. Measurement location. hydrologic.com. 10 min (original data). 1 hour. Tidal sampling. 27.
(33) Predictive analytical model for chloride concentrations in the Port of Rotterdam. Brienenoordbrug Lekhaven. - 0.5261 - 0.6983. - 0.5260 - 0.7105. - 0.4214 - 0.7669. Table 8. Results of correlations for three sampling intervals regarding Waal and Meuse discharge.. Measurement location. 10 min (original data). 1 hour. Tidal sampling. Spijkenisserbrug Beerenplaat. - 0.3125 - 0.6551. - 0.3029 - 0.6523. - 0.3525 - 0.5325. Although correlations between discharges and chloride concentrations generally decrease with tidal sampling, the correlations of all other parameters show a greater increase. Therefore, tidal sampling is applied for further analysis.. 2.6. Summary Due to the non-normal distributed hydrodynamic input parameters (Figure 13), correlations with chloride concentrations at each of the four measurement locations is best described with the Spearman R coefficient. From the time lag analysis, the propagation time of hydrodynamic boundary conditions water level and discharge are determined (Table 9). As the effect of wind setup depends on the intruding or outgoing tidal wave (Section 1.2.1), the time lags of wind setup regarding each measurement locations are assumed equal to the time lags regarding tide. The sampling interval analysis shows that applying a tidal sampling interval provides the best correlations for chloride concentrations and water level, astronomical tide and wind setup at each measurement location. Although the tidal sampling interval causes a decrease in correlation coefficient of discharge of the Waal, Lek and Meuse with the chloride concentrations within this study area, this decrease is less significant. Therefore, for further analysis tidal sampling is applied. Table 9. Time lags of tide and Waal, Meuse and Lek discharges regarding each of the four measurement locations.. Old Meuse Spijkenisserbrug Beerenplaat New Meuse Lekhaven Brienenoordbrug. hydrologic.com. Tide. Waal. Meuse. Lek. 190 min 280 min. 1250 min 1100 min. 1650 min 1500 min. 1750 min 1600 min. 110 min 200 min. 1150 min 1000 min. 1900 min 1750 min. 900 min 750 min. 28.
(34) Predictive analytical model for chloride concentrations in the Port of Rotterdam. hydrologic.com. 29.
(35) Predictive analytical model for chloride concentrations in the Port of Rotterdam. 3 Chlorinity predictor model development. image: Weirs in the Lek at Hagestein, https://beeldbank.rws.nl, Rijkswaterstaat , Ruimte voor de Rivier hydrologic.com. 30.
(36) Predictive analytical model for chloride concentrations in the Port of Rotterdam. 3.1. Regression model building and validation methodology Development of a chlorinity predictor is performed by a regression analysis. A linear and a non-linear model are created based on a limited dataset prior to deepening, the training set. The residuals of the model predictions for the training are examined. Validation of the model is performed with a different dataset of measurements under similar conditions prior to deepening, the validation dataset. Regression analysis is performed with the open source machine learning library Scikit-Learn in Python (Pedregosa, et al., 2011). Two models are selected for this regression analysis, a linear model and a non-linear model. The linear regression model makes use of an ordinary least squares (OLS) optimization. The non-linear model consists of a linear model, but uses polynomial input features created from the selected parameters. The non-linear model uses a technique of least absolute shrinkage and selection operator (Lasso) which performs both variable selection and regularization in order to enhance the accuracy and prevent overfitting. In order to reduce the number of parameters in the regression an extended Lasso-model with cross-validation is applied (LassoCV). The addition of cross-validation reduces overestimation of the model (Chetverikov & Liao, 2016). In further analyses both models are run simultaneously. The linear OLS model is more simplistic and uses fewer parameters compared to the non-linear LassoCV model, which is potentially more accurate. Performance of the linear and non-linear model is tested with the use of the coefficient of determination, the r-squared (Eq. 1). The coefficient of determination is the proportion of the variance in the dependant variable, the chloride concentration in this study, that is predicted by the independent variables, the boundary condition parameters. The r-squared value varies between 0 (no predictive value) and 1 (perfect prediction). ∑𝑖 (𝑦̂𝑖 − 𝑦̅)2 (Eq. 1) 𝑅2 = ∑𝑖 (𝑦𝑖 − 𝑦̅)2 where 𝑦̂𝑖 is the prediction value of 𝑦 for observation 𝑖, 𝑦̅ is the mean of 𝑦 and 𝑦𝑖 is the 𝑦 value for observation 𝑖. The error of the model is indicated with the root-mean squared error (RMSE). The RMSE (Eq. 2) is the standard deviation of the residuals (Barnston, 1992). The RMSE is used to indicate the spread of the residuals around the line of best fit, and has the unit of the dependant prediction variable, thus in mg/L. 𝑛. 1 𝑅𝑀𝑆𝐸 = √ ∑(𝑦𝑖 − 𝑦̂𝑖 )2 𝑛. (Eq. 2). 𝑖=1. where 𝑛 is the number of observations. The derivation of the model consists of several steps. First, the input parameters are normalized, with the use of scaling, in order to be able to compare coefficients of the various parameters. The influence of parameters, such as discharge or wind setup, might not be linear in relation to observed chloride concentrations. Non-linear weighting is applied to several parameters based on physical relationships for each relevant process. Second, the training and validation datasets are elaborated on. Third, based on autocorrelation analysis of the input parameters, new parameters are derived with the goal of incorporating the ‘memory’ of the system. Fourth, the multi-step analysis is explained to determine the most. hydrologic.com. 31.
(37) Predictive analytical model for chloride concentrations in the Port of Rotterdam. suitable parameters for describing the chloride concentrations at each of the four measurement locations. Finally, effect uncertainty in the input boundary conditions on predicted chloride concentrations is examined.. 3.1.1. Training and validation datasets Validation of both regression models is performed according to the hold-out method (Devroye & Wagner, 1979). In the hold-out method part of the dataset is not used for model training, but for model validation. This fundamental model validation method is best applied when particular sequences within datasets are used for either training or validation (Arlot & Celisse, 2010). The training dataset consists of three long periods of Rhine discharge at Lobith below 1500 m3/s (Figure 21, indicated in green). The training set consists of data measurements gathered throughout all four seasons (Table 10). The validation data set consists of all data points prior to the deepening in 2018, below a Rhine discharge at Lobith of 1500 m3/s, excluding the training dataset (Figure 21, indicated in black). Similarly, to the training dataset, the validation data set contains datapoints throughout all seasons.. Figure 21. Discharge of Rhine at Lobith from 2011 until start of 2019. The training dataset is indicated in green, the validation dataset consists of all data points prior to the deepening started in March 2018 and below a discharge of the Rhine at Lobith of 1500 m3/s (indicated in black). Table 10. Distribution of training and validation datapoints by season.. 3.1.2. Season. Number of datapoints Training set Validation set. Spring Summer Autumn Winter. 254 274 313 252. 296 544 894 123. Total:. 1093. 1857. Parameter normalization and non-linear weighting Normalization of boundary condition parameters is applied to compare the influence of each boundary condition on chloride concentrations individually. This is done by analysing the coefficients the linear or non-linear model assigns to each individual parameter. The boundary conditions are therefore normalized to a range between 0 and 1. Except for wind setup, which is normalized between -0.5 and 0.5 since negative values have an opposite effect. The values corresponding with the normalized -0.5 and 0.5 or 0 and 1 are provided. hydrologic.com. 32.
(38) Predictive analytical model for chloride concentrations in the Port of Rotterdam. in Table 11 for each parameter. Astronomical tide is normalized such that the original mean value of 0.30 m NAP corresponds with the normalized value of 0.5. Similarly, wind setup is normalized such that the normalized value 0, corresponds with no wind setup. The corresponding original values (Table 11) correspond with the minimum and maximum values is the combined training and validation dataset. Table 11. Criteria for normalization of input parameters.. Parameter. Normalized minimum value. Corresponding original value. Normalized maximum value. Corresponding original value. Astronomical tide Discharge Waal Wind setup Discharge Meuse Discharge Lek. 0 0 -0.5 0 0. -100 [cm NAP] 0 [m3/s] -121 [cm] 0 [m3/s] 0 [m3/s]. 1 1 0.5 1 1. 160 [cm NAP] 1500 [m3/s] 121 [cm] 522 [m3/s] 175 [m3/s]. Wind setup not only affects the height of the tidal wave, it can also be applied as indicator of mixing processes inside the estuary, as mentioned in Section 1.2.1. Also, in situations with extreme wind setup, no water level difference is present between the mouth of the estuary and further upstream in the estuary, preventing the tidal wave from extruding (Deltares, 2016). Therefore, a non-linear weighting is applied on to the normalized value of the wind setup parameter. Similarly, the incoming tide affects not only the amount of saline water intruding in the estuary, it also affects mixing processes. Therefore, also a non-linear weighting is applied to the astronomical tide. Squaring of the normalized parameter, which is performed by default when compiling polynomial features, gives more weight to higher values and decreases the weight of lower values (Figure 22, green line). However, a desired weighting would be an exponentially increasing weight as seen from the 0.5 normalized value and higher values, representing increasing weight for more positive values, and an exponentially decreasing weight as seen from the 0.5 normalized values and lower, representing increasingly negative values in the original data. An inverted Smootherstep distribution exactly describes this distribution (Figure 22, red line): 𝑓(𝑥) = 𝑥 + (𝑥 − (𝑥 3 ∗ (6𝑥 − 15) + 10)). (Eq. 3). A similar non-linear weighted distribution is applied to the normalized wind setup between -1 and 1, however now the original ‘no wind setup’ value corresponds with a normalized value of 0.. Figure 22. Distribution functions applied for creating polynomial input features LassoCV non-linear model. x-axis indicating the original normalized value, f(x) representing the non-linear weighted value of x.. hydrologic.com. 33.
(39) Predictive analytical model for chloride concentrations in the Port of Rotterdam. 3.1.3. Autocorrelation of boundary conditions Autocorrelation analysis is applied to examine to what extent samples of a series, in this case the boundary conditions, are related in time and to what extent a ‘memory’ exists in the system (Blaas & van den Boogaard, 2006). By computing parameters based on the autocorrelation analysis, observed chloride concentrations can be indicated as independent from previous observations. Thus, eliminating autocorrelation in the predicted chloride concentrations. Within this autocorrelation analysis the threshold of ‘memory’ in the system is set at a correlation equal to the e-folding value (i.e. e-1 ≈ 0.367), which is often applied in analyses with hydrological parameters (Blaas & van den Boogaard, 2006; Gerberet al., 2008; Park et al., 2018). The extent of the system ‘memory’ is indicated as the autocorrelation time (𝜏𝑎𝑡 ). The auto-correlogram of the wind setup indicates an autocorrelation time 𝜏𝑎𝑡 = 2 sampling periods (Figure 23), which is equal to one tidal cycle or about 12.4 hours. A parameter describing the ‘memory’ of wind setup is added based on a moving weighted average (MWA), which weighs previous observations, in this case two, according to a linear series between 0 and 1 (Appendix B). The new parameter thus contains a weighted average of the two previous wind setup measurements.. Figure 23. Autocorrelation of wind setup of tidal sampled data.. A similar approach is applied to the discharge time series of the Waal, Meuse and Lek. From this an autocorrelation time of the Waal discharge is determined at 𝜏𝑎𝑡 = 94 sampling periods, about 24 days (Figure 24). Autocorrelation times of the Meuse and Lek are much smaller, 𝜏𝑎𝑡 = 27 sampling periods (~7 days) and 𝜏𝑎𝑡 = 4 sampling periods (~1 day), respectively (Appendix 2).. Figure 24. Autocorrelation of Waal discharge of tidal sampled data.. hydrologic.com. 34.
(40) Predictive analytical model for chloride concentrations in the Port of Rotterdam. Also in the astronomical tidal signal autocorrelation is present (Figure 25) due to the neapspring cycle. The autocorrelation of the astronomical tide 𝜏𝑎𝑡 = 90, about 12 days.. Figure 25. Autocorrelation of astronomical tide of tidal sampled data.. Finally, a parameter is added describing the absolute change in water level from low tide to high tide and visa-versa, the tidal amplitude. This change in water level is relevant to the amount of saline water flowing in or out of the estuary.. 3.1.4. Parameter selection Model development is a trade-off between model performance on the training dataset and model performance on the validation dataset (Figure 26). An increase in model complexity, by for example the addition of parameters, generally increases the model performance on the training dataset. A too complex model, however, can cause over-fitting on the training dataset, which leads to a decrease of model performance on the validation dataset and increased variance, indicated with the RMSE. A too simplistic model has a low performance on the training dataset as well as on the validation dataset. The model is optimized by selection of the model complexity corresponding with the highest model performance on the validation dataset .. Figure 26. Schematic trade-off between model complexity and model performance.. Model complexity and performance is assessed with the use of a multi-step analyses. The multi-step analysis is designed to assess the effect of each additional parameter on the model performance indicators R2 and RMSE, on the training dataset as well as on the validation dataset. For each of the four chloride concentration measurement locations, a multi-step analysis is performed to determine the most suitable set of parameters to describe chloride. hydrologic.com. 35.
(41) Predictive analytical model for chloride concentrations in the Port of Rotterdam. concentrations at that specific location. The multi-step analysis regarding the linear OLS model evaluates the addition of five independent input parameters (i.e. tide, Waal/Meuse/Lek discharge and wind setup), with addition of the moving weighted averages (MWS) of these parameters developed using the autocorrelation time (Section 3.1.3) and the tidal amplitude (Table 12). The non-linear LassoCV model incorporates, in addition to the first 11 parameters, each cross-product as a parameter. For example, when evaluating the first three parameters the additional cross-products: [Tide * Discharge Waal], [Tide * Wind setup] and [Discharge Waal * Wind setup] are added. These parameters are added in order to describe processes, as described in Section 1.2.1, which are dependent on multiple input parameters, such as the inflow of the tidal wave. The non-linear model also incorporates the non-linear weighted parameters (1b, 3b, 9b and 10b in Table 12) as described in Section 3.1.1. Table 12. Parameters for multi-step analysis.. Parameter number. Parameter name. Parameter unit. 1 2 3 4 5. Independent input parameters: Astronomical Tide Discharge Waal Wind setup Discharge Lek Discharge Meuse. [cm NAP] [m3/s] [cm] [m3/s] [m3/s]. 6 7 8 9 10 11. MWA of autocorrelation of parameter: Discharge Waal Discharge Meuse Discharge Lek Wind setup Astronomical Tide Tidal amplitude. [m3/s] [m3/s] [m3/s] [cm] [cm NAP] [cm]. 1b 3b 9b 10b. Smootherstep of: Astronomical tide Wind setup MWA wind setup MWA astronomical tide. [cm NAP] [cm] [cm] [cm NAP]. Based on the outcome of the multi-step analysis, the most suitable parameters for each of the four measurement locations are selected and applied for further analysis. The criteria that are applied for incorporating any addition parameter are: - Inclusion of the parameter increases the model performance on the training dataset, without decreasing model performance on the validation dataset, or: - Inclusion of the parameter increases the model performance on the validation dataset.. hydrologic.com. 36.
(42) Predictive analytical model for chloride concentrations in the Port of Rotterdam. 3.1.5. Sensitivity analysis A sensitivity analysis is performed based on the SALib-package (Usher, et al., 2016). SALib is an open source library written in Python for performing sensitivity analysis. It can be applied to Python based models such as the applied linear OLS model and non-linear LassoCV model. The applied technique for computing the sensitivity of the model to the input parameters is the Sobol’ sensitivity analysis (Sobol′, 2001), a variance-based sensitivity analysis. Based on the spread of the input parameters, this technique determines the sensitivity of the model output based on variation of the input parameters (Saltelli, et al., 2010). The computed sensitivity indices refer to the fraction of variance in the output. Main advantage of the Sobol’ sensitivity is the division of first and higher order sensitivity indices. First order sensitivity indices indicate the fraction of variance explained by the input variable. Higher order sensitivity indices indicate the explained variance of the output from interactions between input parameters and non-linearity of input parameters, such as applied in the non-linear LassoCV model. The output of the Sobol’ sensitivity analysis is a total order sensitivity index, which is a combination of first and higher order indices (Zhange, et al., 2015). Application of this Sobol’ sensitivity analysis makes it possible to compare sensitivity of both models to each of the input parameters, by comparing the total order sensitivity index computed for each model.. 3.1.6. Uncertainty analysis Measurement of the input parameters is not performed at the location of chloride concentration measurements. For example, the discharge of the Waal may change between Hagestein and Lekhaven due to water withdrawal or lateral inflow from pumping stations along the river. Especially during spring and summer, water is needed for agricultural use. For measurement location Lekhaven, on the New Meuse, we assess the effect of water withdrawal and discharge from Boezemgemaal Gouda on chloride concentrations. This pumping station is capable of pumping up to 50 m3/s (HydroLogic, 2015b).. hydrologic.com. 37.
Figure


+7


Related documents
Finally the aims of this study to determine the indicators of evaluate of children with mathematics learning disabilities, the level of visual discrimination
Standardization of herbal raw drugs include passport data of raw plant drugs, botanical authentification, microscopic & molecular examination, identification of
Assessing the Impact of Biodiversity Conservation in the Management of Maize Stalk Borer (Busseola f
Field experiments were conducted at Ebonyi State University Research Farm during 2009 and 2010 farming seasons to evaluate the effect of intercropping maize with
It was decided that with the presence of such significant red flag signs that she should undergo advanced imaging, in this case an MRI, that revealed an underlying malignancy, which
Another study with diabetic patients and the West Nile virus had observed that these patients were at greater risk of developing encephalitis and other severe forms of the disease
Heterologous bone graft material (Osteoplant-Flex) is thought to be a good alternative to autologous grafts in de- creasing relapse rates and reducing the morbidi- ty of the
19% serve a county. Fourteen per cent of the centers provide service for adjoining states in addition to the states in which they are located; usually these adjoining states have
diallylacetic acid rather than bismuth since in one case in which analysis was performed only minute amounts of bismuth were recovered, and there was, in his opinion, ‘ ‘no
