http://wrap.warwick.ac.uk/
Original citation:
Michieletto, Davide, Marenduzzo, Davide and Orlandini, Enzo. (2015) Is the kinetoplast
DNA a percolating network of linked rings at its critical point? Physical Biology, Volume
12 (Number 3). 036001. ISSN 1478-3975
Permanent WRAP url:
http://wrap.warwick.ac.uk/68958
Copyright and reuse:
The Warwick Research Archive Portal (WRAP) makes this work by researchers of the
University of Warwick available open access under the following conditions.
This article is distributed under the terms of the Creative Commons Attribution 3.0
License (
http://creativecommons.org/licenses/by/3.0/
) which permits any use,
reproduction and distribution of the work without further permission provided the original
work is attributed.
A note on versions:
The version presented in WRAP is the published version, or, version of record, and may
be cited as it appears here.
This content has been downloaded from IOPscience. Please scroll down to see the full text.
Download details:
IP Address: 137.205.202.117
This content was downloaded on 26/06/2015 at 08:52
Please note that terms and conditions apply.
Is the kinetoplast DNA a percolating network of linked rings at its critical point?
View the table of contents for this issue, or go to the journal homepage for more 2015 Phys. Biol. 12 036001
(http://iopscience.iop.org/1478-3975/12/3/036001)
Phys. Biol.12(2015) 036001 doi:10.1088/1478-3975/12/3/036001
PAPER
Is the kinetoplast DNA a percolating network of linked rings at its
critical point?
Davide Michieletto1
, Davide Marenduzzo2
and Enzo Orlandini3
1 Department of Physics and Centre for Complexity Science, University of Warwick, Coventry CV4 7AL, UK 2 School of Physics and Astronomy, University of Edinburgh, Mayfield Road, Edinburgh EH9 3JZ, Scotland, UK 3 Dipartimento di Fisica e Astronomia, Sezione INFN, Università di Padova, Via Marzolo 8, 35131 Padova, Italy
E-mail:d.michieletto@warwick.ac.uk
Keywords:kinetoplast DNA, percolation, topology
Abstract
In this work we present a computational study of the kinetoplast genome, modelled as a large number
of semi
fl
exible unknotted loops, which are allowed to link with each other. As the DNA density
increases, the systems shows a percolation transition between a gas of unlinked rings and a network of
linked loops which spans the whole system. Close to the percolation transition, we
fi
nd that the mean
valency of the network, i.e. the average number of loops which are linked to any one loop, is around
three, as found experimentally for the kinetoplast DNA (kDNA). Even more importantly, by
simulating the digestion of the network by a restriction enzyme, we show that the distribution of
oligomers, i.e. structures formed by a few loops which remain linked after digestion, quantitatively
matches experimental data obtained from gel electrophoresis, provided that the density is, once again,
close to the percolation transition. With respect to previous work, our analysis builds on a reduced
number of assumptions, yet can still fully explain the experimental data. Our
fi
ndings suggest that the
kDNA can be viewed as a network of linked loops positioned very close to the percolation transition,
and we discuss the possible biological implications of this remarkable fact.
1. Introduction
A kinetoplast [1] is a network of linked DNA loops commonly found in a group of unicellular eukaryotic organisms of the class Kinetoplastida. Some of these organisms are responsible for important diseases such as sleeping sickness and leishmaniasis [2–4]. The kinetoplast DNA (kDNA) is known for its unique structure. Thousands of short (1–2.5 kbp) DNA loops are interlinked, forming a spanning network thatfills the mitochondria. The short loops, or mini-circles, are also linked with few large circles, or maxi-circles, consisting of around 30–50 kbp [5]. The loops are found to be in a relaxed state, i.e. they are not supercoiled, contrarily to DNA loops in other similar organisms. C. fasciculata mini-circles assemble in a network whose shape resembles that of a disk which measures 1μm in diameter and is 0.4μm thick [6,7]. Networks which are removed from the mitochondria, e.g. via cell lysis, expand into an elliptical shape whose minor and major axis are respectively around 10μm and 15μm, i.e. roughly a hundred times bigger than
their dimension in vivo [7]. This suggests that the networks experience a confinement within the mitochondria.
It has been observed [8] that a‘tripartite attach-ment complex’keeps the kinetoplast statically in place near the basal body, from which it is physically sepa-rated by the mitochondrial envelope. Transmission electron microscopy images of kinetoplast networks
in vivo[8–12] also suggest that the shape of the mito-chondrial membrane near the kinetoplast acts as a physical constraint on the outer structure of the net-work, while it is likely that histone-like proteins, such as p16, p17 and p18, or‘KAP proteins’ encoded in genes KAP2, KAP3 and KAP4, act as chemical con-straint on the inner structure [13–16].
The concentration of DNA in the kinetoplast has been found to be around 50 mg ml−1[5], similar to that found in bacteria (20 mg ml−1) but far smaller than the one inside the head of a T4 bacteriophage (800 mg ml−1or more) [17], meaning that the loops are overlapping but there is considerable space between DNA strands [5].
OPEN ACCESS
RECEIVED
20 March 2015
ACCEPTED FOR PUBLICATION
30 March 2015
PUBLISHED
13 May 2015
Content from this work may be used under the terms of theCreative Commons Attribution 3.0 licence.
Any further distribution of this work must maintain attribution to the author(s) and the title of the work, journal citation and DOI.
Previousfindings strongly suggest that the loops in the network are linked once with their neighbours, and that the valence of each rings, i.e. the number of neighbours, is around 3. In other organisms of the same class, e.g.L. tarentolae, the valence number is smaller, probably due to their different DNA con-centration. During replication, catenation between the loops introduces a nontrivial topological problem, which is solved as follows. First topoisomerase II dis-entangles one loop at a time from the network, the loop then undergoes duplication in a complex nearby, and later on it links again to the periphery of the net-work, together with the progeny mini-circles [6,18]. At this stage, each circle has a valence which is higher than 3: again, most likely due to the increase in density following DNA synthesis [19]. Finally, when the cell divides, two copies of the network are produced and the valence number is brought back to 3. This change in network valence has to be mediated by topological enzymes, e.g. topoisomerases, also accompanied by a relaxation of mass (mini-circle) density.
The topology of the kDNA network is unique in its own kind and has been studied in the past with experi-ments and simplified models [20,21], but a full under-standing of its role, origin and replication continues to represent a challenge for the scientific community [9,22,23].
Here we propose a model which builds on fewer assumptions with respect to previous work in the lit-erature. Phantom semi-flexible rings are confined to move inside a box of linear sizeL, which we vary in order to simulate varying values of the density of the kinetoplast network inside the mitochondrial mem-brane. By computing the Gauss linking number between pairs of rings, we analyse the topological con-straints experienced by the rings within the system. The model kDNA can be naturally represented as a network, by mapping rings to nodes and links between two rings to (undirected) edges [24,25] (seefigure1). Ourfindings suggest that for densitiesρgreater than a critical density ρp, the system has a non-zero
probability of forming a cluster of linked rings as big as the size of the whole system, i.e. percolating. In the case of the kinetoplast, a network with this property can be viewed as a state in which a relevant fraction of the mini-circles in the kinetoplast are mutually inter-locked to form an extended collection of inseparable rings [21]. We also further study the topology of the network by simulating its digestion, which is realized experimentally, for instance, by adding nuclease or restriction enzymes that cut the DNA, to the solution containing the mini-circles. Remarkably, the simu-lated digestion provides results which are quantita-tively comparable with experiments [25], and give new insight into the origin of the network.
2. Model
We model the kinetoplast genome asN= 50 DNA rings, each of which is a worm-like polymer made of
M= 128 beads of sizeσand with persistence length
lp= 20σ. A cut-and-shift form of the Lennard-Jones potential is used to model steric interaction between beads belonging to the same chain, so that we ensure that the rings do not get knotted and that they assume self-avoiding configurations. In physical units, σ ≃2.5nm is the hydrated diameter of double-stranded DNA,lp≃50nm, while the contour length of each of the loops isLc= 128σ=320 nm≃1kbp. The network is enclosed in a box of sizeL1×L1×L2, withLibetween 200 and 80 (in units ofσ). The boxes considered are both symmetric, i.e. L1=L2, and asymmetric, i.e.L1=2L2, such as the aspect ratio is similar to that of a kinetoplast disk, whose thickness
[image:4.595.121.554.61.218.2]in vivo(0.4μm) is roughly half of its diameter (1μm). We sample different network configurations by letting the rings thermalise with no steric interaction between different rings (i.e. rings are invisible to each other during equilibration), for at least the time taken for a ring to diffuse its own gyration radius, i.e. τR =Rg2 DCM. This stage mimics the presence of
Figure 1.(a) Graphical representation of the system. The colors of the rings are chosen randomly for clarity of visualization. (b) Network representation of (a). An edge between two nodes is drawn if two rings in the system are topologically linked. Connected components are highlighted in different colors. (See text for details.)
2
topological enzymes such as topoisomerases, which can either link or un-link the mini-circles from the neighbours. This allows the mini-circles to freely dif-fuse while temporarily unlinked. After this interval, we turn a soft repulsion on, which acts on every pair of beads distantrto each other and which we model as:
π
=
(
)
+E r A r
r
( ) 0, 50; 10 1 cos ,
s c 5 ⎛ ⎝ ⎜ ⎛ ⎝ ⎜ ⎞ ⎠ ⎟⎞ ⎠ ⎟
with A x y t( , ; ) a ramp function which brings
A x y t( , ; )fromxtoyint timesteps and rc=21 6σ. After this operation, which ensures that no contours are overlapping, we compute the pairwise Gauss linking number of any two rings, defined as:
∫ ∫
π= −
−
×
γ γ
(
)
r r
r r
r r
Lk i j( , ) 1
4 · d d , (1)
i j
i j
i j
3
i j
whereγiandγjare the contours of the two rings, andri
andrjthe respective spatial coordinates [26,27]. This
is a topological invariant which describes the pairwise state of rings, as far as we forbid two rings to pass through each other. This stage represents the final kinetoplast conformation, when no molecule of topoi-somerase is available. Once the linking number has been measured, we turn the soft potential off and repeat the procedure in order to obtain an ensemble of (independent) configurations for a given densityρ.
It is important to bear in mind that this ensemble of networks should be interpreted as a collection of independent equilibrated networks, rather than as a dynamical sequence of network conformations over time, since in reality the mini-circles are not allowed to cross through each other without the intervention of a topological enzyme. In other words we are generating ensembles of networks that one could obtain, for instance, when looking at the kinetoplast after replica-tion and after it has been separated into the two daugh-ter cells. At this stage in fact, a simultaneous topological and structural re-arrangement of the net-work has to take place, involving both, topological enzymes and mass relaxation via mini-circles diffu-sion, which is itself allowed by the presence of topoisomerases.
The model we propose here is, with respect to pre-vious work, based on less assumptions, as, for exam-ple, it does not rely on the fact that the mini-circles are anchored on a 2D lattice [21]. This is an important assumption that we relax. In fact, this rigid structure would severely compromise the kinetoplast replica-tion, hindering the free removal of mini-circles. We will here show that the 2D layer structure of the kine-toplast, which is widely reported in the literature, is not required to obtain agreement with experimental observations. This suggests that condensation and anchoring into a layered 2D structure is secondary to the network topological arrangement. Furthermore, we here relax the assumption that the rings are perfect
circles [20], and consider much more realistic semi-flexible polymers.
The observables we measure from these networks are averaged over the ensemble formed by 5000 con-figurations generated with the method described above. For each configuration in the ensemble, we generate a corresponding network representation by assigning an (undirected) edge between each two rings which haveLk i j( , )≠ 0[24,25]. This maps the sys-tem of linked rings to an undirected network, whose properties are directly related to the properties of the system of linked rings (seefigure1). Note that, because this procedure is based on the pairwise linking num-ber, it would classify Borromean and Brunnian links as unlinked; we expect such non-trivial links to be rare within the kinetoplast network, where a good approx-imation is that each mini-circle is linked identically and once to its neighbours [7,25].
Our main control parameter is the size of the confining container, Li, which we modify to vary the densityρ. This determines the physical properties of the resulting network. The overlapping (number) density ρ*, at which rings start to feel each other, can be estimated asρ* =M (4 3πRg3)∼0.0076σ−3, whereRg has been measured from relaxed rings in sparse solution1. To convert to a biologically realistic value, we may assume that the volume occupied by each bead is that of a cylinder of size and height equal toσ, which leads to a volume fraction ϕ*∼ 0.60% occupied by the DNA, or equivalently a concent-rationc*∼8.1mg ml−1(calculated with a DNA den-sityρDNA =1.35 g cm−3[28]).
3. Results
A good way of studying the properties of a networkG
is by looking at itsfirst Betti numberb G1( )and its giant connected component GCC(G) [24]. The former is defined as b G1( )≡NCC− ∣ ∣ + ∣ ∣ ,
whereNCCis the number of connected components and∣ ∣ and∣ ∣ the size of the sets of vertices and edges, respectively. The latter is defined as the largest set of nodes in which every node can be reached by any other node within the set. For instance, in figure1, the GCC corresponds to the red cluster. This quantity is useful to investigate the‘percolation’of the network. Here we define a network to be percolating if the size of theGCCis of the same order as the number of nodes in the whole network. The percolation density ρp is then the density above which the system shows a non-zero probability of percolation. The GCC of a percolating network is a spanning, or percolating, cluster. While the size of the GCC gives some information regarding the connectivity of the network, thefirst Betti number,
1 We
find Rg∼16σ, close to but below the estimate
σ
∼ ∼
Rg L lc p6 20.7 which works forLc≫lpand disregards
excluded volume interactions within one ring.
3
b G1( ), provides us with some insight about the topology of the network. In fact, b G1( )equals the number of closed sub-graphs in the network, which is also the total number of cyclic d-mers [24]. For mostly unconnected graphs, b G1( )≃ 0, while for
nearly fully connected graphs: ∣ ∣ ≃ N N( −1) 2 and henceb G1( )≃N2 2for largeN. An increase in
b G1( )corresponds to both, an increase in network connectivity and an increase in cyclic structures.
Infigure2(a) we show the size of theGCC, and the first Betti number of the graphG,b G1( ), divided by the size of the systemNas a function of the system density
ρ. This plot suggests that a percolating component can be observed in the system at values of the density ρ≳ρp ≃0.0064 σ−3. Although the precise value of the percolation density is not well defined for finite systems, our model allows to predict the emergence of a state in which a fraction close to unity of rings in the system is topologically interlocked in a single cluster for values of the density above ρp. Infigure2(b) the valence, or mean vertex degree〈 〉k is shown together with the linking probabilitypLkas a function of the densityρ. Thefigure shows that the average degree〈 〉k
scales linearly with the densityρ, in agreement with previousfindings [21]. One can also see that atρ=ρp the valence of our network is three, in agreement with experiments [25]. By assuming that the network con-figurations are sampled from an ensemble of random
graphs, the linking probabilitypLkcan be calculated as
= −
pLk k (N 1). (2)
The assumption that the network configurations can be described by random graphs is not justifieda priori. On the the other hand, we can check that this assumption is valid by comparing the degree distribu-tion p(k) obtained from the simulations (see data points and dashed lines infigure2(d)) and the random graph distributions p k prg( ; )with p=pLk obtained from equation (2):
= − − − −
(
)
(
)
p k p N
k p p
; Lk 1 Lkk 1 Lk N k.
rg
1
⎜ ⎟
⎛ ⎝ ⎞⎠
One can notice that the random graphs distributions and the data points are in very good agreement for ρ≲0.0064σ−3and in agreement, but not as good, for
ρ≳0.0087σ−3; in other words, the system can be approximated as a random graph with linking prob-abilitypLkwhich is directly proportional to the valence of the rings and inversely proportional to the number of rings in the box. In terms of the kinetoplast structure one can imagine that, due to the presence of topological enzymes, the mini-circles can be un-linked and hence undergo free diffusion inside the mito-chondrion . Because of this, it is reasonable to expect that the network of mini-circles would form a random arrangement of linked rings. In this respect, our model can capture the randomness of the system in a better
Figure 2. (a)Fraction of nodes belonging to the giant connected component〈∣GCC∣〉(filled squares) andfirst Betti number〈 〉b1 (empty squares) as a function of the densityρand averaged over the ensemble of configurations. Snapshots of the typical configurations are also shown, with the respective giant connected components highlighted in red.(b)Valence, or mean degree, of the rings〈 〉k together with the linking probability computed in equation (2) as a function of the densityρ. The plots suggest a linear increase inρin agreement with previousfindings [21].(c)Distributionp(Lk) for different values of the densityρ. As found experimentally, we observe that linking numbersLkhigher than 1 and lower than−1 are highly suppressed.(d)Degree distributionp(k). Data points are obtained from simulations, solid lines show the degree distributions sampled from random graphs with edge probabilityp=pLk.(a)–(d)Dashed lines show the results obtained from simulations performed in asymmetric boxes. (See text for details.)
4
[image:6.595.120.554.62.315.2]way than previous models found in the literature could.
Infigure2(c) we show the distribution of the link-ing numberp(Lk). This quantity is found to be peaked at zero for any densityρinvestigated in this work. This means that the networks produced by our model are never fully connected, i.e. there are always more pairs of rings which are unlinked than pairs which are linked. The‘shoulders’of the distribution atLk= ±1
increase withρalthough values of∣Lk∣ >1are very unlikely (p Lk( )< 10−3). This is once again in agree-ment with experiagree-mental findings [7, 25], which observed that each linked mini-circle is linked only once with its neighbours. For simplicity, we always assign a single edge between a pair of nodes even in those cases in which they have an higher linking num-ber. Because they are so rare, they represents a small fraction of all the links, which can be neglected. The mean linking number 〈Lk〉is zero within errors, as must be the case as configurations withLk= −1are as likely as ones withLk= +1.
It is worth noting that infigures2(a)–(d) we report the results obtained by simulating the system in asym-metric boxes. These are shown as dashed lines. As one can notice, the two cases are in very good qualitative agreement. Small deviations are found for the degree distributions and the average Betti number〈 〉b1 . This suggests that the actual shape of the confining box does not affect the qualitative behaviour of the system, which preserves its randomness.
Infigure3(a)–(h) we show all the possible sub-graphs with three and four nodes, up to symmetries. We call these patterns ‘motifs’. Every connected graph formed by three and four nodes is isomorphic to those infigures3(a) and (b) and1(c)–(h), respectively. In order to count the number of motifs of each type, we consider every connected sub-graph with given number of nodes and check whether it is isomorphic to one of the motifs shown infigure1. The results are shown in figure 3. We observe that linear trimers (motif3(a)) are much more frequent than cyclic ones (motif 3(b)), for any density ρ. Similarly, linear
tetramers, are three times more common than bran-ched tetramers (motif3(d)), which is in qualitative agreement with experiments [25]. Finally, fully cyclic tetramers are highly suppressed, again in agreement with previous experimental work.
To further quantitatively compare the properties and structure of the random network of linked con-fined loops found in simulations to those of the kDNA, and inspired by the common biological proce-dure known as‘digestion’, we simulate the presence in solution of restriction enzymes, i.e. enzymes which are able to cut DNA strands. In this way we can simulate the random breakage of the network due to a con-centration of restriction enzymes which can cut the network, and which was used in [25] to further study the network topology experimentally. To model diges-tionin silico, we associate a probabilitypto each bead composing the rings to be removed. Such probability is related to the concentration of restriction enzymes in the solution and time left to act on DNA mini-cir-cles. The equivalent probabilityprof a ring to become linearized, e.g. by removing one or more of its beads, is
= − − ∼
pr 1 (1 p)M Mp, (3)
whereMis the number of beads composing the rings. For probability p= pc =1 M, every ring has been cut, on average, once, and therefore there are no longer closed rings in the system. This procedure maps to the network representation as we can assign the same probabilitypr to each of the nodes, and with prob-abilitypr we remove a node from the network. In practice, we consider an ensemble of (independent) configurations from the molecular dynamics simula-tion and for each one we simulate ten digessimula-tions by removing nodes at random with probabilityprfrom the corresponding network. We then average the observables over the ensemble of50×103simulated digestions. The average number of removed nodes is 〈nr〉 =p Nr . At the end of the (partial) digestions we
[image:7.595.120.554.60.209.2]measure the fraction of monomers (single uncate-nated rings), dimers (two cateuncate-nated rings) and trimers (three catenated rings) obtained from the digested network. These quantities can be obtained by running
Figure 3.Showing the fraction of cyclic trimers(b)over linear trimers(a)(red) and the fraction of different tetramers ((d)–(h)) over linear tetramers(c)(shades of blue). Thefindings are in qualitative agreement with previous experiments [25].
5
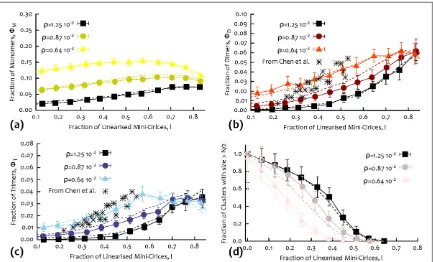
a high resolution gel electrophoresis test on the samples, as in [25]. The relative fraction of monomers, dimers, trimers etc, correlates directly with the inten-sity of the bands, as these oligomers move with different speed in the gel. In figure4 we report our findings for different values of densityρ, as a function of the linearized fraction of mini-circles,l= 〈nr〉(to ease comparison with the data in [25]).
From the results infigure4(d), one can notice that even after half of the nodes have been removed, one can still observe some large, or percolating, clusters. In other words, the network shows high resistance against random breakage. When viewed as a property of the biological kinetoplast genome, this appears to be functionally relevant: the DNA network needs to remain intact either when some of the mini-circles are removed, e.g. by topoisomerase II, either accidentally during the cell cycle, or during replication when dec-atenation is required.
The distribution of the fraction of monomersΦM,
dimersΦDand trimersΦTshow peaks as a function of l, whose locations depend on the density. In general, the value ofρat which the distributions reach their maximum increases with density, meaning that the denser the system, the more it has to be digested before the probability of observing monomers, dimers or tri-mers, rises and becomes sizeable. Forfixed density, the peaks show that trimers are best produced at lowerl
than dimers, and dimers at lowerlthan monomers; this is expected as increasing l should increase the probability offinding smaller and smaller catenanes.
Wefind that the best range oflwithin which gel elec-trophoresis of oligomers can give information on the network structure depends on the densityρ. For the highest density studied here, the fraction of linearized mini-circles has to be close to 80%, while for ρ∼0.0064σ−3the value oflcan lay between 30% and 80%, after which the survival fraction of dimers and trimers start to decrease. This range is very similar to the one observed in [25]. Even more strikingly, in
figure 4 we superimpose the data from [25], and
observe a striking quantitative agreement with the curve forρ=0.0064σ−3—we recall thatρ=0.0064
σ−3also leads to〈 〉 ≃k 3as inferred from the experi-ments. Remarkably, considering the asymmetric sys-tem results in very little difference with the curves reported infigure 4. This strongly suggests that the simple symmetric confinement is enough to under-stand the kinetoplast structure both qualitatively and quantitatively.
[image:8.595.120.553.60.322.2]The good agreement with experimental data shown infigure 4, strongly suggests that our model can capture the topological structure of the kDNA described by a network of randomly connected con-fined 3D links close to the percolation transition. In this respect, the fact that the kDNA is found geome-trically to be a layered disk-shaped structure may be due to a combination of the geometrical spatial con-finement the network is subject toin vivo[8–12,21] and of the action of histone-like DNA-binding pro-teins [13–16]. However, the latter is inessential to explain the existing digestion data. In addition, in the
Figure 4.(a)–(d): fraction of monomers, dimers, trimers and clusters with sizes>N2as a function of the fraction of mini-circles linearized during the digestion, for different densitiesρ. Crosses represent experimental data from [25]. Dashed lines represent values obtained by performing simulations in asymmetric boxes.
6
supplementary material we show that this layered organized structure can be achieved within our frame-work by adding suitable interactions between some parts of the rings and the confining box (see S.I. for details).
One of the main conclusions that can be drawn from our work is that the kinetoplast topology is inde-pendent on the network packaging and organization, while it is driven solely by geometrical confinement. This prediction can be tested, for instance, by measur-ing the valence ofin vivonetworks, as done in [19,25], formed when genes expressing KAP histone-like pro-teins are silenced, as done in [16]. Our results predict that in this case, the kinetoplast should appear un-layered and disorganized, while retaining a valence near 3.
4. Discussion and conclusions
In summary, we studied the statistical physics of a percolating cluster of linked rings, by confining phantom semiflexible rings in a box and varying the density. The onset of the percolation occurs at concentrations ρp ∼ 0.0064 σ−3. At this density, the mean valence of the nodes is around three, which is compatible with the findings in the kDNA. Impor-tantly, at the same density value, we compared the results from anin silicodigestion of the network by a restriction enzyme, finding very good quantitative agreement with the experimental data found in [25]. These results strongly suggest that the kinetoplast topology is well represented by this model at density ρ∼ρp, i.e. by a network of linked rings close to its critical point, i.e. the point at which the network starts to show percolating behaviour. Remarkably, our results are affected very little by the details of the confining geometry—what matters is the presence of confinement itself, which drives the percolation tran-sition in the network of links [21].
Ourfindings also suggest that the density of DNA loops in the kinetoplast networks should not be too far from the overlap density. Taking a typical case with
N= 5000 loops of say 1 kbp each, wefind that the over-lap density is∼8.1 mg ml−1; the density of the same network within a mitochondrion of volume∼1μm3 volume is about 5.43 mg ml−1, which fits very well with our simulations. The DNA structure inC. fascicu-lata, which is well studied, has larger density (∼50 mg ml−1), but this is achieved by further com-paction by histone-like proteins [15,16], hence does not reflect purely geometric confinement. Further-more, even if the density is larger than the overlap den-sity, a network could still exist close to the percolation transition if the activity of topoisomerase II, which allows catenation and is tacitly assumed by our model as loops are invisible to each other, is limited, for instance by the enzymatic concentration.
Being close to the percolation transition may well provide an evolutionary advantage for the kDNA net-work, as this structure may be favoured over a more heavily connected network, as it facilitates the dec-atenation during replication, but at the same time ensures that mini-cirlces are not released by mistake. Another property of the kinetoplast-like network is that it is very resistant to digestion by a restriction enzyme, i.e. the digestion has to proceed significantly before large clusters disappear (seefigure4). This fea-ture again appears to be functionally relevant, as it provides a way to preserve genetic material against random breakage and replication mistakes.
Acknowledgments
DMi acknowledges the support from the Complexity Science Doctoral Training Centre at the University of Warwick with funding provided by the EPSRC (EP/ E501311). EO acknowledgefinancial support from the Italian ministry of education grant PRIN 2010HXAW77. We also acknowledge the support of EPSRC to DMa, EP/I034661/1. The computing facil-ities were provided by the Centre for Scientific Computing of the University of Warwick with support from the Science Research Investment Fund.
References
[1] Fairlamb A H, Weislogel P O, Hoeijmakers J H and Borst P 1978J. Cell Biol.76293–309
[2] Young D and Morales A 1987J. Med. Entomol.24587–9 [3] Jacobson R L 2003Folia parasitol.50241–50
[4] MacLean L, Chisi J and Odiit M 2004Infect. Immun.727040–4 [5] Shapiro T and Englund P 1995Annu. Rev. Microbiol.49
117–43
[6] Pérez-Morga D L and Englund P T 1993Cell74703–11 [7] Jensen R E and Englund P T 2012Annu. Rev. Microbiol.66
473–91
[8] Ogbadoyi E, Robinson D and Gull K 2003Mol. Biol. Cell14
1769–79
[9] LukešJ, Guilbride D and Votýpka J 2002Eukaryotic Cell1
495–502
[10] Gluenz E, Shaw M K and Gull K 2007Mol. Microbiol.64
1529–39
[11] Lai D h, Hashimi H, Lun Z r, Ayala F J and Lukes J 2008Proc. Natl Acad. Sci. USA1051999–2004
[12] Docampo R, Ulrich P, Moreno S N J, Docampo R, Ulrich P and Moreno S N J 2010Phil. Trans. R. Soc.B365
775–84
[13] Xu C and Ray D S 1993Proc. Natl Acad. Sci. USA901786–9 [14] Xu C W, Hines J C, Engel M L, Russell D G and Ray D S 1996
Mol. Cell. Biol.16564–76
[15] Hines J C and Ray D S 1998Mol. Biochem. Parasitol.9441–52 [16] Avliyakulov N K, Lukes J and Ray D S 2004Eukaryot. Cell3
518–26
[17] Kellenberger E, Carlemalm E, Sechaud J, Ryter A and Haller G 1986Bacterial Chromatined C O Gualerzi and C L Pon pp 11–25(Berlin: Springer)
[18] Liu B, Liu Y, Motyka S A, Agbo E E C and Englund P T 2005
Trends Parasitol.21363–9
[19] Chen J, Englund P T and Cozzarelli N R 1995EMBO J.14 6339–47
[20] Arsuaga J, Blackstone T, Diao Y, Karadayi E and Saito M 2007
J. Phys. A: Math. Theor.401925–36
7
[21] Diao Y, Hinson K, Kaplan R, Vazquez M and Arsuaga J 2012
J. Math. Biol.641087–108
[22] Silver L E, Torri A F and Hajduk S L 1986Cell47537–43 [23] Morris J C, Drew M E, Klingbeil M M, Motyka S A, Saxowsky T T,
Wang Z and Englund P T 2001Int. J. Parasitol.31453–8 [24] Michieletto D, Marenduzzo D, Orlandini E,
Alexander G P and Turner M S 2014ACS Macro Lett.3255–9
[25] Chen J, Rauch C A, White J H, Englund P T and Cozzarelli N R 1995Cell8061–69
[26] Orlandini E, Tesi M C and Whittington S G 2000J. Phys. A: Math. Gen.33181–6
[27] Orlandini E and Whittington S G 2004J. Chem. Phys.121
12094–9
[28] Matthews B 1968J. Mol. Biol.33491–7
8