Munich Personal RePEc Archive
The Checks of Czechs: Optimizing the
Debt Portfolio of the Czech Government
Melecky, Ales and Melecky, Martin
Department of Economics, Technical University of Ostrava
15 July 2014
Online at
https://mpra.ub.uni-muenchen.de/57604/
The Checks of Czechs
:
Optimizing the Debt Portfolio of
the Czech Government
Ales Melecky
Department of Economics
Technical University of Ostrava
Martin Melecky
*Department of Economics
Technical University of Ostrava
Abstract
Sound debt management practices help protect government expenditures on debt servicing from aggregate shocks and prevent the occurrence of debt crises. Building on Giavazzi and Missale (2004), this article examines the optimal allocation of government debt for the Czech Republic. To calibrate conditional expectations of macro variables and to identify unexpected shocks, a vector autoregression (VAR) model for the Czech macroeconomy is estimated. The estimated optimal allocations across short-term debt, inflation-linked debt, long-term debt, and foreign currency debt are then discussed in relation to the actual allocations implemented by the government debt managers in the Czech Republic. We find that the manager of Czech government’s debt allocates too much debt into short-term bills and too little debt into inflation-linked bonds based on the estimated optimal allocations. Deepening the market for inflation-linked bonds and improving government cash management are the core policy recommendations.
Key words: Public debt management; Optimal debt allocation; VAR model; Czech
Republic, Emerging Market Economies.
* We thank Jan Libich for comments and suggestions on the earlier draft of the paper. Corresponding author:
- 1 -
Table of Contents
1. Introduction ... 1
2. Stylized Facts: Management of Government Debt in the Czech Republic ... 4
3. Theoretical Underpinnings ... 5
4. Data Description ... 8
5. Calibration of Parameters ... 9
6. Discussion of Results ... 13
7. Sensitivity Analysis ... 16
8. Conclusion ... 17
1.
Introduction
A government’s debt portfolio contains complex financial structures and can create
substantial balance sheet risk for the government or cash flow risk for the state budget. Sound debt
management practices can help prevent the occurrence of debt crises, reduce vulnerability of
government finances to macroeconomic and financial shocks, and support economic growth. The IMF
and the World Bank therefore published, in cooperation with national debt management experts, a set
of guidelines on public debt management for policy makers (IMF and WB, 2001). This work includes
formulation and properties of public debt management objectives, the underlying institutional
framework and possible coordination challenges, formulation of the debt management strategy,
attributes of a sound risk management framework, and other important areas of public debt
management.
Much has been written about public debt management and the strategies for optimal debt
allocation (Sargent and Wallace 1981; Bohn 1990, 1998; Missale 1997; and Missale and Blanchard
1991, among others). Also, the recent financial and public debt crises have demonstrated the important
role of public debt management strategy and debt allocation for economic growth. From a practical
standpoint, Melecky (2012a) reviews debt management strategies around the world and studies
possible drivers behind the varying formulations of public debt management strategies. Hawkesby and
- 2 -
constrains to public debt management to conduct debt allocation analysis for nine OECD countries.
Buera and Nicolini (2002) find that the size of financial transactions that the government must
undertake each period to replicate state contingent bonds is very large and increases dramatically with
the number of states. Gerard and Gilson (2001) show, in a simple two country model, how an
exchange rate regime can influence the public debt structure. Because the exchange rate risk is
historically the most important risk for debt managers in emerging market economies, Melecky
(2012b) provides a review of policy approaches to choosing the currency structure of foreign-currency
debt. In addition, Melecky (2010) develops a practical approach that debt managers can use when
deciding on the currency allocation of public external debt across multiple foreign currencies based on
synchronization indicators of exchange rate volatility.
This paper focuses on public debt management in the Czech Republic, because its
experience, of progressing from a transition economy to an emerging market and a high-income
economy could be informative for debt managers and policy makers in developing and emerging
market economies. Although numerous studies have focused on fiscal discipline and debt
sustainability issues (Bulir 2004; Melecky A. and Melecky M. 2012, EC 2012; IMF 2013; Dybczak
and Melecky 2014), only Matalík and Slavík (2005) to our knowledge focused explicitly on applied
government debt management in the Czech Republic. They argue that government debt management
in the Czech Republic went through dynamic development during the transition period of the 1990s
and early 2000s. A very low initial level of government debt, missing fundamental segments of the
financial market, and the absence of basic debt instruments, combined with small or non-existent fiscal
deficits, impeded development of the domestic debt market in the Czech Republic. The need to
establish a functioning government bond market to spur domestic capital market development and
manage risk from foreign currency exposures, thus arose. Matalík and Slavík (2005) recommend that
public debt management be included as part of the state treasury management functions. This
recommendation contradicts that of Wheeler (2004) who argues for some independence of the debt
- 3 -
This paper focuses specifically on the allocation strategy for government debt in the Czech
Republic. It builds on the theoretical approach of Giavazzi and Missale (2004) to empirically analyze
the optimal government debt allocation for the Czech Republic. The identification of unexpected
shocks in this approach draws on conditional expectations from an estimated VAR model for the
Czech macroeconomy. Moreover, the paper discusses the estimated optimal allocation shares in
relation to the actual ones implemented by the government debt managers in the Czech Republic. It
also studies the robustness of the determined optimal debt allocation using a sensitivity analysis.
Based on the conducted analysis the paper aims to propose implementable policy recommendations to
improve the debt management strategy of the Czech Ministry of Finance (CMoF), respectively its debt
management unit.
We find that the debt manager of Czech government’s debt should optimally allocate about
7% of the debt into short-term CZK bills, about 16% of the debt into foreign currency bonds, 25% into
CZK inflation-linked bonds, and 52% of the debt into long-term CZK bonds. The actual debt
allocations implemented by the CMoF in end-2012 differ from the estimated optimal ones, particularly
for the shares allocated to short-term bills and inflation-linked bonds. In particular, the CMoF allocates
about 23% into short term bills compared with the suggested optimal allocation of 7% based on our
estimates. The actual allocation could be viewed as more speculative and opportunistic to generate
savings. However in practice, greater allocations to short-term bills could reflect other constraints such
as inefficiencies in cash management or implementation of budgetary plans that the government will
have to tackle first before it can move toward the optimum allocation. Moreover, because of
underdeveloped inflation linked bond markets, the CMoF does not allocate any significant share of its
debt into this instrument.1 Our estimated optimal allocations for the Czech government’s debt suggest
that the Czech government should deepen the market for inflation linked bonds. In addition to
protecting the government debt portfolio against macroeconomic shocks, efforts to develop the market
1 In June 2012, the CMoF issued for the first time CPI inflation linked bonds for retail investors and continued to
issue this type of securities since then. To date, the overall allocation of debt to this instrument remains
negligible at 0.12% of the total government debt. See also:
- 4 -
for inflation indexed bonds could have additional positive effects on the development of the
institutional investor base and enhance savings mobilization in the Czech Republic.
The remainder of the paper is organized as follows. Section 2 provides stylized facts about
the development of government debt, its allocation, and servicing. Section 3 outlines theoretical
underpinnings of the applied approach. Section 4 describes the employed data. Section 5 discusses the
calibration of individual parameters of the model to determine optimal allocation of the Czech
government debt. Section 6 discusses the empirical results. Section 7 conducts a sensitivity analysis.
Section 8 concludes.
2.
Stylized Facts: Management of Government Debt in the Czech Republic
After the Czech Republic’s split from Slovakia in 1993, the debt of the Czech government
grew substantially and increased 10.5 times by 2012. Strong growth of the Czech government debt
occurred also in relation to GDP, albeit with a bit more volatility. The government debt relative to
GDP increased from 15.6 to 45.7 percent, i.e. roughly tripled between 1993 and 2012 (Figure 1; panel
1,1).
Government debt managers in the Czech Republic were thus busy trying to raise the needed
amount of funds while minimizing the cost and risk associated with the chosen funding strategy. Total
debt servicing costs increased almost four times with the increasing level of the debt. Nevertheless, the
government debt managers succeeded in steadily decreasing the debt servicing costs per Czech koruna
of government debt from 9.5% to 3.4% over the 1993-2012 period. Note that this declining trend has
been subject to noticeable volatility around the 1997 banking crisis and the 2008 global financial crisis
(Figure 1; panel 1,2).
More explicitly, the volatility of debt servicing costs (3-year and 5-year rolling standard
deviation; Figure 1; panel 2,1) decreased from 1997 to 2003 and then increased again, with the 5-year
rolling measure of volatility reaching its peak in 2012. This development in the volatility of debt
- 5 -
were indeed achieved at the same level of risk or government debt managers in the Czech Republic
became much more opportunistic in their debt allocation and increased their risk taking. Although
global and domestic factors may have played an important role, the allocation of government debt into
more risky instruments may have been partly responsible as well.
The allocation of Czech government debt across short-term CZK debt, long-term CZK debt,
and long-term foreign currency debt changed substantially over 1993-2012 (Figure 1, panel 2,2).
Around 1993, the debt managers relied on the combination of short-term CZK paper and long-term
foreign currency paper because of underdeveloped domestic markets for government debt. This
combination exposed them to foreign currency and liquidity risks that realized mostly after the 1997
financial crisis when debt servicing costs spiked (Figure 1; panel 1,2 and panel 2,1). Aware of these
risks, debt managers of Czech government debt focused on the development of domestic government
bond market and allocating more debt into medium and long-term government bonds as of 2000. This
reallocation was done at the expense of allocations to short-term bills and foreign currency
instruments, and helped protect debt servicing costs from shocks and decrease their volatility.
However, since 2006, this trend and prudent allocation has been reversed and replaced by greater and
more opportunistic allocation to short-term bills followed by a slowdown and a slight reversal in the
decreasing allocation to foreign currency debt. The latter might have been done for strategic reasons to
preserve the presence and access to international financial markets.
[Figure 1 Here]
3.
Theoretical Underpinnings
As in Giavazzi and Missale (2004), we consider the situation in which a government
implements a budget consolidation plan. Further, the responsibility for financing public debt through
- 6 -
probability of unsuccessful debt consolidation owing to unexpected increase in debt service charges
and debt revaluation through prudent and inexpensive debt financing.
The public debt manager faces a policy tradeoff, however. Less risky debt with low volatility
of debt servicing charges is more expensive, and less expensive debt is more risky and has more
volatile debt servicing charges. In our model, the debt manager can use four possible bonds to finance
government debt: the short-term interest rate bond, inflation-indexed bond, foreign currency bond, and
fixed interest rate bond. In view of its policy tradeoff, the debt manager selects the proportion of
government debt that will be raised through short-term local-currency debt, through foreign-currency
debt, through price-indexed debt, and through long-term local-currency debt.
Government debt grows with increasing servicing costs of short-term public debt in local
currency, public debt in foreign currency, public debt indexed to prices, long-term public debt, and a
primary fiscal deficit. Government debt also grows with its positive revaluation due to changes in
exchange rates, prices, and economic performance.
The constrained optimization problem of the debt manager outlined above is formally
described in Appendix 1. Solving this optimization problem under the employed assumptions gives the
following results for the optimal shares of short-term debt, s*, of foreign currency debt,
q
*, and ofprice-indexed debt, h*.2
y t 1 1
* 1 1
1 1
1 1
1 1
* * 1 1
1 1 1
( B ) ( )
( )
( ) 2 Pr
( ) ( ) 1 2 Pr ( )
t t t
t t
t t t t
T
t t t
t t t t
t
t t t t
B Cov i
Cov y i s
B Var i B Var i
E A B
Cov e i Cov i
q h TP
Var i Var i B Var i
(1)
y t 1 1
* 1 1
1 1
1 1
1 1
* * 1 1
1 1 1
( B ) ( )
( )
( ) 2 Pr
( ) ( ) 1 2 Pr ( )
t t t
t t
t t t t
T
t t t
t t t t
t
t t t t
B Cov e Cov y e
q
B Var e B Var e
E A B
Cov e i Cov e
s h FP
Var e Var e B Var e
(2)
2 Note that because risk and expected costs of debt service both influence the probability of debt stabilization, the objective of
- 7 -
y t
* 1 1
1
1 1
1 1
* * 1 1
1 1 1
( B ) ( )
( )
( ) 2 Pr
( ) ( ) 1 2 Pr ( )
t t t
t t t
T
t t t
t t t t
t
t t t t
B Cov y
h
B Var B
E A B
Cov e Cov i
q s IP
Var Var B Var
(3)
Note that the optimal share of long term debt is given by
* * *
1 s q h . In (1)-(3), yand are elasticities of government budget to GDP with respect to output growth and inflation respectively.
Bt denotes the percentage value of the government debt-to-GDP ratio. Pr denotes probability that the
adopted stabilization plan fails, and Et (At –ΔBt T
) is the planned reduction in the debt-to-GDP ratio
over period T. TPt, FPtand IPt represent the term risk premium, the foreign exchange risk premium
on the local relative to the foreign currency, and the inflation risk premium respectively. Cov(.) stands
for covariance and Var(.) for variance of corresponding variables conditional on information available
at time t.
More specifically, the conditional covariance of two random variables
U
t1 andV
t1 can becomputed as:
1 1 1 1 1 1
1 1 1 1 1
1 1 1 1 1
1 1 1 1
cov (
,
)
(
)
(
)
(
)
(
|
)
(
)
(
|
)
cov (
,
) cov(
,
)
t t t t t t t t t
t t t t t t t
t t t t t t t
t t t t t
U
V
E U
E U
V
E V
U
E U
U
E U
u
V
E V
V
E V
v
U
V
u
v
(18)where t y , , i ,e , y , t
t t t *t
t*, i*t
and * denotes foreign economy variables. The conditional
variance of two random variables
U
t1 andV
t1can then be computed analogously.We use a vector autoregression model of order p (VAR(p) model) to estimate the conditional
covariances and variances:
1 1
t t t
- 8 -
where Wt1
y , , i ,et
t t t
, Bis a matrix of coefficients, andZ
tis a vector of forecast errors whichare serially uncorrelated and have zero mean and unit variance. Note that
B
tE W
t1|
t
. Dthen contains estimates of the conditional covariances and variances of unexpected shocks:
1 1 1 1 1 1 1
1 1 1 1 1 1 1
1 1 1 1 1 1 1
1 1 1 1
var (
)
cov (
,
) cov (
,
) cov (
,
)
cov (
,
)
var (
)
cov (
,
)
cov (
,
)
cov (
,
)
cov (
,
)
var (
)
cov (
,
)
cov (
,
)
cov (
,
)
co
i
t t t t t t t t t t t
t t t t t t t t t t t
t t t t t t t t t t t
t t t t t t
y
y
y
e
y
y
i
e
D
y
i
i
i
e
i
y
e
e
1 1 1
v (
ti
t,
e
t)
var (
te
t)
(20)
The next section links the discussed model variables to observables—that is the data on the
functioning of the macroeconomy of a given country, the Czech Republic in this case.
4.
Data Description
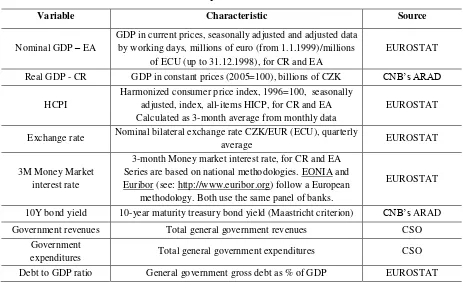
Our study focuses on the Czech Republic and works with the data from the Czech economy.
The foreign economy (rest-of-the world) variables are approximated by data from the Euro Area. To
calibrate the model, including computation of the conditional covariances and variances, we use data
on real GDP for the Czech Republic from the Czech Statistical Office, whereas nominal GDP for the
Euro Area from the Eurostat, harmonized CPI, the nominal CZK/EUR exchange rate, the 3-month
money market rates for the Czech Republic and the Euro Area are from the Eurostat. These data series
are quarterly and span from the first quarter of 1996 to the second quarter of 2013. For the calibration
of model parameters, we use the general government debt to GDP ratio in the second quarter of 2013
from the Eurostat. Further, to calibrate difference in the yields for Czech government bonds issued in
domestic and foreign currency, we use the yields on 10 year government bonds in CZK and EUR in
2012 from the Czech National Bank’s ARAD system and Bloomberg respectively. Government
- 9 -
quarter of 1999 to the second quarter of 2013, because earlier data on the two variables are not
publicly available. All data are described in detail in Table A1 of Appendix 2.
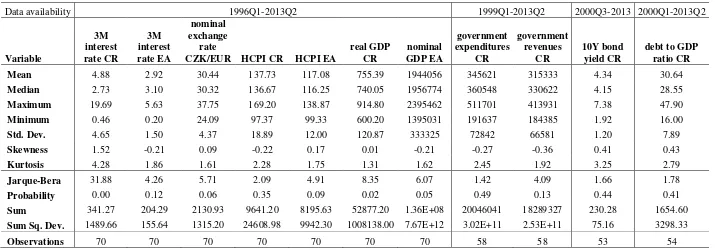
Table A2 of Appendix 2 reports data summary statistics on all variables employed in the
calibration of the model starting at the earliest available observation and ending in the second quarter
of 2013.
5.
Calibration of Parameters of Conditional Covariances and Variances
This section explains in detail how individual parameters entering the computation of the
optimal shares of different bonds in the government debt portfolio in equations (1)-(3) are calibrated.
Recall that the assumed options for the debt manager are to raise government debt using short-term
bonds, foreign currency bonds, price-index bonds and long-term bonds.
5.1. Calibrating parameters
The semi-elasticities of the government budget to GDP ratio to output growth, y, and to
inflation, , were estimated as the respective correlations over 1999Q1-2013Q2. In particular, we calculated ηy as the correlation between quarterly real GDP growth and the government budget to
nominal GDP ratio, and ηπ as the correlation between the quarterly inflation rate and the government
budget to nominal GDP ratio. Note that yequals 0.15 (Table 1), suggesting that the ratio of
government budget to GDP improves when the economy is growing in real terms. The elasticity of the
government budget to GDP ratio to CPI inflation, , is estimated at 0.2. Interestingly, both calibrated parameters happen to be similar to the calibrations used by Giavazzi and Missale for Brazil. The
government debt to GDP ratio, Bt, was set to 46.5 percent in line with the Czech government’s
indebtedness in 2013Q2.
- 10 -
The term premium, TPt, is calculated as the last year (2012Q2-2013Q2) average of the
difference between the yield of 10-year government bonds and the yield of 3-month money market
rate (assumed to track the 3-month Treasury bill rate). The foreign exchange premium on the Czech
koruna vis-à-vis the euro, FPt , is computed as the last year is average of the difference between the
yields on 10 year government bonds issued in CZK and EUR in domestic and euro markets
respectively, less the expected percentage change in the CZK/EUR nominal exchange rate. The latter
was set to zero in line with the random walk hypothesis for the exchange rates.3 The inflation
premium, IPt, is calculated as the last year‘s average of the difference between actual CPI inflation at
time t and the expected CPI inflation conditional on an information set dated t-1. The AR(1) process
was used to generate expected inflation for simplicity. This approach was used because data on
inflation expectations are not readily available and inflation linked bonds are not commonly traded.4
We analyze the sensitivity of our results to each of these parameters later in the paper.
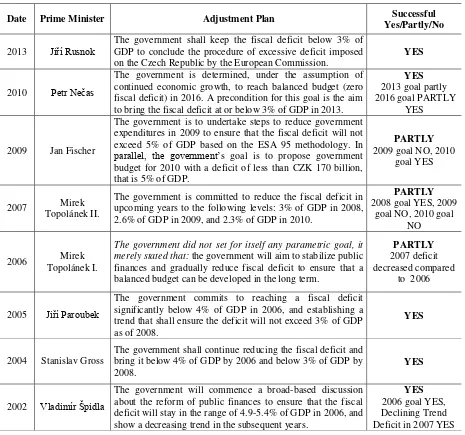
The probability that a given stabilization (fiscal consolidation) plan may fail is initially set at 2
percent following Giavazzi and Missale (2004, p. 9). The probability that a fiscal adjustment in the
Czech Republic will fail could be slightly elevated as broadly illustrated in Appendix 3, Table B1.
From 2002 to 2013, a period for which numerical targets of fiscal adjustment plans are available, most
fiscal adjustment plans could be judged successful, although some of them (2006, 2007, 2009) only
partly. Further research could focus on more careful assessment of the track record of the Czech
government in adhering to its announced stabilization plans, most notably those involving significant
fiscal consolidation. The consolidation plan, the planned reduction in the debt-to-GDP ratio,
1 1
t t tT
E A B
, is initially set to 1 percent. This calibration is consistent with the Czech
government’s plan to gradually decrease fiscal deficits and slowdown debt accumulation, and achieve
3 Past year averages at different points in time suggested switching signs (from appreciation to depreciation) for the average
trend of the exchange rate, concurring with the random walk hypothesis.
4 Note that another simple approximation of inflation expectations could be achieved by using the Czech National Bank
- 11 -
a balanced budget in 2015. We analyze the sensitivity of our results to the two parameters later in the
paper.
5.2.Calibration of conditional variances and covariances
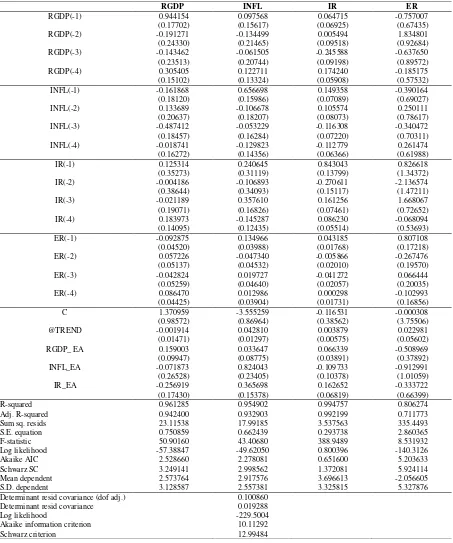
The process of computing conditional covariances and variances consists of the following
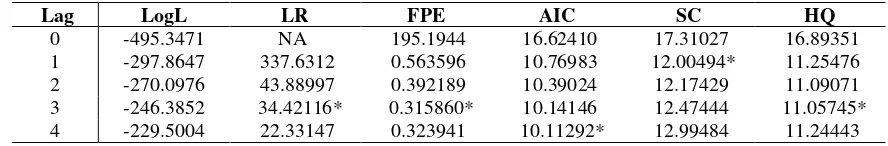
steps. First, we estimate an unrestricted VAR model with four lags (VAR(4)), as suggested by the
Akaike information criterion (see Table A3 in Appendix 2). This longer lag is also theoretically
required because of the year on year differences in variables that we use for the estimation and
forecasts. The year on year differencing introduces up to three quarter autocorrelation by construction.
The VAR contains, as endogenous variables, domestic output growth, inflation, the interest rate, and
the percentage change in the CZK/EUR exchange rate. We use year on year changes in the variables to
ensure that the variables are stationary. In addition, the VAR contains exogenous variables, namely the
constant, time trend, as well as the foreign (Eurozone) output, inflation, and interest rate.
The variables yt, it, πt and et are then calculated as the forecast errors of the VAR model’s
static (one period ahead) forecasts of output growth, inflation, the interest rate, and the change in the
exchange rate. The estimation results for the VAR(4) model are reported in Table A4 in Appendix 2.
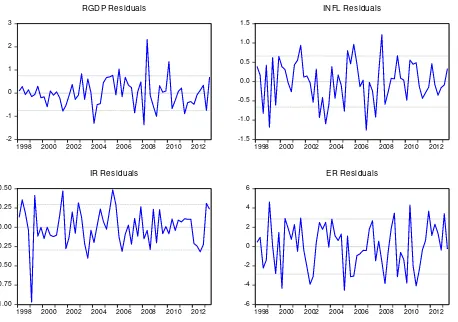
The plots of residuals from the estimated VAR are also reported in Appendix 2 in Figure A1. The
residuals are well behaved apart from two large outliers. First, we can observe an outlier for the
interest rate equation at the beginning of the sample that corresponds to the period before the
1997-1998 financial crisis. Second, we can observe an outlier for the real GDP corresponding to the onset of
the 2008 global financial crisis. Shortening the sample or using a dummy variable to take out the
outliers does not materially change the VAR estimation results.
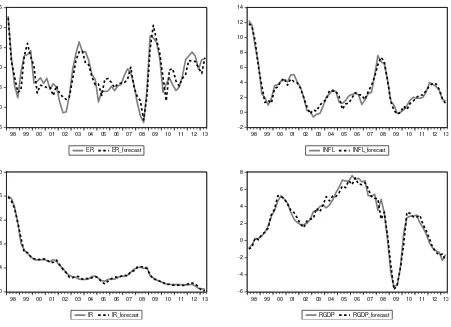
We also inspect the actual and predicted values of the VAR variables to make sure the VAR
performs well for forecasting purposes (Figure A2 in Appendix 2). The estimated VAR performs
- 12 -
(Table A5 in Appendix 2). The relatively worse fit for the exchange rate could be explained by the
traditionally high volatility of exchange rate series that applies also to the CZK/EUR rate.
The calibrated conditional covariances and variances based on the estimated VAR are
reported in Table 2:
[Table 2 Here]
The conditional variances correspond to the variances of forecast errors for individual variables from
the estimated VAR(4). The conditional variance for the exchange rate (the e,e cell) is much larger
compared with other variables whereas the interest rate variance (the i,i cell) is the smallest. Also the
estimated conditional covariances reveal interesting observations for government debt managers in the
Czech Republic that seek to exploit natural hedges for efficient debt portfolio allocation.
Consider the covariances of GDP growth with other variables first. The covariance of GDP
growth and inflation is negative and significant suggesting that business cycles could have been driven
more by supply shocks than demand shocks. This conjecture is consistent with the presence of two
crisis periods that involved deep recessions, in which production capacity diminished, and strong
recoveries followed. This negative covariance could imply that nominal revenues for the Czech
government could be more stable than in other countries in which the business cycle is primarily
driven by demand shocks. The covariance of GDP growth with the interest rate is positive but
insignificant, and its small magnitude suggests a weak transmission channel of monetary policy from
interest rates to GDP growth. The negative sign on the covariance between GDP growth and changes
in the exchange rate is consistent with the covariance between GDP growth and inflation. If GDP
growth is primarily driven by supply shocks, positive supply shocks such as productivity increases
should result in appreciation of CZK vis-à-vis EUR as suggested by the estimated covariance.
Consider the additional covariances of inflation with the remaining variables. The
covariance of inflation with the interest rate is positive and significant in line with the expectation that
monetary policy rates increase when inflation increases. The covariance of inflation with changes in
- 13 -
hypothesis suggests that (other things equal) increasing inflation should result in depreciation of local
currency and an increase in the exchange rate, the estimated negative covariance implies different
transmission mechanism. We conjecture that as inflation increases and interest rates rise, capital
inflows due to the increased interest rate differential could cause the exchange rate to appreciate, at
least in the short term.
Consider the remaining covariance of the interest rate and changes in the exchange rate. The
estimated negative covariance is only marginally significant. The estimate contradicts the hypothesis
of uncovered interest parity. The estimate implies that an increasing interest rate differential on CZK
vis-à-vis EUR shall result in future appreciation of the koruna within the one year horizon presumably
because of higher capital inflows. This is however in line with empirical research suggesting that
uncovered interest parity has a mixed performance and tends to only hold in the medium term (the 2-5
years horizon) (Chinn and Quayyum, 2012).
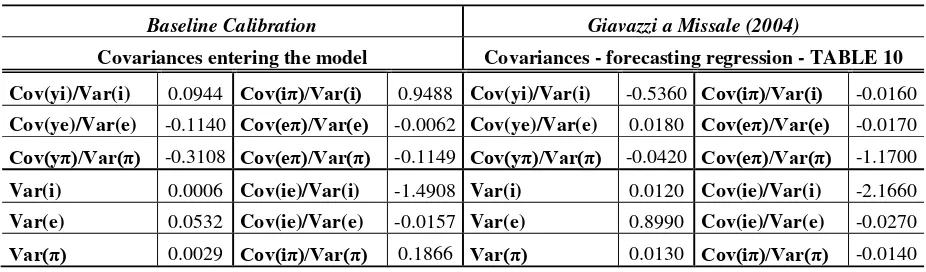
We further compare our calibration of the ratio of the covariances and variances entering
equations (1)-(3) with those used by Giavazzi and Missale (Table A6 in Appendix 2). Overall, our
calibrations differ from those of Giavazzi and Missale. Although the relative magnitudes of our
calibration are in some cases similar (Cov(eπ)/Var(e), Cov(ie)/Var(i), Cov(ie)/Var(e)) to those of Giavazzi and Missale, in other cases, they are in absolute values nine times larger (Cov(yπ)/Var(π)) or ten times smaller (Cov(eπ)/Var(π)) or bear a different sign altogether (Cov(yi)/Var(i); Cov(ye)/Var(e)).
6.
Discussion of Results
Using the baseline calibration of the parameters presented in Tables 1 and 2, and equations
(1)-(3), Matlab’s fsolve function’s solution produces optimal shares for government debt allocation
that are presented in Table 3.
- 14 -
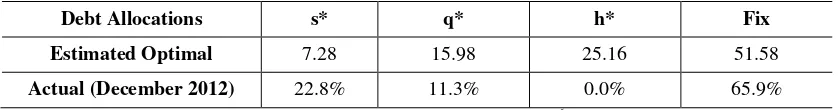
The estimated results suggest that the manager of Czech government’s debt should allocate
7.28% of the debt into short-term CZK bills (T-bills), 15.98% of the debt into foreign currency bonds,
25.16% into CZK inflation-linked bonds, and 51.58% of the debt into long-term fix-rate CZK bonds.
Managing liquidity risks, repayments of longer term bonds, and cash requirements for treasury
operations forces the debt manager to allocate at least a small share of government debt into short-term
bills. We estimate this allocation to be about 7%. We will discuss this number in more detail shortly
when comparing our optimal estimates with the actual allocations implemented by Czech debt
managers.
The allocation of about 16% to foreign currency bonds could be possibly higher given the
negative foreign currency premium and the implied potential savings. The potential cost savings from
a greater allocation of debt into foreign currency are, however, mitigated by the relatively high
conditional variance of the CZK/EUR exchange rate (the size of unexpected change in the exchange
rate), and the significantly negative conditional covariance of the exchange rate with GDP growth. The
former increases overall risk of allocating debt into foreign currency while having revenues in local
currency. The latter suggests that when government revenues decline the CZK tends to depreciate,
thus increasing debt service charges and increasing the CZK equivalent of the EUR denominated debt.
Despite the negative inflation premium (Table 1, IP), the allocation to inflation-linked bonds is
substantial of about 25% of total debt. This result arises mostly because the conditional variance of
unexpected changes in inflation is high and dominates the influence of the negative inflation premium.
Note that the negative inflation premium alone would suggest allocation of Czech government’s
savings (reserves) in CZK inflation-linked paper. In practice, such allocation could be implemented by
the Czech government holding savings (reserves) in inflation-linked paper issued by the Czech
National Bank (CNB). Apart from benefiting from the negative inflation risk premium—that is, actual
inflation lower than the expected one priced in by the market—the inflation-linked paper issued by the
CNB would also hold the bank accountable for systematically undershooting its inflation target and
- 15 -
In theory, an increasing probability that the government will fail to fully implement its debt
consolidation program increases the desired allocations to long-term debt. Because an increase in the
probability of future failure of the consolidation program will result in increasing financing costs for
the government, locking into a lower fixed rate enables debt managers to protect the government
budget from unexpected increases in future debt service charges. For the Czech government, the
probability of failure to implement its consolidation program could be slightly elevated (Appendix 3).
This shows up in the estimated optimal allocation of about 52% in medium to long-term CZK debt.
Table 3 also shows the latest available data from 2012 on the actual allocation of Czech
government debt across the considered options. The actual allocations are in some cases noticeably
different from the estimated optimal ones. As discussed, one factor that could explain the mismatch
between the actual and the optimal debt allocations is the underdeveloped market for inflation-linked
bonds. But other factors could also play a role. Debt managers in the Czech Republic could be rather
opportunistic in debt allocation overweighting perceived savings from larger allocation into short-term
debt over the refinancing risk that derives from such allocation. However, one consideration that we
have ignored, and that could justify larger allocations to short-term bills, are possibly larger cash
management needs of the Czech government throughout the fiscal year to smooth the differences
between the collation of government revenues and execution of government expenditures. Such needs
could arise, for example, because of expected seasonality in government revenues that mismatch the
government expenditure plans or from an overall inefficient implementation of government budget
plans.
Finally, the near zero actual allocation of government debt to CZK denominated
inflation-linked instruments is due to the fact that these instruments are not commonly issued by MoF, or
otherwise commonly traded in the market. However, the estimated optimal allocation for Czech
government debt implies the Czech government should further develop the market for inflation index
bond to better protect its debt portfolio and the government budget from unexpected changes in debt
servicing costs; notwithstanding the additional positive effects this development could have on the
- 16 -
7.
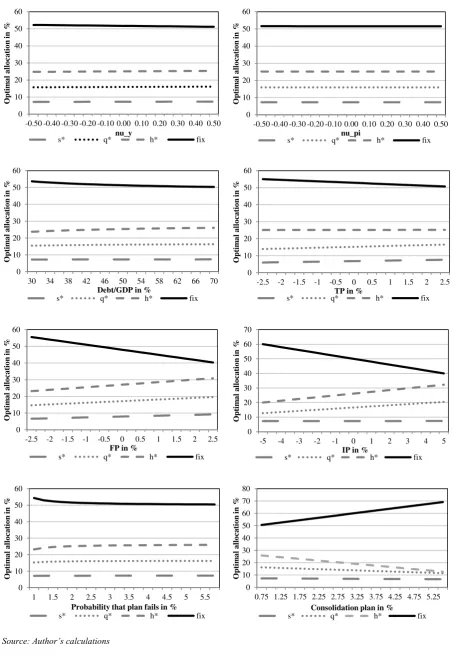
Sensitivity Analysis
As in any calibration or estimation approach, there is some uncertainty around the calibrated
parameters. This uncertainty could be even more important for results obtained from a non-linear
model like ours. For that reason, we conduct a sensitivity analysis regarding the calibrated parameters.
Such analysis shall also test the robustness of our results and gain further insights into the applicability
of the results in various circumstances that the debt manager can be faced with in the future. More
specifically, we vary the model parameters within a plausible range around their calibrated values, and
examine how the estimated optimal shares of foreign currency, short-term local currency,
inflation-indexed, and long-term local currency debt change in response. The results of such sensitivity analysis
are plotted in Figure A3 in Appendix 2.
Overall, our results are rather insensitive to changes in single parameters, except for the
foreign currency and inflation risk premiums (FP, IP), and the extent of the consolidation plan (the
size of budget adjustment). An increasing foreign exchange premium implies progressively greater
optimal allocations to foreign currency bonds and inflation-indexed bonds and smaller allocations into
long-term bonds. The sensitivity results suggest that if uncertain about the FP value, debt managers
should gravitate to more conservative allocations into local currency. The baseline results are also
sensitive to changes in the IP. Negative IP suggests that future actual inflation will be on average
greater than expected, and encourages allocation of government savings (reserves) in inflation-linked
papers. In contrast, positive IP encourages some borrowing in CZK denominated, inflation-linked
bonds.
The optimal debt allocation is similarly sensitive to how ambitious the fiscal consolidation
plan is. A more ambitious consolidation plan implies greater allocations towards long-term fixed rate
debt. This result could seem counter-intuitive if debt management is part of the fiscal savings efforts
- 17 -
plan will likewise increase. However, if debt management is independent and not part of the fiscal
consolidation plan, as argued by Wheeler (2004), the implications are different. The results suggest
that in a risk neutral environment government consolidation may require stable debt service charges
that do not introduce an unexpected cost to the budget.5 A greater allocation to fixed rate bonds is then
justified.
8. Conclusion
Sound debt management practices can help avoid unexpected increases in debt services
charges, reduce debt vulnerability to macroeconomic and financial shocks, and thus prevent the
occurrence of debt crises. This paper carried out an empirical analysis of the optimal debt allocation
for the Czech Republic using the approach of Giavazzi and Missale (2004) and an estimated VAR
model for the Czech macroeconomy.
The estimation results suggest that the Czech government should allocate most of its debt
(about 52%) to long-term fixed-rate bonds. This is a smaller share than the Czech Ministry of Finance
(CMoF) allocated to this instrument by end-2012 (65.9%). Further, the CMoF should allocate about
25% of its debt to inflation-linked bonds. Currently, such instrument is not widely used by debt
managers in the Czech Republic and the corresponding market is underdeveloped. The results
substantiate considerable efforts that the debt managers in the Czech Republic should devote to
developing the market for inflation-linked bonds. The CMoF can draw on examples of other countries
that have developed markets for inflation-linked bonds such as France, Germany, Italy and Sweden.
The CMoF’s allocation into foreign currency bonds of 11% is broadly aligned with the
suggested optimal allocation of 16%, given the uncertainty about the foreign currency premium. In
contrast, the CMoF’s allocation to short-term bills of 23% is significantly above the suggested optimal
5 Strategic interactions between the government and the central bank (the monetary-fiscal mix) as well as
- 18 -
allocation of about 7% and could be introducing excessive risks to the debt portfolio under the
assumed risk neutral preferences. In practice, the CMoF allocation to short-term bills could be driven
by inefficiencies that are out of the debt manager’s control, and could stem from inefficient cash
management or implementation of budget plans, including tax collection and government
expenditures.
More research is needed to aid formulation of robust government debt management strategies
in the Czech Republic, and this paper is one of the first attempts in this direction. More broadly,
further research is warranted on the optimal allocation of debt in emerging market economies that
typically face a broader set of challenges than advanced economies, including those due to political
- 19 -
References
BOHN, H., 1990, ‘Tax Smoothing with Financial Instruments’,American Economic Review, vol. 80
No. 5, pp. 1217-1230.
BOHN, H., 1998. ‘The Behavior of U.S. Public Debt and Deficits,’ The Quarterly Journal of
Economics, MIT Press, vol. 113(3), pp. 949-963, August.
BUERA, F., NICOLINI, J. P., 2002. ‘Optimal Maturity of Government Debt without State Contingent
Bonds’, Universidad Torcuato Di Tella, DoE Working Papers 016.
BULIR, A., 2004. ‘External and Fiscal Sustainability of the Czech Economy: A Quick Look Through
the IMF’s Night-Vision Goggles‘, CNB Internal Research and Policy Note, 4/2004.
CHINN, M. D., QUAYYUM, S., 2012. ‘Long Horizon Uncovered Interest Parity
Re-Assessed‘,National Bureau of Economic Research, Inc., Cambridge, NBER Working Paper
No.18482.
DYBCZAK, K., MELECKY, M., 2014. ‘EU fiscal stance vulnerability: Are the old members the gold
members?‘Economic Modelling, Elsevier, vol. 38(C), pp 87-101.
EUROPEAN COMMISION, 2012. ‘Fiscal Sustainability Report 2012‘, European Economy 8/2012,
Economic and Financial Affairs 2012, Available from:
http://ec.europa.eu/economy_finance/publications/european_economy/2012/pdf/ee-2012-8_en.pdf.
GERARD, M., GILSON, N., 2001. ‘Public debt structure and exchange rate regime’, Dipartimento di
Economia Politica dell'Università di Milano Bicocc Working Paper.
GIAVAZZI, F., MISSALE, A., 2004. ‘Public Debt Management in Brazil’, National Bureau of
Economic Research, Inc., Cambridge, NBER Working Paper No.10394.
HAWKESBY, C., WRIGHT, J., 1997, ‘The Optimal Public Debt Portfolios for Nine OECD
Countries: A Tax-Smoothing Approach’, University of Auckland Working Paper.
IMF AND THE WORLD BANK, 2001. ‘Guidelines for Public Debt Management‘, Washington D.C.,
- 20 -
IMF, 2013. ‘Czech Republic, 2013 Article IV Consultation‘, IMF Country Report No. 13/243,
Washington D.C., Available from: http://www.imf.org/external/pubs/ft/scr/2013/cr13243.pdf .
LIBICH, J., STEHLIK, P., 2012.’Monetary Policy Facing Fiscal Indiscipline under Generalized
Timing of Actions‘, Journal of Institutional and Theoretical Economics, vol. 168(3), pp.
393-431.
MATALIK, I., SLAVIK, M., 2005. ‘Debt Management in the Czech Republic (formation in the 1990s
and the current state) ‘. Prague Economic Papers vol. 1, pp. 33-50.
MELECKY, A., MELECKY, M., 2012. ‘The Impact of Macroeconomic Shocks on the Government
Debt Dynamics: How Robust is the Fiscal Stance of the Czech Republic?‘, Politická
ekonomie, University of Economics, Prague, vol. 2012(6), pp 723-742.
MELECKY, M., 2012a. ‘Formulation of Public Debt Management Strategies: An Empirical Study of
Possible Drivers‘,Economic Systems, Vol. 36, pp. 218-234.
MELECKY, M., 2012b. ‘Choosing The Currency Structure Of Foreign‐Currency Debt: A Review Of
Policy Approaches‘,Journal of International Development, Vol.24, pp. 133-151.
MELECKY, M., 2010. ‘Currency Allocation of Public External Debt and Synchronization Indicators
of Exchange Rate Volatility‘,Comparative Economic Studies 52 (2010), pp. 104-129.
MISSALE, A., 1997. ‘Managing the Public Debt: The Optimal Taxation Approach‘, Journal of
Economic, Surveys vol. 11 (3).
MISSALE, A., BLANCHARD, O. J. (1991). ‘The Debt Burden and Debt Maturity‘, NBER Working
Paper, No. 3944.
SARGENT, T. J., WALLACE, N., 1981, ‘Some Unpleasant Monetarist Arithmetic‘, Quarterly
Review, Vol. 5, No. 3. Federal Reserve Bank of Minneapolis.
WHEELER, G., 2004. Sound Practice in Government Debt Management, International Bank for
- 21 -
Tables in the Main Text
Table 1: Calibration of input parameters
Parameter Description Baseline
Calibration
Giavazzi & Missale (2004)
Calibration
ηy Elasticity of government budget to GDP with respect to output 0.15 0.2
ηπ Elasticity of government budget to GDP with respect to inflation 0.20 0.2
Bt Government debt to GDP (2nd quarter 2013), (in %) 46.5 57.2
TPt Term premium (last year average), (in %) 1.47 2.5
FPt Foreign Exchange Premium on CZK (last year average), (in %) -1.19 4.3
IPt Inflation premium(last year average), (in %) -0.39 1.9
Pr Probability that stabilization plan fails, (in %) 2 2
Et(At-delthaBt T
) Planned reduction in debt-to-GDP ratio over T, (in %) 1 1
[image:23.595.175.419.381.502.2]Source: Authors’ calculations
Table 2: Calibration of conditional covariances and variances
Variance - Covariance matrix
y Π i e
y 0.367
-0.089 (0.040)
0.005 (0.018)
-0.607 (0.161)
π 0.286 (0.015) 0.053
-0.033 (0.158)
i 0.056
-0.084 (0.069)
e 5.325
Source: Authors’ calculations
[image:23.595.89.508.578.633.2]Note: Standard errors in the parentheses
Table 3: Estimated optimal debt allocation and actual allocation of Czech Government Debt
Debt Allocations s* q* h* Fix
Estimated Optimal 7.28 15.98 25.16 51.58
Actual (December 2012) 22.8% 11.3% 0.0% 65.9%
Source: Authors’ calculations; CMoF Development of the Government debt.6
Note:s* - short-term floating-rate debt, q* - foreign-currency denominated debt, h* - inflation-indexed debt, and fix - long-term fixed-rate debt, which is computed as 1-s*-q*-h*
6
Available at:
- 22 -
Figures in the Main Text
Figure 1: Czech government debt (top panels) and Debt servicing costs (bottom panels)
Source: CMoF and authors’ calculations
0% 5% 10% 15% 20% 25% 30% 35% 40% 45% 50%
0 200 400 600 800 1000 1200 1400 1600 1800
1995 1998 2001 2004 2007 2010
Government debt, bln. CZK
Debt/GDP, %
0 10 20 30 40 50 60
1993 1996 1999 2002 2005 2008 2011 0% 2% 4% 6% 8% 10% 12%
Total (left axis, CZK bln.) Debt service cost per CZK of debt
0% 5% 10% 15% 20% 25%
1997 2000 2003 2006 2009 2012
3-y rolling S.D. 5-y rolling S.D.
0% 10% 20% 30% 40% 50% 60% 70% 80% 90%
1993 1996 1999 2002 2005 2008 2011
- 23 -
APPENDIX 1
The Optimization Problem of the Government Debt Manager
As in Giavazzi and Missale (2004), the debt manager tries to solve the following optimization
problem:
A. Objective Function
1 1
t+1 1
, , Prob X>A , , T
t t
T
t t t
s q h s q h
A B
Min E B Min E X dx
.
(1)
By choosing the proportion of public debt to be raised through short-term debt, s, foreign currency
debt, q, price-indexed debt, h, and long-term debt (1-s-q-h), it minimizes the probability that the
intended fiscal adjustment will fail due to unexpectedly high debt service charges or debt revaluation.
t
E is expectation conditional on information available at time t. At+1is the expected adjustment, X
denotes the uncertain component of the fiscal adjustment, Bt1is the debt-to-GDP ratio, and BtT1 is the
trend debt ratio—that is, the debt ratio that would exist in period t + 1 in the absence of the fiscal
correction.
B. Constraints
The debt ratio rises if interest payments increase, primary budget surplus decreases, nominal
GDP grows, or domestic currency depreciates, which affect the value of foreign currency debt. The
nominal rate of return on fixed rate bonds is known at the time of issuance and equals to the long-term
interest rate (Rt):
1 1 1 1 1 1 1
T T T
t t t t t t t t t t t
B B B IB eqB S y B
- 24 -
where T1 T1
t t t
B B B
is the debt accumulation, It1Bt are the nominal interest payments, et is the log
of nominal exchange rate, q is the share of euro denominated bonds, T1 t
S is the trend primary surplus,
1
t
y is the log of output, and t1 is the rate of inflation.
The interest payments are as follows:
*
1 1 1 1
I
t t t t t t t t t t t t
I B isB R RP qB R hB R s q h B
.
(3)
where Rt *
is the foreign interest rate, Rt I
isthe real interest rate known at the time of issuance and πt+1 is
the rate of inflation in the following period. it+1 is the average interest rate between period t and t+1
known at time t. The return on euro denominated bonds
*
11
t t t
R RP e is approximated by the
sum of the foreign interest rate and the risk premium (Rt+RPt).
The ratio of the trend primary surplus to GDP is uncertain, since it depends on cyclical
developments of GDP and inflation:
1 1 1 1 1 1
T T
t t t y t t t t t t
S E S y E y E
.
(4)
where StT1 is the ratio of trend primary surplus to GDP, y is the semi-elasticity of government
budget (relative to GDP) with respect to output, is the semi elasticity of budget with respect to the price level andEt are the expectations conditional on the information at time t.
C. First Order Conditions
The government selects shares of debt instruments with respect to the first order conditions
(5)-(7). The debt structure is optimal only if increased probability of failure is equalizes across debt
instruments.
1 T1
1
0t t t t t
E A B i R
(5)
*1 T1 1 0
t t t t t t t t
- 25 -
1 T1
I 1 0t t t t t t
E A B R R
(7)
where 1 T1
t t
A B is the planned reduction in the debt to GDP ratio and
1 1
T
t t
A B
is a function of
s, q and h.
D. Assumed Behavioral Relationships
Based on the Giavazzi and Missale’s framework, the following behavioral relationships are
assumed. The difference between interest costs of short rate bonds and fixed rate bonds is given by the
deviation of the average short rate from its expected value and the term premium (TPt) on fixed rate
bonds:
1 1 1
t t t t t t
i R i E i TP. (8)
The term premium is calculated from the true term premium ( I t
TP ) and informational spread:
1 1
I I
t t t t t t
TP TP E i E i , (9)
where I t
E are investor’s expectations.
The difference between the return on the euro denominated bonds (expressed in Czech
koruna) and the return on fixed rate bonds is influenced by the deviation of average exchange rate
from the expected exchange rate and the exchange rate risk premium:
*
1 1 1
t t t t t t t t t
R RPe e R e E e FP . (10)
The foreign premium is calculated from the true term premium ( I t
FP ) and informational
spread:
1 1
I I
t t t t t t
FP FP E e E e , (11)
where I t
- 26 -
The difference between interest costs of price-indexed bonds and fixed rate bonds is given by
the deviation of the average inflation rate from the expected inflation rate and the inflation risk
premium (IPt):
1 1 1
I
t t t t t t t
R R E IP
.
(12)
The inflation premium is calculated from the true premium ( I t
IP ) and informational spread:
1 1
I I
t t t t t t
IP IP E E . (13)
where I t
E are investor’s expectations.
E. Triangular Approximation of Distribution
To estimate the probability distribution function ( )X , Giavazi and Missale take a linear approximation of ( )X across bad realizations of the fiscal adjustment X>0. This approximation yields the triangular probability density function described in (14). Greater bad realizations are thus
less likely to occur than smaller ones
X 2X XX
.
(14)
F. The Solution
Using (14), substituting (8)-(13) into (5)-(7), and rearranging gives the following solutions for
the optimal shares of short-term debt, s*, foreign currency debt, q*, inflation-linked bonds, h*, and
fixed rate debt (1-s*-q*-h*):
y t 1 1
* 1 1
1 1
1 1
1 1
* * 1 1
1 1 1
( B ) ( )
( )
( ) 2 Pr
( ) ( ) 1 2 Pr ( )
t t t
t t
t t t t
T
t t t
t t t t
t
t t t t
B Cov i
Cov y i s
B Var i B Var i
E A B
Cov e i Cov i
q h TP
Var i Var i B Var i
- 27 -
y t 1 1
* 1 1
1 1
1 1
1 1
* * 1 1
1 1 1
( B ) ( )
( )
( ) 2 Pr
( ) ( ) 1 2 Pr ( )
t t t
t t
t t t t
T
t t t
t t t t
t
t t t t
B Cov e Cov y e
q
B Var e B Var e
E A B
Cov e i Cov e
s h FP
Var e Var e B Var e
,
(16)
y t
* 1 1
1
1 1
1 1
* * 1 1
1 1 1
( B ) ( )
( )
( ) 2 Pr
( ) ( ) 1 2 Pr ( )
t t t
t t t
T
t t t
t t t t
t
t t t t
B Cov y
h
B Var B
E A B
Cov e Cov i
q s IP
Var Var B Var
- 28 -
APPENDIX 2
[image:30.595.66.529.147.429.2]Tables
Table A1: Description of data and data sources
Variable Characteristic Source
Nominal GDP – EA
GDP in current prices, seasonally adjusted and adjusted data by working days, millions of euro (from 1.1.1999)/millions
of ECU (up to 31.12.1998), for CR and EA
EUROSTAT
Real GDP - CR GDP in constant prices (2005=100), billions of CZK CNB’s ARAD
HCPI
Harmonized consumer price index, 1996=100, seasonally adjusted, index, all-items HICP, for CR and EA Calculated as 3-month average from monthly data
EUROSTAT
Exchange rate Nominal bilateral exchange rate CZK/EUR (ECU), quarterly
average EUROSTAT
3M Money Market interest rate
3-month Money market interest rate, for CR and EA Series are based on national methodologies. EONIA and Euribor (see: http://www.euribor.org) follow a European
methodology. Both use the same panel of banks.
EUROSTAT
10Y bond yield 10-year maturity treasury bond yield (Maastricht criterion) CNB’s ARAD
Government revenues Total general government revenues CSO
Government
expenditures Total general government expenditures CSO
Debt to GDP ratio General government gross debt as % of GDP EUROSTAT
Note: CR = Czech Republic, EA = Euro Area (EA11-2000, EA12-2006, EA13-2007, EA15-2008, EA16-2010, EA17). CNB = the Czech National Bank, CSO = the Czech Statistical Office. Government revenues and expenditures were obtained from:
- 29 -
Table A2: Data summary statistics
Data availability 1996Q1-2013Q2 1999Q1-2013Q2 2000Q3-2013 2000Q1-2013Q2
Variable
3M interest rate CR
3M interest rate EA
nominal exchange
rate
CZK/EUR HCPI CR HCPI EA
real GDP CR
nominal GDP EA
government expenditures
CR
government revenues
CR
10Y bond yield CR
debt to GDP ratio CR
Mean 4.88 2.92 30.44 137.73 117.08 755.39 1944056 345621 315333 4.34 30.64
Median 2.73 3.10 30.32 136.67 116.25 740.05 1956774 360548 330622 4.15 28.55
Maximum 19.69 5.63 37.75 169.20 138.87 914.80 2395462 511701 413931 7.38 47.90
Minimum 0.46 0.20 24.09 97.37 99.33 600.20 1395031 191637 184385 1.92 16.00
Std. Dev. 4.65 1.50 4.37 18.89 12.00 120.87 333325 72842 66581 1.20 7.89
Skewness 1.52 -0.21 0.09 -0.22 0.17 0.01 -0.21 -0.27 -0.36 0.41 0.43
Kurtosis 4.28 1.86 1.61 2.28 1.75 1.31 1.62 2.45 1.92 3.25 2.79
Jarque-Bera 31.88 4.26 5.71 2.09 4.91 8.35 6.07 1.42 4.09 1.66 1.78
Probability 0.00 0.12 0.06 0.35 0.09 0.02 0.05 0.49 0.13 0.44 0.41
Sum 341.27 204.29 2130.93 9641.20 8195.63 52877.20 1.36E+08 20046041 18289327 230.28 1654.60
Sum Sq. Dev. 1489.66 155.64 1315.20 24608.98 9942.30 1008138.00 7.67E+12 3.02E+11 2.53E+11 75.16 3298.33
Observations 70 70 70 70 70 70 70 58 58 53 54
- 30 -
Table A3: VAR lag length selection
Lag LogL LR FPE AIC SC HQ
0 -495.3471 NA 195.1944 16.62410 17.31027 16.89351
1 -297.8647 337.6312 0.563596 10.76983 12.00494* 11.25476
2 -270.0976 43.88997 0.392189 10.39024 12.17429 11.09071
3 -246.3852 34.42116* 0.315860* 10.14146 12.47444 11.05745*
4 -229.5004 22.33147 0.323941 10.11292* 12.99484 11.24443
Source: Author’s calculations