http://www.scirp.org/journal/ajibm ISSN Online: 2164-5175
ISSN Print: 2164-5167
High-Speed Railways’ Impact on the
Connection of Cities along the Line
Based on the Analysis of Micro-Blog Data
Chaopeng Li
Institute of Regional Development, College of Economics, Jinan University, Guangzhou, China
Abstract
Based on micro-blog big data, this article will conduct an analysis on the fol-low-up data of every prefecture-level city’s micro-blog data and these cities all lie along the Beijing-Guangzhou High-Speed Railway. Then we found that the asymmetry lied in the connection between these cities and there was a provin-cial-level barrier among them. By comparing the situation before and after the operation of high-speed railway, we realize that this kind of provincial-level bar-rier still exists. Meanwhile, as the Beijing-Guangzhou High-Speed railway is put into operation and the connection among the cities along the railway has been strengthened, the connection presents the tendency of decentralization.
Keywords
High Speed Railway, Urban Contact, Asymmetry, Provincial-Level Barrier, Decentralization
1. Introduction
Urban linkages are one of the important factors influencing the development of a city and urban agglomeration. The state of urban contact is determined by various factors, and traffic is an active factor. China opened the Beijing-Tianjin intercity high-speed rail in 2008, and the high-speed rail significantly enhanced the linkage between the two cities. Since then, the high-speed railway has be-come a new factor affecting the city’s development. From 2008 to 2014, the number of high-speed rail passengers increased from 128 million to 820 million. In 2014, the average daily volume of railway passengers was 6.077 million; the average daily volume of high-speed rail was 2.253 million, accounting for about 37%. In recent years, with the rapid development of high-speed railway in Chi-na, the main framework of “four vertical and four horizontal” national high- How to cite this paper: Li, C.P. (2017)
High-Speed Railways’ Impact on the Con-nection of Cities along the Line Based on the Analysis of Micro-Blog Data. American Journal of Industrial and Business Manage- ment, 7, 566-580.
https://doi.org/10.4236/ajibm.2017.75042
Received: April 6, 2017 Accepted: May 14, 2017 Published: May 17, 2017
Copyright © 2017 by author and Scientific Research Publishing Inc. This work is licensed under the Creative Commons Attribution International License (CC BY 4.0).
speed rail network is basically formed. Supplemented by extension lines and network lines, high-speed railways basically cover cities which have more than 500,000 people. This marks the arrival of the high-speed rail era. High-speed railway on China’s economic and social development has brought a profound impact and changed the domestic socio-economic forms. The open of high- speed rail network makes the relationship between cities more closely, and changes the spatial network structure of the city. So what influence does the de-velopment of high-speed railways have on the urban linkages? This is the atten-tion of the majority of scholars. However, the lack of open city passenger and other elements of the flow data, limits the direct observation of urban linkages under the impact of high-speed railway, which is a problem that plagues the re-lated research.
This paper intends to collect large data from social networks and measure the impact of high-speed railways on urban linkages. The main question to be solved in this paper is whether high-speed railways have changed the pattern of urban linkages along the route? If changed, then, what’s the direction and the extent of the change? At the same time, this article also attempts to use the social network data with the direction of the property to further analyze urban asymmetry and determine the interaction model between cities. It should be noted that, al-though the asymmetry of urban contact exists objectively, these public data do not have direction attribute, so urban contact can’t be observed and analyzed. While the use of social network data is expected to make a breakthrough in this regard. The analysis of the unidirectional, bi-directional and overall relationship between the characteristics of the relationship between cities or regions to reveal the real linkages, dependencies and impact is very helpful.
2. Literature Review
Urban linkages refer to the flow of funds, resources, information, human capital and other factors between cities. The urban network has directional characteris-tic. The impact of research on urban linkages needs to address two key issues. The first one is the data source; the second one is the calculation method. The academic community has done positive exploration to solve these two issues.
In terms of methods, Bingrong Leng et al. found that urban networks exhibit high clustering coefficients and short path “small world” network characteristics [4]. Pengfei Ni et al. built an interlocking network model with the distribution characteristics of the office network of the productive service enterprises to measure the degree of contact between Chinese cities [5]. Yongling Yao et al.
analyzed the concrete manifestations of the differences between cities on the ba-sis of Taylor, and analyzed the different levels of dynamic factors influencing the inter-city contact level [6]. Zhengbing Liu et al. analyzed regional spatial linkag-es and urban network structurlinkag-es through intercity rail and highway passenger trips [7]. Zhongchen Yang et al. used passenger data to analyze the city’s foreign traffic convenience and contact pattern [8].
With the development of the Internet and the availability of network data, some scholars began to study social and economic activities through network data. Dunbar et al. found that the online social network structure can reflect the social network structure in the real world, and they have very similar characte-ristics [9]. There are many literatures on social network data analysis at home and abroad, such as Twitter and social economy characteristics [10], geographic support and major disaster management [11], geography research based on mi-cro-blog network information [3]. Michael et al. used the Twitter data to analyze the US people’s health food and unhealthy food preferences of the regional dis-tribution characteristics [12].
Overall, the study of economic linkages between cities mostly uses the gravita-tional model which is based on the construction of accessibility. However the gravitational model to measure the degree of economic linkage between cities has its own limitations. The first one is the degree of connection is a potential possibility; and the second one is the gravitational model can’t reflect the direc-tion of contact, and one-way associadirec-tion can reveal a deeper link age network between cities. Scholars are eager to solve these two problems in applied re-search. What’s more, most of the existing urban network analysis is a static analysis of network linkages.
The Micro-blog data that reflects the direct contact between cities can be a good solution to solve these two problems. This paper uses Micro-blog data to solve the direction of city’s linkage, active and passive issue which is city i is more concerned about city j, or City j is more concerned about city i, and this can further analyze which ones are “core” in the pattern of mutual attention and which ones are “marginal” in the pattern of mutual attention. The innovation of the research is that we use inter-city Micro-blog data to simulate inter-city lin-kages and the degree of attention, which can’t be solved by using the traditional method. It’s rare to use Micro-blog data to analyze the change of city’s contact and attention which is caused by the opening of high-speed rail, so we try to do this analysis.
3. Research Methods
3.1. Data Sources and Processing
since 2010, which allows users to focus reviews and change information on plat-form. The linkage of point and edge which represents micro-blog users and the number of evaluation and forwards microblog has formed a social network. Based on the huge micro-blog data, we can do a lot of research, such as “small world network” analysis can be studied through the linkage node and chain node, power rate distribution can be studied through the node’s entry degree and exit degree, micro-blog user characteristics can be studied through micro- blog contents and forwards. This paper constructs a social network system by using city’s micro-blog two-way frequency which are the prefecture-level city along the high-speed rail, and then study its internal structure and characteristic changes after the opening of high-speed rail.
We can get the dynamic time and space model of city’s contact through cap-turing and analyzing the different periods of micro-blog data. Micro-blog as a dynamic social network platform provides a search page; we can retrieve the number of micro-blog which meets conditions through searching messages such as time range, city’s location and keywords, so we prepared a web crawler to si-mulate the page search process. In addition, Micro-blog provides a search page. The search page not only shows the first 50 pages of the Microblog, but also dis-plays the number of microblogs which meet the conditions in the bottom of the page. According to the time range, the city and keywords, we can get the number of eligible Micro-blog. Through the micro-blog application program interface (API) and the preparation of the reptile program, we obtained a large amount of data from the micro-blog users of the 24 prefecture-level cities along the Beijing- Guangzhou high-speed railway, and the data is from January 2010 to November 2014.Through data extraction, we get the number of micro-blog which is about city i refers to city j.
3.2. Urban Contact Measurement Method
We use social media data to analyze the linkage between cities along the Beijing- Guangzhou high-speed rail, the linkage is about the number of micro-blog which is about city i refers to city j, The association between such cities is bi-di- rectional asymmetry. The greater the number of microblogs mentioned by a city to another city, the closer the city is to that city. Firstly, through averaging the monthly data for one year as the annual average data to reduce volatility and improve the robustness of the data; secondly, the temporal and spatial volatility of intercity linkage is observed by analyzing the continuity of the monthly data.
show a typical network structure, and this relationship mainly exist between the provincial cities, non-provincial cities to other province’s provincial capital ci-ties, and cities in the same province.
According to the system of prefecture-level cities along high-speed railway, we respectively calculate the two-way association between cities, bidirectional cor-relation, center degree, inter-city correlation coefficient, network connection degree and urban impact index. This paper uses the following algorithm to measure the characteristics of the prefecture-level city network system along the high-speed rail. That is, using the entry degree, exit degree, the center degree which describes the two-way association between cities to observe the overall situation of a city’s external relations; then using standardized data to observe the distribution of a city’s attention on other cities’ along the high-speed rail. The software used in the empirical analysis is MATLAB R2013a.
3.2.1. The Two-Way Association between Cities
In the micro-blog data, Pij is the number of micro-blog which is about city i re-ferring to city j, that is city i’s attention on city j, Pji is the number of micro-blog which is about city j referring to city i, that is city j’s attention on city i. Pij represents the directional connection between city i and city j and the values of them are different; each city as a node, the directional connection between cities as a weighted side, so that it constitutes a social network. In the social network, entry degree and exit degree are important indicators to measure node characte-ristics.
We define A as entry degree, which is about other cities’ attention on city i, and the formula is as follows:
(
)
ij j i ij i j PA i j
P
=
∑
≠∑ ∑
(1)Similarly, we define B as exit degree, which is about city i’s attention on other cities, and the formula is as follows:
(
)
ji j i ij i j PB i j
P
=
∑
≠∑ ∑
(2)3.2.2. Center Degree
The center degree reflects the status of a single city in the whole city network, the right of ownership, and the position of the occupied position. We define L as the center degree, and we use the harmonic average to calculate entry degree and exit degree to evaluate the center degree of one city. The formula is as follows:
(
)
2 i i i
i i
A B
L i j
A B
= ≠
+ (3)
3.2.3. Inter-City Correlation Coefficient
We use the following algorithm to express the directional strength between the two:
(
)
ij ij ij j pC i j
P
= ≠
∑
(4)Since the city i and the city j are bidirectional, we use the following algorithm to express the difference between the two interrelated correlation coefficient:
ij ij ji
D =C ∗C (5)
3.2.4. Network Connectivity
Let Max (Cij) = 100, use the maximum standardization:
( )
100 Max ij ij ij D D D′ = ∗ (6)
ij
D′ is the maximum value of the interconnected degree between city i and j.
(
)
i ij
E = ΣD′ i≠ j (7)
Ei is the network connectivity of city i.
3.2.5. Urban Impact Index
The city impact index indicates the ability of a city to influence other cities, de-fined as:
(
)
1 ji i i CF i j
n
= ≠
−
∑
(8)Fi represents the influence of the city i, representing the degree of dependence of other cities on city i.
4. Result Analysis
In the analysis of the results, firstly we observe whether the inter-city linkage has changed after the opening of the high-speed railway; secondly we analyze the performance of the change at the spatial level, thirdly we analyze the change in the time series. We use the analysis of these three aspects to find the characteris-tics of urban linkages. We distinguish five phenomena as follows: (1) a city not only attentions about other cities but also is concerned by other cities; (2) the overall change in the degree of attention among all the cities; (3) the degree of attention between cities after the opening of high-speed railway; (4) whether the degree of attention between cities is related to the level of the city; (5) whether the degree of attention is related to the spatial distance between each other.
4.1. Analysis of the Differences in the Two-Way
Relationship between Regions
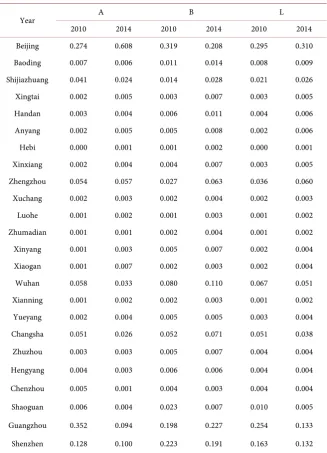
Table 1.City’s entry degree, exit degree and center degree.
Year A B L
2010 2014 2010 2014 2010 2014
Beijing 0.274 0.608 0.319 0.208 0.295 0.310
Baoding 0.007 0.006 0.011 0.014 0.008 0.009
Shijiazhuang 0.041 0.024 0.014 0.028 0.021 0.026
Xingtai 0.002 0.005 0.003 0.007 0.003 0.005
Handan 0.003 0.004 0.006 0.011 0.004 0.006
Anyang 0.002 0.005 0.005 0.008 0.002 0.006
Hebi 0.000 0.001 0.001 0.002 0.000 0.001
Xinxiang 0.002 0.004 0.004 0.007 0.003 0.005
Zhengzhou 0.054 0.057 0.027 0.063 0.036 0.060
Xuchang 0.002 0.003 0.002 0.004 0.002 0.003
Luohe 0.001 0.002 0.001 0.003 0.001 0.002
Zhumadian 0.001 0.001 0.002 0.004 0.001 0.002
Xinyang 0.001 0.003 0.005 0.007 0.002 0.004
Xiaogan 0.001 0.007 0.002 0.003 0.002 0.004
Wuhan 0.058 0.033 0.080 0.110 0.067 0.051
Xianning 0.001 0.002 0.002 0.003 0.001 0.002
Yueyang 0.002 0.004 0.005 0.005 0.003 0.004
Changsha 0.051 0.026 0.052 0.071 0.051 0.038
Zhuzhou 0.003 0.003 0.005 0.007 0.004 0.004
Hengyang 0.004 0.003 0.006 0.006 0.004 0.004
Chenzhou 0.005 0.001 0.004 0.003 0.004 0.004
Shaoguan 0.006 0.004 0.023 0.007 0.010 0.005
Guangzhou 0.352 0.094 0.198 0.227 0.254 0.133
Shenzhen 0.128 0.100 0.223 0.191 0.163 0.132
Shenzhen, Shaoguan’s entry degree declined, Guangzhou, Zhengzhou, Wuhan, Shijiazhuang, Changsha’s entry degree increased significantly, the extent of other urban changes are not obvious.
4.2. Center Degree Analysis
The center degree which refers to the core degree of a node at the network sys-tem in Table 1 reflects the degree of the node city’s attention on other cities and the ability to be cared by other cities. Through the analysis of Chartone, we find that the center degree of Guangzhou, Wuhan, Shenzhen, Changsha and Shao-guan has decreased significantly in the cities along the Beijing-Guangzhou high- speed railway, and the rest cities’ center degree has increased. This indicates that with the opening of high-speed railway, non-provincial prefecture-level cities’ core status has increased in the system of the cities along the Beijing-Guangzhou high-speed railway, and high-speed railway has strengthened the interaction of information and resources flow with other cities. Although the center degree of most capital cities and other major cities has declined, the core status of the cap-ital cities and first-tier cities is still solid in the whole network system, which is because the capital cities and first-tier cities occupy a relatively large number of resources, and have better health education and cultural facilities and the envi-ronment.
The total center degree refers to the central degree of the whole network sys-tem, and reflects the overall concentration of the whole network system. The centralization trend of the whole system can be found through the time variation of the total center system. The total city center degree of the prefecture-level ci-ties along the Beijing-Guangzhou high-speed rail has reduced from 0.941 to 0.819 since 2010 to 2014. From the analysis of the total center degree’s change, the whole network system has presented the characteristics of decentralization. This shows that the opening of high-speed rail enhances the linkages of cities along the high-speed rail, and enhances the flow of resources. The entire net-work system presents decentralization characteristics.
4.3. Interregional Correlation Coefficient Analysis
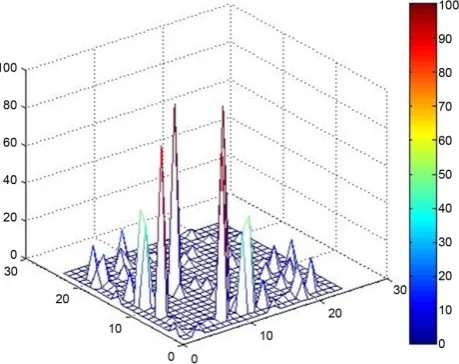
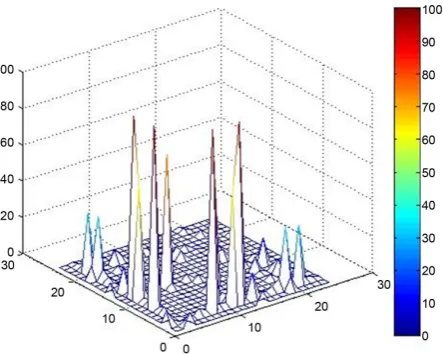
From the comparison of Figure 1 and Figure 2, we can see that the attention among the cities are unequal, such as other cities’ one-way attention degree on Beijing is relatively high, and Beijing’s one-way attention degree on other cities is relatively weak in spite of Shijiazhuang, Zhengzhou, Wuhan, Changsha, Guangzhou, Shenzhen. By comparing the city’s directional and non-directional graph from 2010 to 2014, we can find that other cities’ one-way attention degree on Beijing has increased in spite of Shijiazhuang and Hebe.
From the comparison of Figure 3 and Figure 4, we find that there are provin-cial barriers between city linkages, and the contact of non-provinprovin-cial capitals is limited within the province. The contact between adjacent non-provincial prov-inces of non-capital cities is weak. Through comparing the figure of 2010 and 2014, we find that the opening of the high-speed railway hasn’t broken the pro-vincial barriers.
4.4. Network Connectivity Analysis
Figure 1. The graph of city’s directional attention in 2010, drawn by MATLAB R2013a.
Figure 2. The graph of city’s directional attention in 2014, drawn by MATLAB R2013a.
Figure 4. The graph of city’s nondirectional attention in 2014, drawn by MATLAB R2013a.
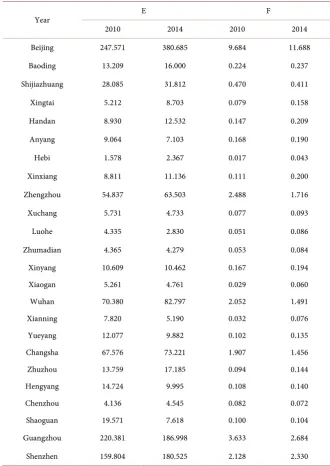
gree about the flow of standardized data 2. According to the comparative analy-sis in Table 2, we find that there are obvious differences in the degree of the network connection between cities. Beijing, Guangzhou and Shenzhen are the first grade, and their contact degree is above 150; Zhengzhou, Wuhan and Changsha are the second grade, and their contact degree is between 50 and 150; Baoding, Shijiazhuang, Xingtai, Anyang, Hebi, Xinxiang, Xuchang, Luohe, Zhumadian, Xinyang, Xiaogan, Xianning, Yueyang, Zhuzhou, Hengyang, Chenzhou, Shaoguan are the third level, and their contact degree is between 0 and 50. From the Chart two we can see that the degree of the linkage between the non-provincial cities is far lower than that of the capital cities, and the degree of the linkage between the non-provincial cities is not very different.
By comparing the degree of contact between 2010 and 2014, we find that, in spite of Beijing, Guangzhou, Shenzhen, the contact degree of other cities does not change significantly. Beijing’s network connectivity has increased from 247.6 to 380.7; Shenzhen’s contact degree has increased from 159.8 to 180.5; and Guangzhou’s contact degree has declined slightly from 220.4 to 187. The total network connectivity along the prefecture-level cities along the high-speed rail has increased from 997.83 in 2010 to 1138.86 in 2014, and it is found that the opening of the high-speed rail has significantly strengthened the degree of the inter-city linkage.
4.5. Urban Impact Index Analysis
Table 2. City’s network connectivity and urban impact index.
Year E F
2010 2014 2010 2014
Beijing 247.571 380.685 9.684 11.688
Baoding 13.209 16.000 0.224 0.237
Shijiazhuang 28.085 31.812 0.470 0.411
Xingtai 5.212 8.703 0.079 0.158
Handan 8.930 12.532 0.147 0.209
Anyang 9.064 7.103 0.168 0.190
Hebi 1.578 2.367 0.017 0.043
Xinxiang 8.811 11.136 0.111 0.200
Zhengzhou 54.837 63.503 2.488 1.716
Xuchang 5.731 4.733 0.077 0.093
Luohe 4.335 2.830 0.051 0.086
Zhumadian 4.365 4.279 0.053 0.084
Xinyang 10.609 10.462 0.167 0.194
Xiaogan 5.261 4.761 0.029 0.060
Wuhan 70.380 82.797 2.052 1.491
Xianning 7.820 5.190 0.032 0.076
Yueyang 12.077 9.882 0.102 0.135
Changsha 67.576 73.221 1.907 1.456
Zhuzhou 13.759 17.185 0.094 0.144
Hengyang 14.724 9.995 0.108 0.140
Chenzhou 4.136 4.545 0.082 0.072
Shaoguan 19.571 7.618 0.100 0.104
Guangzhou 220.381 186.998 3.633 2.684
Shenzhen 159.804 180.525 2.128 2.330
parative analysis of the influence of Beijing-Guangzhou high-speed rail along the 2010 and 2014, we find that the urban impact index has increased in spite of Zhengzhou, Wuhan, Changsha and Guangzhou, and the increase is the most obvious in Beijing.
4.6. Space-Time Analysis
Figure 5. Network connectivity.
comparative analysis in Figure 5, we find that Beijing’s network connectivity had increased significantly after the opening of Beijing-Guangzhou high-speed railway and expanded the gap with Guangzhou and Shenzhen. Guangzhou, Shenzhen’s increase is not obvious, but its fluctuation characteristics are ob-vious. Zhengzhou, Wuhan’s network connectivity rises slightly in spite of some month. Network connectivity is affected by unexpected events, and the network connectivity between different months fluctuates greatly.
Through the comparative analysis of the urban impact index in Figure 6, we find that the urban impact index of Beijing is much higher than that of Guang-zhou, Shenzhen, Zhengzhou and Wuhan, and the influence degree of Beijing is increased obviously after the opening of high-speed railway. The impact of Guangzhou, Shenzhen, Zhengzhou, Wuhan has not significantly layer, but the impact of Guangzhou has always been slightly higher than the other three cities.
On the whole, with the opening of the Beijing-Guangzhou high-speed railway, Beijing as the country’s political, economic and cultural center, its status has been enhanced, and gradually expanded the gap with other cities. Although Guangzhou, Shenzhen’s current network connectivity and urban impact index are higher than Zhengzhou, Wuhan, but this gap has a narrowed trend.
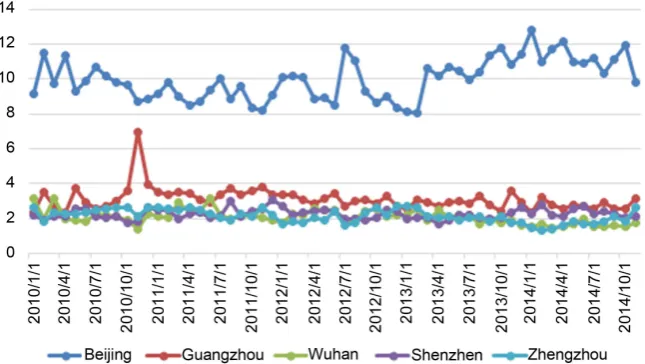
Figure 7 shows Beijing’s attention degree on Guangzhou, Shenzhen, Zhengzhou, Wuhan and Guangzhou, Shenzhen, Zhengzhou, Wuhan’s attention degree on Beijing. The data is from January 2010 to November 2014 which has 59 consecutive months.
Figure 6. Urban impact index.
Figure 7. Beijing’s attention on Guangzhou, Wuhan, Shenzhen, Zhengzhou and Guang-zhou, Wuhan, Shenzhen, Zhengzhou’s attention on Beijing.
5. Conclusions and Discussion
Micro-blog data has the characteristics of time and space, and can measure the network connection characteristics between cities according to different spatial scales and time intervals, so we can measure and forecast the relationship be-tween cities or regions in multi-scale.
[image:13.595.214.537.290.472.2]con-cerned about city i, and this can further analyze which one is “core” in the pat-tern of mutual attention and which one is “marginal” in the patpat-tern of mutual attention. The next innovation of the research is that we use inter-city mi-cro-blog data to simulate inter-city linkages and the degree of attention, which can’t be solved by using the traditional method. It’s rare to use micro-blog data to analyze the change of city’s contact and attention which is caused by the opening of high-speed rail.
The main contribution of this research: In this paper, a new method based on the location data and the information of the place names in the social media is used to evaluate the relationship between cities. In view of the problem that the relationship between cities is not symmetrical, this method can provide the abil-ity to evaluate the relationship between two cities, and provide a new method to measure the influence and similarity of cities. The problem that the relationship between cities is not symmetrical has been realized in the study of economic geography, regional economy and spatial economy, but they suffer from the problem that there is no suitable method to solve it. Therefore, it is very helpful for us to reveal the relationship between the cities. The analysis of a particular event can also be done using these methods, such as the fire explosion in Tianjin. Because social media data has temporal and spatial characteristics of natura, ur-ban linkages can be measured separately according to the size and characteristics of the city between the different time intervals, thus provide a measure and forecast a multi-scale regional relationship means. Finally, due to the temporal attributes of social media, it can provide the evaluation ability of different time scales, and provide the ability of time based retrieval.
Through the static analysis, we find the asymmetry of the inter-city linkages and through the analysis of the data, the degree of the relationship between the cities is measured. At the same time, the degree of the urban network system along the high-speed railway is analyzed: center degree and influence degree, and reveals the spatial structure of urban network system along high speed rail-way. Through the dynamic comparison and analysis, the influence of high-speed railway opening on the urban network is studied. Through the analysis of time series, this paper studies the changing characteristics of Beijing’s connection to Guangzhou, Shenzhen, Zhengzhou, Wuhan and Guangzhou, Shenzhen, Zhengzhou, Wuhan’s connection to Beijing.
anal-ysis of the high-speed rail’s influences, we find that the barrier dose not disap-pear due to the opening of the high-speed rail. At the same time, the opening of the Beijing-Guangzhou high-speed railways has strengthened the flow of re-sources and elements; the linkage between the cities along the high-speed rail has showed a center-oriented feature.
References
[1] Xiong, L.F., Zhen, F., Xi, G.L., et al. (2014) Characteristics of Urban Network Change in China’s Three Major Economic Zones—An Empirical Study Based on Baidu’s Information Flow. Tropical Geography, 1, 34-43.
[2] Liu, Z., Wang, S.F., Zhao, M.X., et al. (2013) Exploratory Analysis of Directed Weighted Urban Networks. Geography Research, 7, 1253-1268.
[3] Zhen, F., Wang, B. and Chen, Y.X. (2012) Chinese Urban Network Characteristics Based on Network Social Space—Taking Sina Weibo as an Example. Acta Geogra-phica Sinica, 8, 1031-1043.
[4] Leng, B.-R., Yang, Y.-C., Li, Y.-J. and Zhao, S.-D. (2011) Spatial Characteristics and Complexity Analysis of Urban Economic Network Structure in China. Acta Geogra- phica Sinica, 2, 199-211.
[5] Ni, P.F., Liu, K. and Taylor, P.J. (2011) China’s Urban Linkageages: Based on the Interlocking Network Model. Comparison of Economic and Social Systems, 6, 96- 103.
[6] Yao, Y.-L., Dong, Y. and Wang, Y.-H. (2012) Comparison of Energy Levels and Dy- namic Factors of Global Urban Networks in Beijing and Seoul. Economic Geogra-phy, 8, 37-42.
[7] Liu, Z.-B., Liu, J.-Y., He, X.-P. and Wang, F.-Z. (2014) Analysis of Urban Spatial Connection and Its Network Pattern in Zhongyuan Economic Zone—Based on In-tercity Passenger Flow. Public Geography, 7, 58-66.
[8] Yang, Z.-C. and Lu, Y.-Q. (2014) Study on the Convenience and Connection Pat-tern of Urban Traffic in Shandong Province Based on Passenger Flow. Polonomic Geography, 9, 63-67.
[9] Dunbar, R.I.M., Arnaboldi, V., Conti, M., et al. (2015) The Structure of Online So-cial Networks Mirrors Those in the Offline World. Social Networks, 10, 39-47. [10] Alampay, E.A. (2006) Analyzing Socio-Demographic Differences in the Access &
Use of ICTs in the Philippines Using the Capability Approach. Ejisdc the Electronic Journal on Information Systems in Developing Countries, 27, 1-39.
[11] Michael, F. and Goodchild, J. (2010) Crowdsourcing Geographic Information for Disaster Response: A Research Frontier. International Journal of Digital Earth, 3, 231-241. https://doi.org/10.1080/17538941003759255
Submit or recommend next manuscript to SCIRP and we will provide best service for you:
Accepting pre-submission inquiries through Email, Facebook, LinkedIn, Twitter, etc. A wide selection of journals (inclusive of 9 subjects, more than 200 journals)
Providing 24-hour high-quality service User-friendly online submission system Fair and swift peer-review system
Efficient typesetting and proofreading procedure
Display of the result of downloads and visits, as well as the number of cited articles Maximum dissemination of your research work
Submit your manuscript at: http://papersubmission.scirp.org/