ISSN Online: 2161-7198 ISSN Print: 2161-718X
Stock Exchanges Comparison between
Mainland China and H.K. Based on the SVL
Model
Jiahui Lin
School of Economics, Jinan University, Guangzhou, China
Abstract
In this paper, we consider the leverage effect on the CSI 300 Index yield and Hong Kong Hang Seng Index yield. It is modeled by the SV model with leve-rage. In this model, we compare the mainland and the Hong Kong stock market with stock market long-term effect, the degree on fluctuation reply and leverage effect so on. The analysis results show that the leverage stochastic volatility model can well fitting rate of return on the CSI300 index and the Hang Seng index in Hong Kong; The Shanghai and Shenzhen stock market volatility and leverage effect obviously stronger than the Hong Kong stock market.
Keywords
Volatility, Time Series Model, SV Model, Leverage, GARCH, MCMC Estimation
1. Introduction
In financial applications, a very important topic is to grab statistical properties of the yield of assets through the model. In the past few decades, the stock yield model has made great progress. From the initial Black-Scholes-Merton model’s constant volatility, more complex and finer models are presented to capture the characteristics of stock prices. These features include the significant events of the stock market impact, fluctuations in the price of agglomeration, leverage effect, etc. There are two basic models for describing volatility: the ARCH conditional heteroscedasticity model proposed by [1], and the stochastic volatility model proposed by [2]. The ARCH model considers volatility to be a deterministic function of past volatility and asset returns, while the SV model considers vola-How to cite this paper: Lin, J.H. (2017) Stock
Exchanges Comparison between Mainland China and H.K. Based on the SVL Model. Open Journal of Statistics, 7, 383-393. https://doi.org/10.4236/ojs.2017.73027
Received: March 29, 2017 Accepted: May 8, 2017 Published: May 11, 2017
Copyright © 2017 by author and Scientific Research Publishing Inc. This work is licensed under the Creative Commons Attribution International License (CC BY 4.0).
tility as a dynamic latent variable. In practice, SV is more flexible than SV model, because SV is more flexible. Although the SV model can well describe most of the volatility behavior, the actual economic operation is more complex, so set a more sophisticated model into the practical application, the leverage effect is a large part of them. [3] compared the two kinds of SV models with leverage ef-fects. A model is the application of Euler-discretization on continuous model obtained by discretization model, while another model is supported by [4]. The difference between the two is whether are related over the same period reflected in the leverage effect. The empirical results show that the leverage model per-forms better in the non-same period. The paper [5] constructed a stochastic vo-latility model with leverage effect and thick tail random error and jumping ef-fect, using S & P index and Tokyo Stock Price index. Through the empirical comparison of different SV models, found in the New York stock market and the Tokyo stock market, thick tail distribution, leverage effect and jumping effect is significant.
The article [6] extended the Meta model into a binary SV model with leverage. This effect is cross here, not only reflected in the same between market return and volatility, but also between different markets. Through the empirical analy-sis of the composite index of different industries in New York stock market, it is found that the cross leverage effect is significant and the cross leverage effect between different industries is asymmetric. Utility index of leverage effect is very strong. On the one hand, compared with other composite index, the volatility is more susceptible to the influence of the yield. On the other hand, the utility in-dex returns are very strong against the volatility of other industry indices, while the volatility of the composite index of other industry indices to the public opi-nion composite index is limited very much.
Also, domestic scholars have done a lot of research on the SV model of stock price. The article [7] first applied the basic SV model and its extended ASV (asymmetric stochastic volatility) model to predict the volatility of the Shenzhen stock market, and based on the symmetric and asymmetric evaluation criterions, compared with the predictive effect of the SV model and the common ones. This paper [8] established the SV family model to verify the predictability of the Shanghai stock market. It was found by the empirical results that the Shanghai stock market has a leverage effect, long memory and volatility persistence. Paper [9] worded for capturing the stock returns effect of good news and bad news under the asymmetric, the threshold effect and state-related leverage are intro-duced into SV model at the same time, and a double lever threshold SV (THSV- DL) model is proposed, modeling the volatility of asset returns.
2. An Introduction to the Model and Estimation Method
2.1. SVL Model Introduction
important for the stock market, nevertheless the leverage effect of the exchange rate market is much lower. Compared with the basic SV model, the leverage ef-fect SV model has an additional parameter, that is, the correlation coefficient. The model is as follows:
, exp
2 t
t t t
y θ ρ= θ ε
(1)
(
)
1 , , , , 1
t t t t
θ θ µ ϕ τ ρ µ ϕ θ µ τ η+ = + × − + × + (2)
1
0 1
~ . . ,
0 1
t
t
i i d N
ε ρ
η+ ρ
(3)
t
y represents the yield at time t, while θt represents the logarithmic fluctua-tion at time t. µ indicates the long-term effects of logarithmic fluctuations, de-picting the extent of long-term logarithmic volatility. ϕ is said the reversion the logarithmic fluctuations, which reflects the extent to which the current vola-tility is affected by future volavola-tility. ρ indicates the degree of leverage. When
ρ is zero, the model above is the basic stochastic volatility model, which de-picts the characteristics such as time-varying and agglomeration of fluctuation, but for the financial market, especially the common volatility in the stock market cannot depict asymmetric phenomenon. When less than 0, the above model called SVL model, which has the leverage stochastic volatility model, this model by income shocks εt and volatility impact ηt+1 is negatively related to the asymmetry of volatility.
2.2. Idea about MCMC
There are the methods of estimating SV model parameters as follows: MCMC simulation, quasi-maximum likelihood (QML), generalized moment estimation (GMM), etc. The MCMC method is better and more flexible among them, since that on the one hand, MCMC simulation parameter estimation accuracy is supe-rior to other methods; on the other hand, in the estimation parameters it can be predicted the forecast value at the same time. In this paper, MCMC simulation is used to infer the above model and predict the fluctuation.
The basic idea of the MCMC method is to establish a stable distribution
( )
π θ of the Markov chain, samples π
( )
θ were obtained by random sampling, based on these samples to do a variety of statistical inference. The key is to con-struct a stationary distribution π( )
θ with a specified value. In general, it is fol-lowed three steps: (1) select a suitable Markov chain, the transfer probability of( )
*,*p , so that the corresponding smooth distribution in π
( )
θ ; (2) by observ-ing a certain point θ( )0 from the sample, using the Markov chain in (1) thatproduce point sequence ( )1 ( )2 ( )
, , , n
θ θ θ ; (3), for an m and a sufficiently large n,
( )
( )1
1 n
t
t m E
n m
θ
θ
= +
=
−
∑
. (4)3. Empirical Analysis
3.1. Sample Datas
This paper selects the Hong Kong’s Hang Seng Index (110000) and the CSI 300 Index (000300) from January 2014 to July 2016, with a total of 587 trading days per index. Take the return on assets
1
1
*100% t t
t t p p r
p
−
−
−
= , (5)
where pt is the closing price of t.
[image:4.595.212.540.507.703.2]3.2. Exploratory Analysis
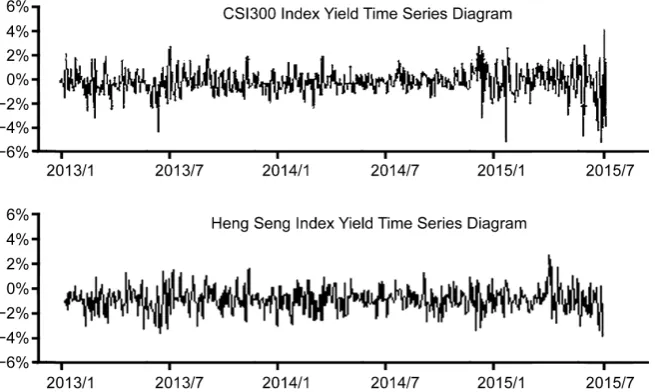
Figure 1 shows the timing chart of CSI 300 stock index and the Hang Seng index in Hong Kong yield time-sequence diagram. Observation above, we can see two index yield is basically additional fluctuations in 0, there is no obvious up or down trend, sequence is smooth. Compare two diagrams can be found that vola-tility of difference is obvious. Virtual is equal to the line for index, the Hang Seng Index in Hong Kong are basically within the range of fluctuation, yield more than only a few. While the CSI 300 index fluctuation volatility is signifi-cantly larger than the Hong Kong Hang Seng Index, whereas yield is more than many, has more than 2013/7, 2015/1, 2015/1. In addition, we can find that large fluctuations are always present. In the case of the CSI 300 Index, for example, there was a particularly large fluctuation in 2013/7, 2015/1, 2015/7, and there was a large fluctuation around these times, and in the period 2014/1, 2014/7, during this period, when fluctuations are small, and no extreme volatility partic-ularly big.
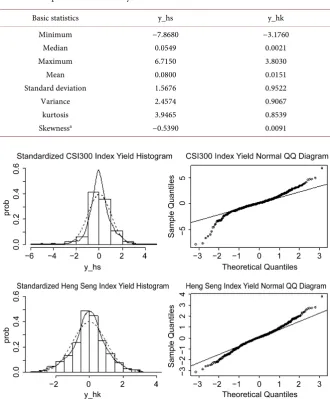
The following Table 1 shows the basic statistical results of the CSI 300 and the Hong Kong Hang Seng Index, where the variable y_hs represents the CSI 300 stock index yield and y_hk represents the Hang Seng Index yield. Similar to
Figure 1. The CSI 300 Index and the Hang Seng index in Hong Kong yield time series
what’s get in the observation on the chart, the yield on the CSI 300 Index is greater than the Hong Kong ones. The minimum and maximum returns of the CSI 300 stock index yield are almost 2 times of Hong Kong’s Hang Seng index. Compared with the median return on Hang Seng index, CSI 300 stock index re-turns the median is far greater than zero. In terms of variance, the CSI 300 stock index is bigger than Hong Kong’s.
[image:5.595.207.538.304.704.2]Figure 2 for the two-index frequency histogram and normal QQ map. In the histogram, the solid line is the density curve of the index yield, and the dotted line is the density curve of the standard normal distribution. Observation of the histogram, we can find that both the CSI 300 index, and the Hong Kong Hang Seng Index, the distribution of the yield and the standard normal distribution are not the same, there are spikes behind the phenomenon. Observing the nor-mal QQ figure, when a scatter all fall on the diagonal line, distribution is nornor-mal, but obviously on both sides of the diagonal, take away the feeling, the scatter in
Table 1. Comparison of commonly used statistics.
Basic statistics y_hs y_hk
Minimum Median Maximum
Mean Standard deviation
Variance kurtosis Skewnessa
−7.8680 0.0549 6.7150 0.0800 1.5676 2.4574 3.9465 −0.5390
−3.1760 0.0021 3.8030 0.0151 0.9522 0.9067 0.8539 0.0091
Figure 2. CSI 300 Index and the Hang Seng Index returns histogram, normal QQ
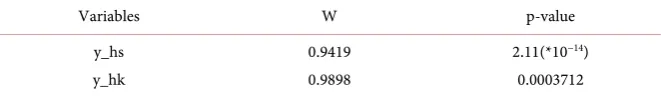
either the CSI 300 index, or Hong Kong’s Hang Seng index, while the distribu-tion of the yield is not a normal distribudistribu-tion. Besides, according to Table 2 Sha-piro-Wilk normality test, for the Shanghai and Shenzhen 300 index yield, W sta-tistic of 0.94175, with the probability of p-value of 2.11E−14 < 0.05, rejected the original hypothesis that the CSI 300 Index yield Disobedient to normal distribu-tion. Similarly, the Hong Kong Hang Seng Index yield does not obey the normal distribution.
In conclusion, we can draw the following conclusions:
• The CSI 300 Index is more volatile and more volatile than the Hong Kong
Hang Seng Index, indicating that China’s stock market is more unstable.
• CSI 300 Index and Hong Kong Hang Seng are obviously fluctuation
pheno-menon of agglomeration, the yield distribution do not obey the normal dis-tribution, there are the characteristics of peak tailing.
3.3. Analysis on SVL Model
3.3.1. Stationarity TestAs shown in Table 3 above for the CSI 300 Index and the Hong Kong Hang Seng Index yield ADF test results. The original hypothesis is the existence of unit roots, the sequence is non-stationary. For the CSI 300 index yield y_hs, Dick-ey-Fuller = −6.1977, corresponding to p-value = 0.01 < 0.05, suggesting that is under the significance level of 0.05, rejects the original hypothesis that the CSI 300 index yield sequence is stable. Similarly, at the 0.05 significance level, the Hong Kong Hang Seng Index yield sequence is also a stationary series.
3.3.2. ARCH Effect Test
As shown in Table 4 above for the CSI 300 Index and Hong Kong Hang Seng Index yield test results of the ARCH effect. The original assumption is that there is no ARCH effect. For the CSI 300 index yield y_hs, the ARCH effect of the LM
Table 2. Shapiro-Wilk normal inspection.
Variables W p-value
y_hs y_hk
0.9419 0.9898
2.11(*10−14)
0.0003712
Table 3. ADF test.
Variables Dickey-Fuller Lag order p-value
y_hs y_hk
−6.1976 −7.0423
8 8
[image:6.595.208.539.516.564.2]0.01 0.01
Table 4. LM test.
Variables Chi-squared df p-value
y_hs y_hk
105.3 31.27
12 12
2.19(*10−16)
test of the chi-square statistic Chi-squared = 105, the degree of freedom df = 12, corresponding to p-value = 2.20E−16 < 0.05, indicating a significant level of 0.05, reject the original hypothesis, after that the CSI 300 index yield sequence exists ARCH effect. Similarly, at the 0.05 significance level, the Hong Kong Hang Seng Index yield sequence also exists in ARCH effect.
3.3.3. SVL Model Parameter Estimation and Analysis
Through the MCMC method, the parameters of the SVL model are estimated, and the iterations are 20000 times, and the previous 10000 times are removed and the parameters are estimated by the iteration value of 10000 times. With reference to the setting of the prior distribution of [10], the prior distribution of the parameters to be evaluated is as follows:
(
)
~N 0,100
µ . (6)
(
)
2 1, beta 20,1.5
ϕ= ∗ϕ∗− ϕ∗
. (7)
(
)
1
, ~ Ga 2.5, 0.025
τ τ
τ
∗ ∗
= . (8)
(
)
~U 1,1
ρ − . (9)
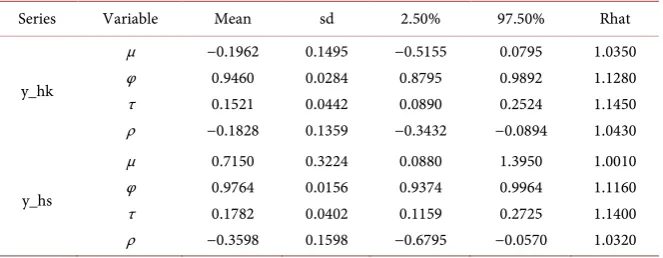
Such as Table 5 for the sequence of yield of the two index y_hs and y_hk pa-rameter estimation results, output variables respectively mu, phi, tau, rho post-erior mean, a postpost-eriori standard deviations, postpost-erior 2.5% quantile, postpost-erior 97.5%, and the statistic Rhat for judging convergence.
Rhat is the statistic for the MCMC convergence diagnosis based on the normal approximation proposed by [11]. The idea is to start multiple MCMC estimates of multiple strands from a large number of different initial values. The variance and intra-group variance were calculated from the estimated sequence generated at each initial value. If the construction of the model is effective and the conver-gence of the Markov chain is better, even if the initial value of the parameter is very different, it will converge quickly to the nearest value and fluctuate in the same value Variance and the variance between the groups will be smaller. Spe-cifically, the Rhat statistic is
1 1
ˆ *
2
n m B df
R
n mn W df
− +
= +
−
[image:7.595.209.541.608.737.2] . (10)
Table 5. Result of model parameter estimates.
Series Variable Mean sd 2.50% 97.50% Rhat
where m is the number of initial values, 2n represents the total number of itera-tions, the first half of the n iteration values are removed, the nth iteration values are used for the second half, B is the variance between groups, W is the in-tra-group variance, df is the approximate T the degree of freedom of distribu-tion. Conclusion in [11] suggested that when the Rhat is less than 1.2, the re-sulting Markov chain is convergent. With reference to this criterion, it can be seen from Table 5 that the estimates of the parameters mu, phi, tau and rho of the model are convergent both in terms of the yield of the CSI300, y_hs, or the Hong Kong Hang Seng Index yield.
According to the characteristics of Table 5 and SVL model, we can see: μ represents the long-term effect of volatility logarithm. The CSI 300 index yield model has an estimate of 0.7150 and a 95% confidence interval of [0.08820, 1.3950]. The estimate of the Hong Kong Hang Seng Index yield model is -0.1962 and the confidence interval is 95%. [−0.5155, 0.0795]. Obviously, the CSI300 in-dex yield model is estimated to be larger than the Hong Kong Hang Seng Inin-dex yield, and the interval between the CSI 300 Index yield model is entirely on the right side of the range estimate of the Hong Kong Hang Seng Index yield model The As the logarithmic transformation is monotonous, so that the overall long-term fluctuations in Shanghai and Shenzhen stock market is far greater than the overall long-term fluctuations in the Hong Kong stock market. This is basically the same as our previous exploratory analysis. Compared with the Shanghai and Shenzhen stock markets, the Hong Kong stock market is more mature market, the long term, the volatility is relatively small. Shanghai and Shenzhen stock market volatility is relatively large, vulnerable to other external events.
φ stands for the return nature of logarithmic fluctuations, indicating that the current volatility will have a long-term impact on future volatility. The point es-timate of the CSI 300 index yield model is 0.9764 and the confidence interval is 95%. [0.9374, 0.9964]. The Hong Kong Hang Seng Index yield rate is estimated at 0.9460 and the confidence interval of 95% is estimated to be [0.8795, 0.9892]. The point estimation φ of the y_hs model is slightly larger than that of the y_hk model, which is close to 1, and the interval estimates of the two are overlapped with a large part. Therefore, the Shanghai and Shenzhen stock markets and the Hong Kong stock market have almost the same degree of fluctuation. The nature of the return, which shows that the phenomenon of fluctuations in income ag-glomeration is obvious. The agag-glomeration of volatility is the persistence of risk, which reflects the long-term impact of current risks on future risks, which in-vestors, especially long-term inin-vestors, do not want to see. For inin-vestors, both in Shanghai and Shenzhen stock markets or Hong Kong stock market, we must consider the sustainability of market risk.
estimated to be [−0.3432, −0.0894]. Whether the CSI300 Index yield or the Hong Kong Hang Seng Index yield, the 95% confidence interval does not include 0, and the points are estimated to be less than 0, indicating that the Shanghai and Shenzhen stock markets and the Hong Kong stock market there are obvious le-verage effect. The absolute value of the point estimation ρ of the CSI300 index yield model is significantly larger than the absolute value of the Hong Kong Hang Seng Index yield model, indicating that the leverage effect of the Shanghai and Shenzhen stock markets is stronger than that of the Hong Kong stock mar-ket. In other words, when the market shows negative returns, the volatility im-pact in the Shanghai and Shenzhen stock markets is greater than which caused by the Hong Kong stock market. Negative correlation not only shows that stock market participants are often risk hobby, but also implies that the stock market speculation exists, which also evidence from a side of the mainland stock market is emerging stock market.
To sum up, we can draw the following conclusions:
• stock market volatility exist in both Shanghai and Shenzhen stock market and
the Hong Kong concentration, the current market fluctuations, greatly af-fecting the market fluctuations would in the next issue, the instability yields..
• The volatility of the Shanghai and Shenzhen stock markets is larger than that
of the Hong Kong stock market, partly because of the long-term characteris-tics of different markets and partly because the market leverage is not the same. The leverage effect of Shanghai and Shenzhen stock markets is greater, and the current volatility is affected by the previous period. It is obvious that the impact of the negative income in the previous period is greater than that of the positive income.
4. Conclusion and Prospect
closed. Each down to 5% of the suspension of trading points, after the resump-tion of trading, immediately fell to 7% of the day to stop trading points. This shows that the proportion of speculators in China’s stock market is very large, a considerable number of people follow suit “investment”. When you see the stock fell, a considerable part of the investors did not rational analysis, have to sell, resulting in further stock price drop. Therefore, the improvement of China’s fi-nancial system, deepening the fifi-nancial system reform, is still long way to go.
Acknowledgements
Thanks for my teacher JL Yin, who has walked me through all the stages of the writing of this article. Without his consistent and illuminating instruction, this paper could not have reached its present form. Secondly, this article would not have been possible without the consistent and valuable reference materials that I received from my good friend Mum Kin Lee, whose insightful guidance and en-thusiastic encouragement in the course of my shaping this article definitely gain my deepest gratitude.
References
[1] Engle, R.F. (1982) Autoregressive Conditional Heteroscedasticity with Estimates of the Variance of United Kingdom Inflation. Econometrica, 50, 987-1007.
http://www.jstor.org/stable/1912773
https://doi.org/10.2307/1912773
[2] Hull, J. and White, A. (1987) The Pricing of Options on Assets with Stochastic Vo-latilities. The Journal of Finance, 42, 281-300.
http://onlinelibrary.wiley.com/doi/10.1111/j.1540-6261.1987.tb02568.x/full
https://doi.org/10.1111/j.1540-6261.1987.tb02568.x
[3] Yu, J. (2004) On Leverage in a Stochastic Volatility Model. Journal of Econometrics, 1272-1295. https://doi.org/10.2139/ssrn.527482
[4] Jacquier, E., Polson, N.G. and Rossi, P.E. (2004) Bayesian Analysis of Stochastic Volatility Models with Fat-Tails and Correlated Errors. Journal of Econometrics, 122, 185-212.
[5] Nakajima, J. and Omori, Y. (2008) Leverage, Heavy-Tails and Correlated Jumps in Stochastic Volatility Models. Computational Statistics and Data Analysis, 53, 2335- 2353.
http://econpapers.repec.org/scripts/redir.pf?u=http%3A%2F%2Fwww.cirje.e.u-toky
o.ac.jp%2Fresearch%2Fdp%2F2007%2F2007cf514.pdf;h=repec:tky:fseres:2007cf514
[6] Ishihara, T. and Omori, Y. (2009) Efficient Bayesian Estimation of a Multivariate Stochastic Volatility Model with Cross Leverage and Heavy-Tailed Errors. Compu-tational Statistics and Data Analysis, 56, 3674-3689.
[7] Liu, F.Q. and Wu, X.Z. (2004) SV Forecast of Shenzhen Stock Exchanges. Journal of Shanxi Finance and Economics University, No. 4.
[8] Wu, M. and Xu, Q.Z. (2005) An Empirical Study of the Stock Composite by Using SV Modes. Journal of Chengdu University (Natural Science), No. 1.
[9] Wu, X.Y., Zhou, H.L., et al. (2014) A Threshold Stochastic Volatility Model with Double Leverage and Its Empirical Test. Journal of Management Sciences in China, No. 7.
Models. TheEconometrics Journal, 3, 198-215.
http://www.jstor.org/stable/23114889
https://doi.org/10.1111/1368-423X.00046
[11] Gelman, A. and Rubin, D.B. (1992) Inference from Iterative Simulation Using Mul-tiple Sequences. Statistical Science, 7, 457-472.
http://projecteuclid.org/euclid.ss/1177011136
https://doi.org/10.1214/ss/1177011136
Submit or recommend next manuscript to SCIRP and we will provide best service for you:
Accepting pre-submission inquiries through Email, Facebook, LinkedIn, Twitter, etc. A wide selection of journals (inclusive of 9 subjects, more than 200 journals)
Providing 24-hour high-quality service User-friendly online submission system Fair and swift peer-review system
Efficient typesetting and proofreading procedure
Display of the result of downloads and visits, as well as the number of cited articles Maximum dissemination of your research work