Munich Personal RePEc Archive
Methodological Developments in Human
Development Literature
Nayak, Purusottam
North Eastern Hill University
13 October 2013
Online at
https://mpra.ub.uni-muenchen.de/51192/
M ethodological Developments in Human Development Literature
Purusottam Nayak
Abstract
The present paper is a review of met hodological advancement s in human development lit erat ure st art ing from 1990 t ill dat e. While highlight ing t he cont ribut ion of UNDP t o t he concept of human development and const ruct ion of HDI it ment ions that t he int roduced concept and met hod of measurement is a huge qualit at ive improvement over t he earlier concept of grow t h and per capit a GDP measurement . Although t he human development report st art ed w it h a poor met hodology, t hanks t o t he galaxy of scholars for t heir unt iring effort s and invaluable cont ribut ions in t he successive years t hat enabled UNDP in refining it s met hodology t o a large ext ent . There is no denying fact t hat t here is no end t o refinement s, t he purpose for w hich M ahbub ul Haq st ruggled in his ent ire life has been served.
Introduction: In the early development literature, income per capita was traditionally used to measure development with an assumption that it will directly translate into improved human well being. For decades, the economic growth paradigm dominated the national development discourse. However, in the 1980s unemployment levels escalated. The access to social services deteriorated in many countries including some industrialized nations while at the same time, economic production was expanding. High rates of economic growth did not automatically translate into improved human being. During the same period, some countries were registering improvement in human well-being with modest economic growth. These raised questions around the nature, distribution and quality of economic growth. People started realizing that while growth-oriented policies may increase a nation’s total wealth, whet her or not grow th enhances human development depends on how that growth is generated and utilized. The economic growth paradigm was, thus, believed to have neglected important aspects of development, such as poverty, income inequalities, unemployment, and disparities in access to public goods and services like health, education, et c and did not capture adequately the multi-dimensionality aspects of development. For economic growth to enhance human development, it should provide an opportunity to enhance workers' knowledge and skills along with opportunities for their efficient use, provide better job opportunities and support greater democracy at all levels of decision-making.
insisting on the inadequacy of income as the sole indicator of welfare and arguing that income should be supplemented by other attributes of welfare such as health and education. The basic needs approach advocated by development economists regarded development as an improvement in an array of human needs and not just as a growth of income. Sen (1985, 1987 and 1997) defined standard of living in terms of (i) functioning, which indicates attainments of different attributes, and (ii) capability, which is the ability to attain. The capability approach emphasized what a person can do and not what he can purchase as the ultimate metric of wellbeing. An example of a functioning achievement index is the human development index (HDI) conceived by M ahbul ul Haq and introduced by UNDP in its first Human Development Report (HDR, 1990) which ever since has been published annually. HDR is one of the major contributions that reoriented the debate on the measurement of development beyond the traditional economic perspective towards a broader scheme that incorporates different aspects of life into measures of development. The report recognized development to be much more than just the expansion of income and wealth. It defined human development as `the process of enlarging people's choices' (UNDP, 1990: 10). It also stressed that the choices available to people can be infinite and can change over time. But at all levels of development, the three essential ones are for people to lead a long and healthy life, to acquire knowledge and have command over resources for a decent standard of living. The report made its most distinctive contribution to the larger development discourse by highlighting these dimensions as being basic to human development and in asserting that all the three are essential. Based on this framework, the report constructed the HDI for 130 countries as a measure of its human development along three dimensions: life expectancy at birth as the indicator for a healthy life, adult literacy as the indicator for the knowledge, and common logarithm value of the per capita real GDP as the indicator for the standard of living. HDI was then constructed in three steps. In the first step, a measure of deprivation of a country for each dimension was estimated on a scale between 0 to 1 where 0 corresponds to the minimum, and 1 to the maximum assigned value for the corresponding indicator. Thus, for each component dimension
i
of the HDI, individual DeprivationIndices
DI
for a given country
j
were computed according to the formula as follows:
)
(
)
(
.
...
...
...
1
ij ij
ij ij ij
X
Min
X
Max
X
X
Max
DI
3 1
[image:4.612.130.486.247.337.2]3
1
..
...
...
...
2
i ij
j
I
ADI
The third stage was the measurement of
HDI
as one minus the average deprivation index
ADI
:
3
...
...
...
HDI
j
1
ADI
j
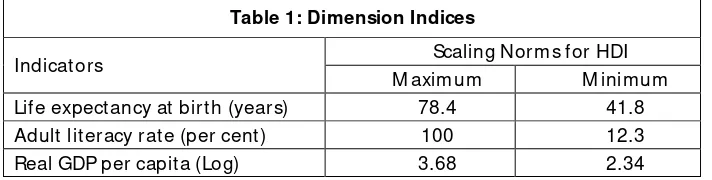
For the construction of deprivation indices for different dimensions maximum and minimum values of the variables were determined from the actual values as shown in Table 1:
Table 1: Dimension Indices
Indicators Scaling Norms for HDI
M aximum M inimum Life expectancy at birth (years) 78.4 41.8 Adult literacy rate (per cent) 100 12.3 Real GDP per capita (Log) 3.68 2.34
Individual Authors’ Contributions to M ethodological Refinements: Researches on social indicators and quality of life in the twentieth century have been split along three parallel tracks. Psychologists have been focusing on subjective wellbeing, economists on preferences, and sociologists on objective social indicators (Gasper, 2004; Chan et al., 2004; Bulmer, 1983 as quoted by Collomb, et al., 2012). Since the 1990s, stronger connections have been built between economists and psychologists working on the concept of subjective wellbeing (Sirgy et al., 2006; Kahneman and Krueger, 2006). This line of research remains limited but is growing, especially through interdisciplinary approaches (Costanza et al., 2006; Kingdon and Knight, 2006). While it is true that conventional one-dimensional measure continues to dominate development studies, scholars and policy makers are increasingly interested in multi-dimensional wellbeing (Berenger and Verdier-Chouchane, 2007; Gasper, 2004). An important element in such measures revolves around the integration of objective and subjective indicators of w ellbeing (Hagerty et al., 2001; Cummins, 2005). The present paper, however, is limited to those methodologies that are directly related to construction of HDI only.
Hicks (1997) proposed a method to incorporate a concern for distributional inequalities of income, education, and longevity into the framework of HDI. He constructed Gini coefficients
G
i , for a setof 20 developing countries, measuring inequalities of income, educational attainments, and life-span attainments and combined with data from the HDI to produce an Inequality-Adjusted HDI
IAHDI
. To constructIAHDI
, three steps were suggested by him:(1) Construction of indices
I
ij in the first step for each of the three dimensions using the formula:)
(
)
(
)
(
ij ij
ij ij
ij
X
Min
X
Max
X
Min
X
I
(2) Construction of inequality-adjusted dimension indices
IAI
ij
in the next step as follows:
i
ijij
I
G
IAI
*
1
For each dimension
i
, the weight is to be given to inequality-adjustment factor as
i.Presumably,
0
.
1
1
,
ii i
G
Although he introduced an inequality adjusted HDI, he was not very happy with the application of Gini coefficient as it is not a perfect indicator of inequality. Construction of inequality measures based on Gini coefficients is not free from conceptual as well as empirical difficulties. According to him inequality of longevity is a difficult concept intuitively.
Sagar and Najam (1998) in their paper evaluated how well HDRs lived up to its own conceptual mandate and assessed the ability of the HDI to further the development debate. They observed that the reports had lost touch with its original vision and the index failed to capture the essence of the world it sought to portray. The index focused almost exclusively on national performance and ranking, but did not pay much attention to development from a global perspective. HDI neglected links to sustainability by failing to investigate the impact on the nat ural system of the activities that potentially contribute to national income and hence to HDI. They cited the examples of Brazil and Indonesia which improved their HDI by converting natural capital to income in an unsustainable manner. Their concern was about the conceptual implications of the method for folding the three component indices into a single index. They believed that the scheme of arithmetic averaging of the dimensions was counter to the notion of their being essential and, therefore, non-substitutable. Accordingly they proposed the incorporation of t hree simple modifications for the index as a first step to overcome those shortcomings: (1) Dimensional indices that comprised the HDI need to be multiplied instead of being arithmetically averaged. Such a treatment would, in fact, would be closer to treating each dimension as an `essential' and non-substitutable component by controlling trade-offs between them; (2) In estimating the standard-of-living dimension, a logarithmic treatment of GDP across the whole range of global incomes will present a less unrealistic depiction of the availability of options across countries without camouflaging inter-country disparities that are all too real; and (3) For the HDI t o capture the sustainability dimension of human development, it will need to incorporate some mechanism for accounting overexploitation of natural resources. While they wholeheartedly agreed with the emphasis of expanding people's options by UNDP, simultaneously cautioned to expand them in a just manner, nationally and internationally and about exercising them wisely. They used the following formulae to construct
HDI
:
3 1 3
1
i i
H
HDI
WhereH
1,
H
2,H
3 respectively are education, health and income indices.that income beyond poverty-line income
*y
has no cont ribution to the HDI as claimed in 1990 report of UNDP. The combination of introducing a cap and taking the logarithm of income was to reflect, rather sharply, the diminishing marginal contribution of income to the human development (UNDP, 1991). Subsequent reports accepted that income above
*y
will have some effect on the HDI. This modification was to take into consideration the wider people’s choice rendered through higher income. This was reflected by using the Atkinson formulation for the utility of incomeW
(
y
)
as:
11
1
)
(
y
y
W
.Where parameter epsilon
is the elasticity of marginal utility of income and measures the extent of diminishing returns and reflects the deviation of the elasticity of the utility of income with respect to income from unity. As epsilon tends to zero
i
.
e
.,
0
, fractions of income above poverty level will have a more significant effect; and for
0
, the dollar for dollar effect would be reflected fully. As epsilon tends to one, the above mentioned equation of utility of income is reduced toW
(
y
)
log
y
. Accordingly income above *y
was divided into selected intervals. Keeping these points in view and in order to consider further variations in income he divided the income range above *y
into more subsets and assumed different values for
as shown in Table 2:Table 2: Range of Income,
and ElasticityValue of
Range of Income (y) Elasticity Value of
Range of Income (y) Elasticity0.0 *
y
y
1.0 0.5 * *5
.
3
0
.
3
y
y
y
0.50.1
y
*
y
1
.
5
y
* 0.9 0.63
.
5
y
*
y
4
.
0
y
* 0.40.2 * *
0
.
2
5
.
1
y
y
y
0.8 0.7 * *5
.
4
0
.
4
y
y
y
0.30.3 * *
5
.
2
0
.
2
y
y
y
0.7 0.8 * *0
.
5
5
.
4
y
y
y
0.20.4 * *
0
.
3
5
.
2
y
y
y
0.6 - - -ascending consecutive fractions of educational indicators. These weights are suitable for re-scaling the th
k
consecutive fraction of education indicator
for countryi
A
k as follows:2
,
1
1
e
for
A
Kk
x ik
The formula used to construct the modified human development index
MHDI
is as follows:d i i
s
d
d
MHDI
2
1
Where:
d
iis the length of the distance vector from the best country;d
ands
dare the mean and standard deviations of distances for all countries from the ideal country; andd
iis defined as:
12 31
2 0
j
j ij
i
Z
Z
d
Where:
Z
0jis the standardized score on componentj
for the ideal country.Noorbakhsh (1998b) compared several different methods such as Arithmetic M ean, Principal Component Analysis (PCA), and Borda method of arriving at a composite index and found the ranks for all the methods to be very similar. This provided a justification for the current HDI specification.
On two grounds, Human Development Report appeared to be confusing to Palazzi and Lauri (1998): one is that of substitutability between dimension indices, and another is of equal weighting. From the theoretical standpoint, the solution to overcome the confusions lies in introducing a concept of balanced and sustainable human development in which the three aspects are not only indispensable but also reciprocally self-reinforcing- A sort of three legged stool in which balance and sustainability depend on the legs being equal in length. They represented their approach graphically by a cloud of country points in three dimensional coordinate axes representing three dimensions of HDI. The
R
eline starting from the origin and running equidistant from the three axes (i.e., all the pointsThe purpose of defining BSD in the space of sustainability was to devise a mechanism for correcting the values of human development for countries situated outside the area of sustainability. The solution they suggested was to 'penalize' states of human development that fall outside the cone area in proportion to their relative distance from the surface of the cone. To propose an index of BSD, they:
1. First defined a disequilibrium index
'
e
'
, which measures the relative distance of the country-point from the objective country-point on the equilibrium lineR
eas follows:i i i
h
d
e
Where
d
i indicates the absolute distance of the count ry-point from the perfect-equilibrium linee
R
(i.e., the absolute level of countryi
'
s
disequilibrium) andh
iis the distance between the originand the objective-point along the perfect-equilibrium line (i.e., country
i
'
s
HDI score). This ratio is equivalent to the tangent of the angle between the perfect equilibrium objective lineR
eand theline joining the origin to point of the country-point
P
i. The lowest acceptable level of balance andsustainability is designated by them as *
e
.2. In the second step they estimated the correction coefficient as:
* ** *
* * *
ˆ
ˆ
max
ˆ
ˆ
max
ˆ
ˆ
max
ˆ
ˆ
1
E
E
E
E
E
E
E
E
k
i i
i i i
Where
E
ˆ
is the betweenR
i(the line joining the origin toP
i);E
ˆ
*is the angle of rotation of t he cone;and
ˆ
*max
E
is angle betweenR
eand each of the coordinate axes
0
78
.
54
ˆ
max
E
i
.3. In the final step they computed equilibrium-adjusted human development index (EHDI) as:
i
ii
k
HDI
EHDI
i i
i i
i i
i i
HDI
EHDI
and
k
then
e
e
If
HDI
EHDI
and
k
then
e
e
If
,
1
0
,
1
* *
If one the variables is negative,
then
k
i
0
,
and
EHDI
i
0
.
The most important conclusion of their work was the recommendation for dropping the assumptions of full substitutability and equal weighting in the construction of the HDI.
Biswas and Caliendo (2001) used the PCA method to arrive at nearly equal weights for the three components: Life Expectancy Index (34%), Education Index (34%); GDP Index (32%) and concluded that:
Despit e t he simplist ic met hodology, it appears t hat t he HDI is a good met hod of combining t he component indexes and should be view ed, perhaps, w it h less skept icism… [L]it t le is lost in t he simplist ic met hod, and much is gained in t erms of st raight forw ardness. Indeed, w hile t he st rength of t he HDI appears t o lie in it s easy comprehension, t he w eight s used t herein are consist ent w it h mult ivariat e t echniques t hat generat e w eight s optimally.
program in the best advantage for each country so as to maximize its relative efficiency. The highest-ranking country is considered relatively efficient and assigned a perfect score of 1, while the rest of the countries in the sample are considered to be relatively inefficient with scores varying between 0 and 1. A relatively efficient country cannot improve its levels of output any further while relying on a given level of inputs, while the relatively inefficient countries could. To illustrate the model let us assume that there are N numbers of DM Us of which one of the DM Us, say the th
m
one, whose efficiency is to be maximized is as follows:
I
K
i
J
K
j
U
V
Where
N
K
n
X
U
Y
V
X
U
to
Subject
Y
V
E
Max
im jm J j I i in im in jm I i im im J j jm jm m,
,
2
,
1
&
;
,
,
2
,
1
;
0
,
,
,
2
,
1
:
0
&
1
:
1 1 1 1
And
E
mis the efficiency of the th jmY
DMU
m
;
is the thj
output of the th jmV
DMU
m
;
is the weightof that output ;
X
im is the thi
input of the th imU
DMU
m
;
is the weight of that input;in jn
and
X
Y
are the thj
and thi
inputs respectively of theDMU
,
n
1
,
2
,...,
N
.
Vega and Urrutia (2001) drew up a framework for pollution-sensitive human development index, which they called as HDPI. The novelty lies in the incorporation into HDI of an environmental fact or measured in terms of
CO
2emissions from industrial processes. HDPI penalizes those countries which have obtained growth in income at the expense of damaging the environment. The met hod adopted to construct HDPI is very much similar to that of UNDP method but with few exceptions. They did not bring any change in the formula and variables for the construction of health and education indices. But in case of income index, it was taken as the harmonic average of two indices, namely GDP index and Environment Behavior Index (EBI). The EBI was defined as the difference between unity andCO
2index
. The maximum and minimum values (goal posts) were taken as (60, 0) tonnes per capita per annum based on global data for 30 years. The HDPI was then constructed for 165 countries as the arithmetic average of three dimension indices such as education index
H
1 , health index
H
2 , and pollution adjusted GDP index
H
3P
as follows:
H
H
H
P
HDPI
1 2 33
1
I
CO
EBI
and
EBI
H
P
H
where
21 1 1 1
3
3
1
2
To take care of inequality in GDP and pollution, they adopted Atkinson formula where
stands for degree of aversion to inequality. When
0
,
there is no penalty and the result is the simple arithmetic average. As
grows, pollution-sensitive income decreases and the inequality between the levels of the two indicators is increasingly punished. In their calculation they gave a value of 2 to
, implying adoption of harmonic mean of GDP and EBI Indices for the construction of pollution adjusted GDP index. However, at the concluding remarks they suggested that the future researchers should make attempts to incorporate other pollut ant emissions covering air, water and soil pollution, and other environmental indicators such as deforestation, energy consumption, the exhausting of physical resources, etc.According to Neumayer (2001) a country’s human development is potentially unsustainable if the net depreciation of its manufactured and natural capital (resource) stock is bigger than its investment; and this can be judged from the magnitude of genuine saving (net saving minus depreciation of natural capital) by examining whether it is positive or negative. In order to measure depreciation of the natural resource stock, though there is no universally agreed method, he preferred to use the El Serafy (1991) method. He said that theoretically it is possible to improve literacy and educational enrolment as well as life expectancy with an unsustainable income stream and indeed with falling income levels if only more and more of the income is spent on health and education. But in t he long run these cannot be sust ainable unless income is sustainable. For this reason he proposed to link the HDI with sustainability of income but not with environment as attempted by many other academicians including Vega and Urrutia (2001). The proposal was based on the line of thinking of HDR (1998) which demanded consumption to be sustainable. M aking an analysis for 155 countries he concluded that the indicated human development of 42 countries were potentially unsustainable. M ost of these countries had a low HDI, which means that even this low achievement is not sustainable in the future.
nutrition or education, while at high income levels an extra $100 may typically buy extra computer memory or snacks. However, some authors were opposed to the concavity assumption (Srinivasan, 1994; Sen, 1981). To settle this issue he made an empirical investigation by estimating the correlation coefficients between income (GDP, the square of GDP and natural logarithm of GDP) and other dimension variables of HDI. The findings revealed that correlation coefficients were largest and statistically significant with logarithm of GDP as compared to GDP and the square of GDP implying the fact that higher levels of GDP are associated with greater levels of development, but at a decreasing rate. This proved concavity assumption and thus justified the application of natural logarithm to GDP for constructing HDI.
Panigrahi and Sivramkrishna (2002) stated that HDI is sensitive to the change of the choice of limits. Any change of maximum and minimum values (goal posts) brought out in any dimension variable not only change absolute values of HDI of different countries but also their rankings. To overcome this problem they proposed to construct an adjusted HDI, called as
AHDI
through five steps:Step 1: First construct dimension indices of health, education and income (i.e., LEB, EDN and GDP) of different nations using UNDP method;
Step 2: Define
k h
L
L
l
, whereL
his the maximum actual LEB index value, say, is of country h, andL
k is the minimum actual LEB index value, say, of country k;n m
E
E
e
, whereE
m is the maximum actual EDN index value, say, of country m, andE
n is the minimum actual EDN index value, say, of country n;q p
G
G
g
, whereG
p is the maximum actual GDP index value, say, of country p, andG
q is theminimum actual GDP index value, say, of country q.
Step 3: Choose the minimum of
l
e
,
g
. Let us suppose thatl
is the minimum value among these. Then converte
andg
intog
l
g
and
e
l
e
*
*
Step 4: Since
l
is found to be minimum, compute adjust edL
j,
E
jand
G
jas follows:j j
j j
j
j
L
aE
e
E
aG
g
G
aL
;
*;
*Step 5: Finally construct adjusted human development index as:
3
j j j
aE
aG
aL
AHDI
across attributes. Instead of taking three usual dimensions he proposed estimation of HDI based on ‘k’ no. of dimensions/ attributes as follows:
.
'
'
1
,
1
.
1
0
,
1
1 1 1attributes
k
for
UNDP
by
suggested
as
HDI
m
M
m
x
k
I
becomes
I
r
For
r
with
decreases
I
where
r
m
M
m
x
k
I
ki i i
i i r r r k
i i i
i i r
The properties of t he index are stated as follows:
0
,
1
,
,
.
:
;
...,
,
,
...,
,
,
...,
,
,
,
1
,
0
,
:
;
,...,
,
1
,
0
:
2 1 2 1 2 2 1 1matrix
n
permutatio
k
X
k
any
is
P
where
aP
I
a
I
a
all
For
SYM
b
b
b
I
a
a
a
I
b
a
b
a
b
a
I
b
a
any
For
CIA
z
z
z
I
z
any
For
NOM
k k k k k k
The above mentioned properties permit us to determine the percentage contributions made by the attributes to overall achievement. These contributions once determined can in turn be used to separate the attributes according to their degrees of sensitivity to wellbeing. The less susceptible attributes would need policy attention to improve their contributions since all quality-of-life attributes should carry approximately equal weights to achieve an ideal standard of living.
A new measure of human development was proposed by Despotis (2004) on the line of M ahlberg and Obersteiner (2001) in a two-phase process. They kept all the assumptions underlying the HDI except that of the equal-weights scheme for the three major indicators. In the first phase, an ideal value of the composite HDI was estimated for each country by a DEA like index-maximizing model. Then in the second stage, a goal programming model was solved to obtain global estimates of human development, based on optimal common weights for the component indicators. They claimed that their new measure of human development is comparable and highly correlated with the HDI. The superiority of the new measure is that the weights assumed for the component indicators, as a result of an optimization process, are less arbitrary and contestable.
methodology adopted by UNDP and the Fuzzy Set Theory yielded different rankings of countries in terms of HDI. The same conclusion was equally valid for different component indices of HWB.
Jha and Bhanumurthy (2004) mentioned in their paper that in the pristine natural state there is no entropy, and hence, no degradation or disorganization of the state of the world (which the present author does not agree). Increase in entropy accelerates due to unwarranted human activity, be it production or consumption. They supported the view of other scholars t hat global environmental degradation which has direct bearing on overall human development is not only caused by the factors related to production/ income (Grossman & Krueger, 1992, 1994; Radetzki, 1992; Panayotou, 1997; Grossman, 1995) but also by consumption (Ehrlich and Holdren, 1971).Their basic hypothesis is that excessive and lop-sided consumption patterns are the most fundamental cause of entropy. Therefore, it is important to identify and measure their contribution to global environmental degradation. According to them production-based approaches do not capture the degradation that is caused directly by consumption in terms of vehicular pollution, excessive use of water resources, energy, paper, etc. While consumption is a derivative of income, there is reason to believe that consumption may nonetheless be a better measure than income in relation to the impact on environmental degradation. Thus as an alternative to UNDP’s income-based human development index, they developed a consumption-based HDI.
The measurement of human well-being is not only limited to economic indicators but also social, institutional and ecological ones. "As a typical example ... one can cite Prescott-Allen’s (2001) human wellbeing index ... and ecosystem well-being index (EWI), integrating two indices with social-economical and environmental dimensions" (Zaim, 2005: 1). He also stated that HDI not only fails to measure performance comparisons across time but also dependent on artificially assigned weights. To overcome these limitations he proposed a framework for incorporating environmental indicators to the measurement of human well-being. Furthermore he proposed an improvement index which alleviates the well-known deficiency of across-time comparison of the deprivation index. The advantage of the proposed index is that it does not require normative judgment in the selection of weights to aggregate over constituent indices. Rather, within an activity analysis framework, optimally chosen weights are determined by the data. In developing the index, due emphasis was put on production with negative externalities, and directional distance functions.
relative performance of the countries in human development based on optimal weights they presented a fuzzy multiple-objective DEA model.
Grimm et al. (2008) following the footsteps of Sagar and Najam stated that HDI looks at average achievements only and, thus, does not take into account the distributional aspects of human development within a country. To overcome this they focused on inequality in human development across the income distribution and generated a separate HDI for different segments of income distribution.
Nathan et al. (2008) questioned the linear averaging (LA) method of constructing HDI since it assumes perfect substitutability among indices. They not only questioned the appropriateness of LA method but also proposed a new method which they called it as Displaced Ideal (DI) method. The DI method is based on the concept that the better syst em should have less distance from ideal. In a three-dimensional HDI space the ideal denotes full attainment on all the three dimensions of health (h), education (e), and income (y) [i.e., h=e=y=1]. Inverse of the normalized Euclidian distance from the ideal gives the HDI through DI method as follows:
3
1
1
1
1
2 2
2
y
e
h
HDI
DIWhere
1
h
2
1
e
2
1
y
2 is the Euclidian distance from the ideal and when Euclidian distance is divided by3
it gets normalized in the three-dimensional space; further when it getssubtracted from unity gives the inverse which is known as
HDI
DI.which has been used in the literature to measure quality of life and human development. The formula used to estimate DP2 was:
R
i
n
d
DP
mj
j j j
ij
i
1
;
1
,
2
,...,
2
1
2 1 ,..., 1
,
Where:
i
1
,
2
,...,
n
are cases (countries/ districts) andm
is the number of constituent variables,X
,such that
x
ij
X
;
i
1
,
2
,...,
n
;
j
1
,
2
,...,
m
;
d
ij
x
ij
x
j;
i
1
,
2
,...,
n
;
j
1
,
2
,...,
m
;
is the refe-rence case pertaining to
ij ji
x
;
min
is the standard deviation of variablej
;
R
2j,j1,...,1;
j
1
;
is thecoefficient of determination in the regression of
x
jover
x
j1,x
j2,...
,
x
1.Ray (2008) constructed a Social Development Index (SDI) suitably combining ten physical indicators across 102 countries on the lines of PQLI considering development as a multidimensional phenomenon. Since physical indicators chosen for the study were highly correlated, correlation method of obtaining weights was considered by him to be the most suitable one among the host of methods. His findings revealed that correlation method applied on highly correlated variables of SDI yielded near uniform weights. Based on his findings and analysis on the indices of SDI and HDI, he asserted that SDI works better than HDI as a measure of development for an international comparison.
justification. They further proposed a new set of variables for the health and education dimensions that are intended to improve the sensitivity of those partial indicators especially for highly developed countries. Life potential (per capita) was proposed in place of life expectancy and expected years of schooling (approach followed by the American Human Development Index) in place of education which puts more weights on literacy. Life potential index is a measure of the average life expectancy of the population, taking into account its demographic structure. The Human M ortality Database that provides both the life tables and the distribution of the population by age for almost all the countries in the OECD w as used by them to construct Life Potential Index
LPI
following their suggested formula:
0
1
x x x
e
N
N
LPI
Where:
N
xis the number of people of agex
,e
xis the expected number of years that people of thatage will live and
N
is the population size.Herrero et al. (2012) further stated that t he principle of ‘decreasing marginal utility’ is not only applicable to income but also to health and education. If we think of the HDI more as a welfare measure, it might be reasonable to keep measuring all the three variables in terms of logs. If we rather think of the HDI as an indicator that provides a summary description of the capacity of a country to grow, compete and enhance material wellbeing, as we actually do, the use of logs does not seem justified in any of its variables. Indeed, its use helps conceal the existing differences and has doubtful implications on the substitution rates. Besides, the normalization formula adopted by UNDP keeps the use of goalposts for maximum and minimum values in order to transform the original values into relative gains, by subtracting a minimum value and dividing by the range of the variable. While doing so it makes the whole construction of the HDI dependent on the arbitrary choices of the normalization parameters, in particular, on the minimum values. One can easily manipulate the ranking by changing the minimum values of a dimension variable. The way out for
this problem is to convert the variable (x) into
*x
x
where *x
could be any reference value duringa period or the maximum value. To bring an improvement over HDI constructed in the 2010 report of UNDP they proposed the following changes in terms of variable, normalization process and aggregation:
partial indicator; and material well-being to be measured in terms of the egalitarian equivalent per capita GNI (i.e. the amount of income that equally distributed would yield the same social welfare as the current income distribution) without logs, to avoid inconsistencies and undesired side effects, and to take distributional aspects into account in a consistent manner.
All variables should be normalized in terms of shares of some maximum values which would ensure an easy interpretation of the normalized values and, most importantly, would make the resulting ranking of the countries, the marginal rates of substitution, and the pair-wise comparison of relative achievements independent on t he normalization parameters.
Geometric mean should be used to make an average as it is justified on theoretical grounds.M ajor Refinements undertaken by UNDP: The complete list of changes in the methodology brought out by UNDP after its publication of first HDR in 1990 is presented in Table 3. It is seen that UNDP has been exceptionally receptive to all those criticisms mentioned earlier regarding poor data, incorrect choice of indicators, weighting of dimension variables, choice of goal posts, adjustment of income to inequality correction, and poor specification (Stanton, 2007). On some points, index has been changed significantly in response to its critics. Though the methodology has been modified several times over the years, the main framework has remained substantially unchanged. In particular, the three dimensions such as income, life expectancy, and literacy have not been changed, although the methods of computing these indices have been adjusted. There has also been no change in the assumption of equal weighting of the three dimensions in the construction of HDI. However, the assumption of complete substitutability among the dimension variables was changed in 2010 report. What is worrisome is that the methodology has been quite unstable and changing very frequently leading to difficulties in comparison and interpretation of indices over time. Of course, t here is no such problem of comparison across countries and their rankings.
the evolution of the concept of human development and publication of HDR (Haq, 1995). The human development reports over the years have made its most distinctive contribution to the larger development discourse by highlighting and asserting that education, health and income are basic and essential to human development. In less than two and half decades the HDR has evolved from being merely an annual report into an agenda for action for governments and NGOs and a catalyst for new thinking in development economics. Although the report started with a poor methodology, thanks to the galaxy of scholars for their untiring efforts and invaluable contributions in the successive years that enabled UNDP in refining its methodology to a large extent. There is no denying fact that there is no end to refinements, the purpose for which Haq struggled in his entire life, has been served.
References:
Anand, S. and Sen, A. (1992) “ Human Development Index: M ethodology and M easurement” , Human Development Report Office Occasional Paper No. 12, New York: UNDP.
Baliamoune-Lutz, M . (2004) “ On the M easurement of Human Well-being: Fuzzy Set Theory and Sen’s Capability Approach” , Research Paper No. 2004/ 16, World Institute for Development Economics Research, United Nations University.
Baru, S. (1998) "M ahbub ul Haq and Human Development: A Tribute" Economic and Polit ical Weekly, 33(35): 2275-2279.
Berenger, V. and Verdier-Chouchane, A. (2007) “ M ultidimensional M easures of Well-Being: Standard of Living and Quality of Life across Countries” World Development, 35(7): 1259–1276. Bulmer, M . (1983) “ The M ethodology of Early Social Indicator Research: William Fielding Ogburn and Recent Social Trends, 1933” , Social Indicat ors Research, 13(2): 109–130.
Cahill, M .B. (2002) "Diminishing Returns to GDP and the Human Development Index" Applied Economics Let t ers, 9(13): 885-887.
Chakravarty, S.R. (2003) “A Generalized Human Development Index” , Review of Development Economics, 7(1), 99–114.
Chan, A. C. M ., Cheng, S.-T., Philipps, D. R., Chi, I. and Ho, S. S. Y. (2004) “ Constructing a Quality of Life Scale for Older Chinese People in Hong Kong (HKQOLOCP)” Social Indicat ors Research, 69(3): 279–301.
Chatterjee, S.K. (2005) "M easurement of Human Development: An Alternative Approach" Journal of Human Development, 6(1): 31-53.
Collomb, J.E Alavalapati, J.R. and Fik, T. (2012) "Building a M ultidimensional Wellbeing Index for Rural Populations in Northeastern Namibia" Journal of Human Development and Capabilities, 13(2): 227-246.
Cummins, R. (2005) “ M oving from A Quality Of Life Concept to A Theory” Journal of Int ellect ual Disabilit y Research, 49(10): 699–706.
Desai, M . (1991) “ Human Development: Concepts and M easurement” , European Economic Review , 35 (2&3), 350-357.
Desai, M . (1995) "Greening of the HDI?" In M cGillivray, A. (ed.) Account ing for Change, The New Economics Foundation, London, pp. 21–36.
Despotis, D.K. (2004) “ A Reassessment of the Human Development Index via Data Envelopment Analysis” Journal of t he Operat ional Research Society, 56(8): 969-980.
Doessel, D.P. and Gounder, R. (1991) “ International Comparisons of the Standards of Living and the Human Development Index” , Discussion Papers in Economics No. 72, Brisbane: Department of Economics, University of Queensland.
Ehrlich and Holdren (1971) “ Impact of Population Growth” , Science, 171(3197): 1212–1217.
El Serafy, S., (1991) “ The Environment as Capital” In Costanza, R. (ed.) Ecological Economics: The Science and M anagement of Sust ainabilit y, New York: Columbia University Press, pp. 168–175. Foster, J.E., Lopez-Calva, L.F. and Szekely, M . (2005) "M easuring the Distribution of Human Development: M ethodology and an Application to M exico" Journal of Human Development, 6(1): 5-29.
Gasper, D. (2004) “ Conceptualizing Human Needs and Well-being” , Hanse Institute for Advanced Study, Germany: Delmenhorst.
Grimm, M ., Harttgen, K., Klasen, S. and M isselhorn, M . (2008) “ A Human Development Index by Income Groups” , World Development , 36(12): 2527-2546.
Grossman, G.M . (1995) “ Pollution and Growth: What do we know?” , in I. Goldin and L.A.Winters (eds.), The Economics of Sust ainable Development, New York: Cambridge University Press, pp. 19– 46.
Grossman, G.M . and A. B.Krueger (1992) Environment al Impact s of A Nort h American Free Trade Agreement, New Jersey: Woodrow Wilson School, Princeton.
Grossman, G.M . and A.B. Krueger (1994) “Economic Grow t h and t he Environment ” , NBER Working Paper #4634: National Bureau of Economic Research.
Hagerty, M .R., Cummins, R.A., Ferriss, A.L., Land, K, M ichalos, A.C., Peterson, M ., Sharpe, A., Sirgy, J., and Vogel, J. (2001) “ Quality of Life Indexes for National Policy: Review and Agenda for Research” Social Indicat ors Research, 55(1): 1–96.
Haq, M ahbub ul (1995) Reflect ions on Human Development, New York: Oxford University Press. Herrero, C., M artinez, R. and Villar, A. (2010) "Improving the M easurement of Human Development", UNDP: Human Development Research Paper 2010/ 12.
Herrero, C., M artinez, R. and Villar, A. (2012) “ A Newer Human Development Index” Journal of Human Development and Capabilit ies, 13(2): 247-268.
Hicks (1997) “ The Inequality-Adjusted Human Development Index: A Constructive Proposal” World Development, 25(8): 1283-1298.
Hopkins, M . (1991) “ Human Development Revisited: A New UNDP Report” , World Development , 19(10): 1469-1473.
Jha, R. and Bhanumurthy, K.V. (2004) “ A Consumption Based Human Development Index and the Global Environmental Kuznets Curve” . http:/ / papers.ssrn.com/ sol3/ papers.cfm?abstract_id=509243 Kahneman, D. and Krueger, A. B. (2006) “ Developments in the M easurement of Subjective Wellbeing” Journal of Economic Perspect ives, 20(1): 3–24.
Kelly, A.C. (1991) “ The Human Development Index: Handle With Care” , Populat ion Development Review , 17(2), 315-324.
Kingdon, G. G. and Knight, J. (2006) “ Subjective Well-Being Poverty vs. Income Poverty and Capabilities Poverty?” Journal of Development St udies, 42(7): 1199–1224.
Lai, Dejian (2000) “ Temporal Analysis of Human Development Indicators: Principal Component Approach” Social Indicat ors Research, 51(3): 331–366.
Lee, Lin and Fang (2006) “ A Fuzzy M ultiple Objective DEA for the Human Development Index” in B. Gabrys, R.J. Howlett, and L.C. Jain (eds.): KES 2006, Part II, LNAI 4252, pp. 922 – 928.
Lind, N.C. (1992) “ Some thoughts on the human development index” Social Indicat ors Research, 27(1): 89-101.
M ahlberg, B. and Obersteiner, M . (2001) “ Re-measuring the HDI by Data Envelopment Analysis” International Institute for Applied Systems Analysis (IIASA), Interim Report IR-01-069, Austria: Luxemburg.
M cGillivray, M . (1991) “ The human Development Index: Yet anot her Redundant Composite Development Indicator?” World Development , 19(10), 1461-1468.
M cGillivray, M . (1992) “ M easuring Development: A Statistical Critique of the UNDP's Human Development Index” , Working Paper Series No. 135, The Hague: Institute of Social Studies.
Nathan, H.S.K., M ishra, S., and Reddy, B.S. (2008) "An Alternative Approach to M easure HDI" M umbai, INDIA: Indira Gandhi Institute of Development Research (IGIDR), pp. 1-23.
Neumayer, E. (2001) "The Human Development Index and Sustainability— A Constructive Proposal" Ecological Economics, 39(1): 101–114.
Noorbakhsh, F. (1998a) "A M odified Human Development Index", World Development, 26(3): 517-528.
Noorbakhsh, F. (1998b) "The Human Development Indices: Some Technical Issues and Alternative Indices" Journal of Int ernat ional Development, 10(5): 589–605.
Palazzi, P. and Lauri, A. (1998) “ The Human Development Index: Suggested Corrections.” Banca Nazionale del Lavoro (BNP) Quart erly Review, 51(205): 193-221.
Panayotou, T. (1997) “ Demystifying the Environmental Kuznets Curve: Turning a Black Box into a Policy Tool” , Environment and Development Economics, 2(4): 465–484.
Panigrahi, R. and Sivramkrishna, S. (2002) "An Adjusted Human Development Index: Robust Country Rankings with Respect to the Choice of Fixed M aximum and M inimum Indicator Values" Journal of Human Development, 3(2): 301-311.
Prescott-Allen, R. (2001) The Wellbeing of Nat ions: A Count ry-by-Count ry Index of Qualit y of Life and t he Environment. Covel, CA: Island Press.
Pyatt, G. (1991) “ Poverty: A Wasted Decade” , European Economic Review , 35(2&3), 358-365.
Radetzki, M . (1992) “ Economic Growth and the Environment” , in P. Low (ed.) Int ernat ional Trade and Environment, Washington D.C.: The World Bank, pp. 121–136.
Ram, R. (1982) "Composite Indices of Physical Quality of Life, Basic Needs fulfillment, and Income: A Principal Component Representation" Journal of Development Economics, 11(2): 227-247.
Rao, V.V.B. (1991) “ Human Development Report 1990: Review and Assessment” , World Development , 19(10), 1451-1460.
Raworth, K. and Stewar, D. (2003) “ Critiques of the Human Development Index” in Fukuda-Parr and Shiva Kumar (eds.) Readings in Human Development, New Delhi: Oxford University Press, pp.140-152.
Ray, A.K. (2008) “ M easurement of Social Development: An International Comparison” Social Indicat ors Research, 86(1): 1–46.
Sagar, A.D. and Najam, A. (1998) “ The Human Development Index: A Critical Review” , Ecological Economics, 25(3): 249-264.
Sen, A.K. (1985) Commodit ies and Capabilit ies, Amsterdam: North-Holland. Sen, A.K. (1987) St andard of Living, Cambridge: Cambridge University Press. Sen, A.K. (1997) On Economic Inequalit y, Oxford: Clarendon.
Sirgy, M .J., M ichalos, A.C., Ferriss, A.L., Easterlin, R.A., Patrick, D. and Pavot , W. (2006) “ The Quality-of-life (QOL) Research M ovement: Past, Present, and Future” Social Indicat ors Research, 76(3): 343– 466.
Stanton, E.A. (2007) "The Human Development Index: A History" Working Paper Series No. 127, Amherst: Political Economy of Research Institute, University of M assachusetts.
Trabold-NuÈbler, H. (1991) “ The Human Development Index: A New Development Indicator?” Int ereconomics, 26(5), 236-243.
Vega, M .C.L. De La and Urrutia A.M . (2001) "HDPI: A Framework for Pollution-Sensitive Human Development Indicators" Environment , Development and Sust ainabilit y 3(3): 199–215.
Zaim, Osman (2005) “ A Framework for Incorporating Environmental Indicators to the M easurement of Human Well-Being” , Research Paper No. 2005/ 05, World Institute for Development Economics Research (WIDER), United Nations University.