ISSN Online: 2331-4249 ISSN Print: 2331-4222
Applicability Evaluation of a Laser Light-Mater
Interaction Based Computational Tool on
Status Identification of Applied
Micro-Structured Coatings
Mauricio Zadra Pacheco
1,2,3, Daniel Vriesman
2, Hauke Brüning
1, Kai Brune
1,
Welchy Leite Cavalcanti
1, Bernd Mayer
1,31Fraunhofer Institute for Manufacturing and Advanced Materials (IFAM), Bremen, Germany 2State University of Ponta Grossa (UEPG), Ponta Grossa, Brazil
3University of Bremen (UniBremen), Bremen, Germany
Abstract
The current work aims at evaluating a proposed method based on a computa-tional tool developed using Object-Oriented Programming to identify the status of micro-structured surfaces. In this case, these are micro-structured coatings with riblet microstructure developed by Fraunhofer Institute–IFAM, by building a graphical reproduction of the analyzed surface and calculating an expected laser reflection intensity acquired by a laser sensor device, the proposed method is assessed by using the simplest case: a flat surface, and an optimal case: an intact riblet surface. The results corroborate the calculations to be applied to further steps from more complex cases of degradation and to diverse riblets geometries. Based on Huygens-Fresnel and Fraunhofer diffrac-tion theories, the calculadiffrac-tions developed and demonstrated in this paper im-proved the nondestructive tests to support the status identification of the mi-cro structured coatings, e.g. riblet structures based on shark skin used in ship-ping and aerospace industries. This work is assured required quality of the riblet coating identifying the number of structures and expected geometry us-ing implemented calculations to foresee the laser reflection intensity acquired by a laser sensor device with 3 detectors, for instance, a riblet structure could be graphically reproduced, analyzed and completely identified based on the application of the theoretical optics applied on this work.
Keywords
Structured Coatings, Laser Sensor, Quality Assurance, Object-Oriented Programming
How to cite this paper: Pacheco, M.Z., Vriesman, D., Brüning, H., Brune, K., Ca-valcanti, W.L. and Mayer, B. (2017) Appli-cability Evaluation of a Laser Light-Mater Interaction Based Computational Tool on Status Identification of Applied Micro- Structured Coatings. World Journal of En-gineering and Technology, 5, 154-173. https://doi.org/10.4236/wjet.2017.51013
Received: December 19, 2016 Accepted: February 25, 2017 Published: February 28, 2017
Copyright © 2017 by authors and Scientific Research Publishing Inc. This work is licensed under the Creative Commons Attribution International License (CC BY 4.0).
1. Introduction
Status identification of structured surfaces used in aviation industry, e.g. shark skin, called tiny ribs (riblets), is an option to support the quality assurance and keep desired performance of these coatings. Riblets are used as an alternative to decrease drag and consequently save fuel and reduce Greenhouse gas (GHG) emissions [1]. These riblets are part of strategical and technological possibilities to fulfill the decision taken by European Union that CO2 emissions from the
avi-ation and shipping industry must be reduced by 10% and 20% respectively, in a period of medium to long term [2], for instance, due to climate change caused by GHG emissions [3].
Quality assurance using Non-destructive tests (NDT) is a powerful tool in terms of reliability, costs and easiness. NDT improvements are related to safety of aviation components and structures. The NDT technique refers to testing methods, specially used to analyze structural parts or objects without harming or affect future usefulness. The main goals of NDT are to identify hidden defects or damages. Furthermore, NDT material properties can be evaluated and the structure geometry can be measured [4]. According to the American Society for Testing and Materials [5], the concept of NDT is based on the “development and application of technical methods that examine materials and components, in order to detect, measure and evaluate discontinuities, defects and other imper-fections. Integrity, properties and composition assessment and measure geome-trical characteristics are evaluated by NDT as well”. In special attention to riblet structure coatings, geometrical characteristics and integrity are important para-meters to keep the desired functionality. Among the methods of possible tests to be applied to this specific analysis of coatings based on riblet structures, non- destructive testing tends to be powerful for this application.
There is a large range of NDTs available and especially for those applied in aviation industry; it is relevant to consider, for instance, health monitoring tests using Fiber Bragg Grating (FBG) sensors are used in order to be applied to du-rability tests of a composite wing structure. FBG sensors could be detecting toughly visible impact damages due the distortion of the spectrum by the strain change [6].
Characterization of micro structured surfaces has to be achieved in nanoscale level. Research on characterization of surfaces is being made using full field po-larized light-scattering, and experimental findings have reached a good agree-ment with theoretical predictions considering different surface roughness [7].
The laser light behavior prediction is a relevant step for the implementation of this proposed technique. The calculations based on Huygens-Fresnel and Fraunhofer diffraction theories are the initial step to fulfill the computational tool implementation and to provide a knowledge database to be compared to experimental measurements.
The application of non-destructive testing must be taken into account in order to achieve the main objective, identifying the structural geometry of the coating based on riblet structure with the functionality of drag reduction. The purpose of this work in the beginning is graphically reproducing the original riblet structure geometry, which will be the basis for all calculations and data analysis and en-sure the quality of the coating characteristics.
This work aims at introducing a method to validate the computational tool outputs in order to build a reliable computational tool to support analysis and make decisions in aviation industry production and maintenance. The “Intro-duction” section presents the state of the art related to non-destructive tests, mi-cro structured surfaces and applications and optics theories applied to develop the proposed method. Section “Experimental part” expounds about the original geometry used to define the riblet surface and the main parameters to set the al-gorithm calculations, the development techniques and theoretical foundation will be detailed as well. Section “Results and Discussions” discuss the main re-sults obtained in cases explored and defined previously, and “Conclusions” ex-plain the contributions of the work to improve a robust computational tool able to identify micro-structured surface status.
2. Experimental Part
The implementation of the proposed technique, performing the calculations us-ing Object Oriented Programmus-ing (OOP) is based in a code developed in Java language and the support of a consistent Database Management System (DbMS). In order to be applied in production and maintenance lines on aviation indus-tries, it is necessary to provide specific tools and techniques based on computer science field with the intention of support making decision on quality assurance of the structured coatings.
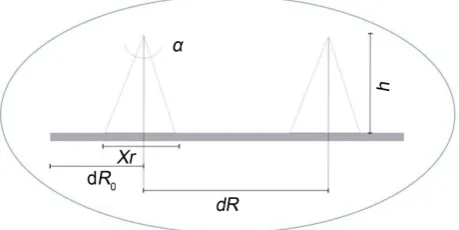
First step to reach the target is to build a graphical representation of the sur-face. The original geometry of the riblet structured surface defined in this work is based on the structure developed by Fraunhofer Institute-IFAM, as cited by Stenzel et al.[2]. The model consists in sharp-peaked riblets whose characteris-tics are presented in Figure 1, with the following characteristics: triangular shape, distance between bottom center riblets (dR), height (h) of the riblet and angle of the riblet tip (α).
The riblets will be generated one by one, following cartesian coordinates in space and will be defined according to Equation (1) and shown in Figure 1:
(
)
2 tan 2
Xr= h
α
(1)Figure 1. Sketch of the intact riblet modeling.
Xr = riblet width;
h = height of the riblet;
α = angle of the riblet tip.
The original geometry starts in a plane section, with the half measure of the distance between riblet tips, as:
0
dR =dR 2 (2)
where dR is the distance between riblet bottom centers. In order to contextualize this work, degradation is defined as the “act or process of damaging or ruining something” [10]. Coating degradation is a combination of both chemical and physical processes [11]. In airplanes coatings there is deterioration in the coating performance due to weather and use. Anti-corrosion procedures are not useful to restore the original surface. So the coating needs to be completely stripped and reapplied, thus this process is expensive [12].
Aiming to reproduce the status of the surfaces on airplanes with riblet coating applied, rebuilding the riblet geometry in degraded state is necessary. In this study, a pattern of degradation is considered to be able to validate the output data and a total degradation of the structured coating is the investigated degra-dation pattern used as test approach to the calculations. A total degradegra-dation, considering totally smooth surface of the sample, is the easiest case to validate the calculations and support the further research steps.
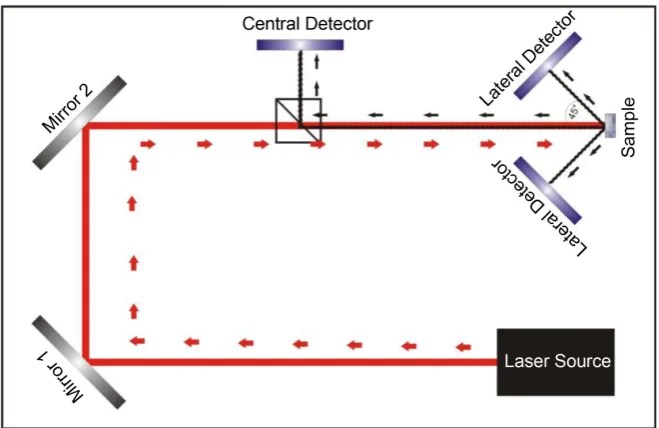
In this work, an experimental fast sampling sensor setup using Non-contacting laser probing is being developed, based on the Huygens-Fresnel and Fraunhofer diffraction theories combined with ray tracing calculation methods. This part of the work is the software development to perform analysis and treatment of out-put data provided by a laser sensor (Figure 2) defined by Imlau et al. [8]. The computational tool is used to interpret the obtained diffraction patterns and as a way to simulate the structured surface status from a given pattern. Thus, the software is developed to generate consistent information for analysis and deci-sion-making regarding the surface structure and its maintenance.
Figure 2. Schematic structure of the laser sensor device for the investigation of a riblet structure. The intensity distributions of the reflections on the riblet sample are detected with the central and lateral detectors based on [8].
The theory behind the work consists of OOP encapsulation techniques and abstraction concepts in order to incorporate the laser and surface characteristics within the code in appropriately designed objects, classes and subclasses. The OOP abstraction is the key for the code design and the reflection of the laser beam is the key to evaluate the integrity of the riblet surface.
In this stage the relevant attributes of optical phenomena, surface characteris-tics and their interactions have been designed and not needed features have been discarded. The resulting computational tool provides a user friendly graphical environment. The visualization interface allows developers and final users to set up different platforms for analyses accordingly to their requirements. Scattering intensity distributions obtained experimentally and through the computational tool are presented. They are obtained for intact surfaces and for different surface degradation levels and patterns, varying parameters as incidence angle and beam wavelength.
Most part of the laser characteristics are related to the Huygens-Fresnel beha-vior, that means, the wave will behave mainly as a spherical wave. The laser beam is monochromatic light, it has a coherent pattern and it is in accordance of the experiments of Thomas Young (Slit experiment) [13]. The calculations of the intensity are related to the properties of the laser system:
Wave length: 632.8 nm; 2048 pixels (1 pixel ≈ 14 µm); Angular Frequency: 297.1015 rad/s;
Distance between sample and the central detector: 40 cm.
[image:5.595.209.539.70.284.2](
)
0 sinp
E =E ∗
ω ϕ
t+ (Sinusoidal wave) (3)( )
(
)
2( )
(
)
20
2 2 1 2 2 1
1 1 1 1
2
n n n n
p i i i i
i i i i
I
I C U C U − S U S U −
= = = =
= − + −
∑
∑
∑
∑
(4)Related to Equation (1), intensity calculated in a point p on detector is ob-tained by the square of the electric field calculated, as demonstrated on Equation (5):
2
p p
I =E (5)
Assumption is made that ωt is a variation between −2π and 2π, and φ is a relation between a reference point on detector and the amount of calculations to the surface, and is assumed that E0 is equals 1.
Using Equation (2), starting from Fresnel integration, a diffraction pattern is calculated which should be acquired by the detectors. Applying Fresnel integra-tion on the equaintegra-tion, in combinaintegra-tion with transcendental funcintegra-tions with com-plete tables of values, this function can be calculated beyond Euler spiral [14], which is a geometric representation of Fresnel integration in a complex plan.
Nowadays, these integrations can be fast solved using computational tools. Reis et al.[15] used this approach to characterize a diffraction grid with n non- symmetric slits and arbitrary widths, and the results can be a base to further steps of this research, which will introduce more detailed structured surfaces, considering variations on intensity patterns acquired by detectors, aiming charac- terization of the analyzed samples.
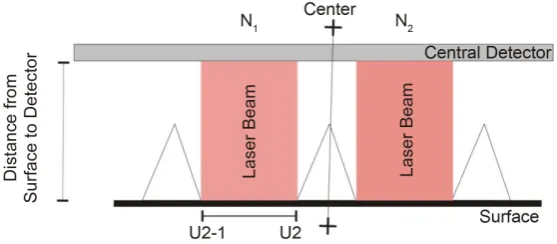
Equation (2) assumes that n is the number of reflections to a central detector without interference, and U2 is related to calculations taking into account the last position of reflection on surface for each continuous reflection and U2-1 is related to calculations taking into account the first position of reflection on sur-face for each continuous reflection, as shown in Figure 3 and described on Equ-ation (4).
To apply the proposed techniques we are setting the software with the main parameters to virtually build a sample with the characteristics used to perform riblets at Fraunhofer Institute-IFAM. The software is able to change these para-meters as needed to simulate different types of riblets.
Figure 3. Schematic representation of the reflection in a riblet structure,
[image:6.595.235.514.582.704.2]The main parameters are: height of the riblet (h); distance between riblets (d), which is related to the distance between bottom centers of the riblets; angle at the tip of the riblet (α), length (x) and the width(y) of the sample.
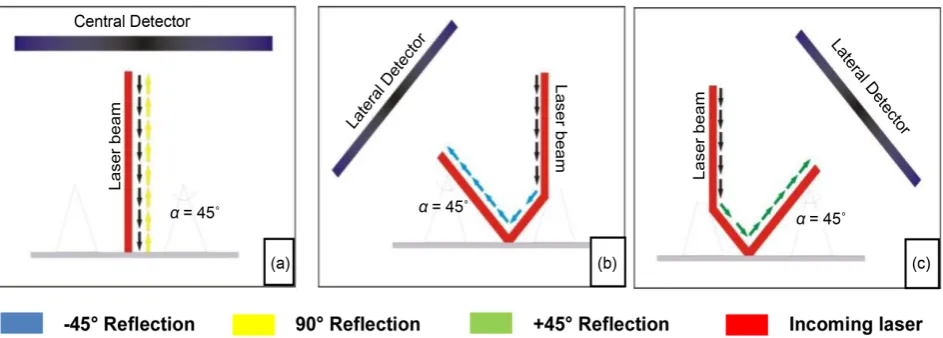
[image:7.595.66.538.268.437.2]The structure of the laser beam is filled in the next step. The user should input the parameters to set the laser incidence and the laser reflection will be graphi-cally reproduced. The main parameters are the initial position of the laser (lx0), related to the position on the x axis of the original geometry; the number of the laser beams (lxn); and the distance (ld) between the laser beams; all these para-meters are saved to generate a 2D visualization of the sample with the laser beam incidence and the reflection of the beams. In this step all beam incidences and reflections are calculated, which allows building a 2D visualization of the struc-ture (Figure 4 and Figure 5).
Figure 4. Schematic representation of the interaction of light with the intact riblet surface. Three possible cases are presented. (a):
vertical incidence on the surface. The beam is reflected back to the central detector. (b), (c): Interaction with a riblet flank. By ref-lection, the beam is projected in the direction of 45˚ to the base of the surface and then follows to the lateral detectors.
Figure 5. 2D Plot-120 µm laser spot reflection-intact structure-generated by computational
[image:7.595.203.525.498.705.2]The riblet degradation can be simulated in the next step. At this stage of de-velopment, we can set the degradation as a regular degradation with a perfect flat cut on the tip of the riblet.
The percentage of degradation is varied from 0% to 100%, related to the per-centage for the exact point on the structure of the riblet where the degradation will start, that is, 100% is the maximum point to degradation. On Figure 6 showed a riblet structure surface with 50% of flat degradation, a completely de-graded riblet structure (100% of degradation) and an intact riblet structure.
In the current work, a totally flat surface is analyzed in strict calculations on the central detector, and the main parameters are given as:
Central Detector width = 28,672 µm;
Distance from sample to central detector = variable according to evaluations, from 3 cm to 50 cm;
Laser Wavelength = variable according to evaluations, from 400 nm to 750 nm; Sample width = 1005 µm;
Laser spot = 1000 µm.
To previous analysis, taking an intact sample, in this case, could have 10 rib-lets on the surface, considering distance between ribrib-lets bottom center (dR) as 96 µm.
However, considering a total degradation of the sample, with only 1 reflection on the surface (n = 1) directly to the central detector, the reflection width on the detector can be calculated as 1000 µm.
The final calculations performed in this work result in a spatial step in order of 7 µm, which means the calculations are performed for equidistant positions on detector. The detector used as base to calculations presents a resolution of 2048 pixels, with 28,672 nm width, corresponding to each pixel approximately 14 µm width. Thus, the calculations performed in this work, are defined to get a double precision of the real detector defined in previous works.
3. Results and Discussions
An initial result applying the calculations presented in this work shows a good agreement with the theoretical approach, at first, taking a completely degraded sample, considering the surface completely flat. To evaluate performed calcula-tions some expected characteristics of the laser light reflection, as symmetry and
Figure 6. Sketch of the intact riblet structure in comparison to
[image:8.595.242.503.607.703.2]periodicity of the wave were taken into account. In Figure 9 normalized calcula-tions using Equation (1) (Figure 7) and Equation (2) (Figure 8) are shown.
[image:9.595.212.535.175.415.2] [image:9.595.213.535.465.709.2]Comparing Figure 7 and Figure 8, the similarity of results performed by both different calculations can be identified. Evaluating the symmetry of both, the findings shown in Figure 9 present a great accuracy comparing the intensity
Figure 7. Intensity plot calculated-electric field equation.
Figure 9. Symmetry evaluation.
calculated in relation to detector center, in these evaluation is calculated the dif-ference between the both sides in relation to center of central detector, and if tends to zero, that means there’s no difference, then is reached a good symmetry.
Figure 9 shows the comparison between the symmetry calculations in relation to
calculated intensity, finding expected symmetry level, with variations due the precision used. Even with high calculated intensity, specially observed around detector center, calculated symmetry tends to zero, as expected.
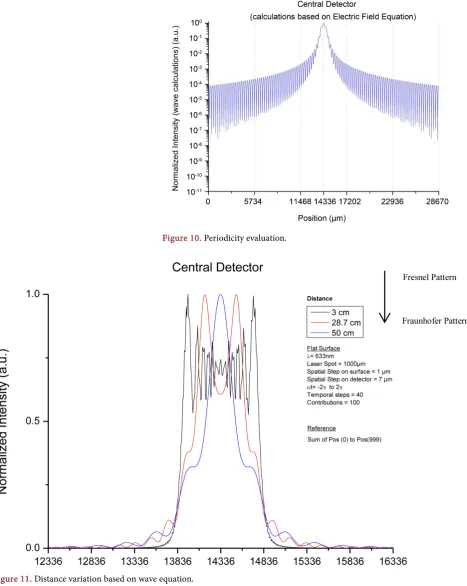
An analysis of the plots presented in Figure 7 and Figure 8, concerning the periodicity of the calculations, is presented on Figure 10, where expected calcu-lations are shown in a logarithmic scale.
The next result of the calculations considering a totally degraded flat riblet surface, performed based on Equation (1) (Figure 11) and Equation (2) (Figure 12) show a result which could be expected result according to literature. Fol-lowing Born [14], meaning varying the distance from the sample surface to the analyzing detector, the change from Fresnel pattern to Fraunhofer pattern can be identified and the proposed calculations are validated, observing the change of the shape if the distance increases, corroborating theoretical foundation.
Analyzing presented results, this work intends, in this first step, the validation of calculations and thus being the foundation for identifying more complex structured coatings, starting with the easiest case, currently shown and eva-luated.
Figure 10. Periodicity evaluation.
Figure 11. Distance variation based on wave equation.
Figure 12. Distance variation based on Fresnel integration.
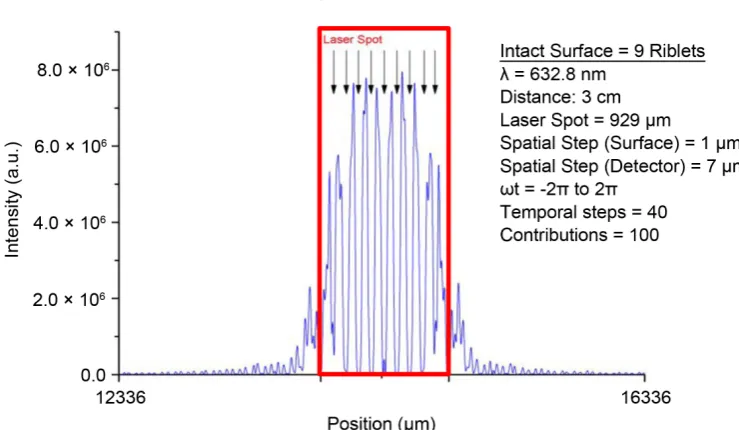
Figure 13. Detail-central detector-intact riblet sample-9 riblets-Fresnel pattern.
gaps between the peaks identified are considered hollows.
[image:12.595.162.532.377.592.2]Figure 14. Detail-central detector-intact riblet sample-19 riblets-Fresnel pattern.
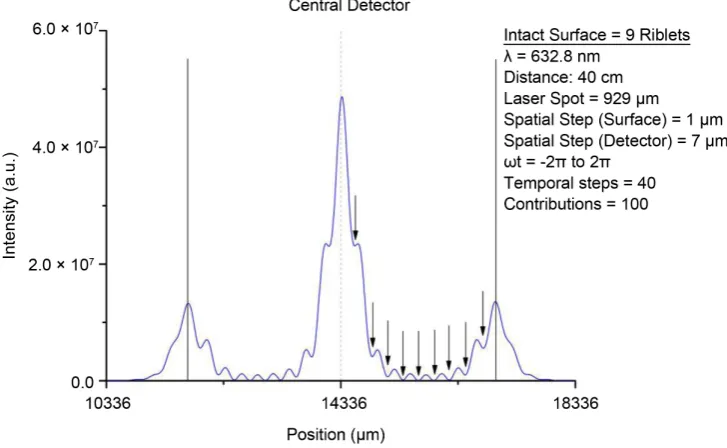
Figure 15. Detail-central detector-intact riblet sample-9 riblets-Fraunhofer pattern.
Inside of the light visible spectrum, between 400 nm and 750 nm wavelength is possible to observe, considering Fresnel pattern with the distance from the riblet surface until the central detector equals to 3 cm, no variation on the dis-tance between the peaks. Allowing analysis concerning the disdis-tance between rib-lets bottom centers based on the calculations, as showed on Figure 16.
[image:13.595.169.533.355.579.2]Figure 16. Detail-central detector-intact riblet sample-20 riblets-wavelength comparison.
that the number of hollows (minima) can be used to identify the number of rib-lets on the structure. There’s a difference observed between both plots specially in relation to positioning of the central maxima, due the possibility, using the computational tool, to precisely define the position of the laser spot, and expe-rimentally don’t be easy the adjustment of the laser and the sample.
A point to be observed is in relation to the resolution of the detectors, in this experimental evaluation, the detector resolution is 2048 pixels in a detector area width equals to 28,672 µm, in comparison to calculated intensity by the compu-tational tool, in order of a spatial step defined to 7 µm, is equivalent to double precision.
The measurements show that the wavelength and divergence depend on the distance from the first order to the main maximum of the order 0, and the structure of the surface is comparable to an optical grating. If the laser beam falls perpendicular to the surface, the reflected beams interfere with the base surface of the sample, applying the Bragg condition, d can be calculated as: dn = n. λ =
g·sin(νn). In this case, the lattice constant corresponds to the spacing of the
Figure 17. Measured distance comparison of different wavelength lasers calculated and theoretical values.
of error consistent with the application.
In agreement with the experimental measurements performed by the laser sensor device, Figure 18 shows the comparison regarding calculated intensity by the computational tool and the experimental measurements, where is possible to observe the supra cited parameters to be evaluated.
To perform this evaluation, the proposed model is:
Central Detector width = 28,672 µm Distance from sample to central detector = 40 cm
Laser Wavelength = 632.8 nm Sample width = 1000 µm
Laser spot = 1000 µm. Number of riblets = 20 riblets
Distance between riblets bottom centers = 50 µm
In assessment with real measurements performed via laser sensor device, de-veloped at Fraunhofer Institute-IFAM, applying normalization from 0 to 1, and adjusting the maxima intensity point, performed calculations shows in relation to previous described evaluations that calculated intensity via developed com-putational tool could reproduce the intensity experimentally acquired by the la-ser sensor device. Parameters of evaluation, as symmetry and number of calcu-lated maxima, in this case performed via software Origin, using the gadget quick peaks, shows equal number of maxima as showed on Figure 18.
Figure 18. Comparison between experimental measured intensity performed via laser sensor device and calculated intensity per-formed via computational tool with detailed graphic in evaluated region between the central maxima and 1st maxima.
for further deep surface evaluations.
Final evaluation consists in analysis of the calculated intensity performed on lateral detectors. Performing the same methodology applied to evaluate the cal-culations performed on central detector, symmetry and periodicity are presented on the calculated results. Figure 19(a) shows the entire calculated intensity range on right detector. The values calculated are spaced from 7 µm and the variation of ωt is defined with 40 temporal steps between −2π and +2π. It is possible to observe periodicity of the calculations, confirmed by Figure 19(b), that shows the same calculations in log scale.
Figure 19. Intensity plot calculation of lateral detector (right side), Absolut calculations (a) and periodicity evaluation of calcula-tions in log scale (b).
analizing the highest set of maxima, with the direct incidence of the reflected la-ser light, return the expected variation of the peaks.
4. Conclusions
Figure 20. Intensity plot calculation of lateral detector (right side), expected variation of the peaks.
reflection intensity acquired by a laser sensor device, in this particular evalua-tion, applied only on the central detector. The evaluation of proposed calcula-tions demonstrates the possibility to use this study as base for further complex intact and degraded structures. Same calculations applied on an intact riblet structure show potential way to identify the number of riblets on the surface and, if taking a small distance between the sample and detector, keeping the Fresnel pattern, also the distance between riblets can be identified. All data cal-culated via the developed computational tool can be further compared with real measurements.
The structure can be graphically reproduced as an intact riblet structure and vary to diverse levels of degradation. Specifically in this work, maximum degra-dation of the riblet structure was applied, considering flat degradegra-dation on 100% of degradation. This completely smooth surface was implemented and calculated by the proposed technique on the computational tool.
Presented results show that this work can be an alternative for the identifica-tion of the status of a structured surface. First evaluaidentifica-tions of the proposed calcu-lations, applied on the easiest cases of validation, considering a totally degraded riblet structure, as a flat surface, corroborate the applicability of the proposed technique and start a field study to improve the developed algorithm to be ap-plied in further structured coating analysis.
micro structured coatings, e.g. riblet structures, the intensities calculated via computational tool show the possibility to compare with experimental mea-surements performed by the laser sensor device developed in Fraunhofer Insti-tut-IFAM, and identify the main properties of the micro structured surface pre-viously defined. A relation between the calculated intensities specifically to later-al detectors are initilater-al kick off to evlater-aluation of the degradation on riblet struc-tures; evaluation of the distance among the maxima peaks spread on the detector could be a way to identification of further parameters related to type of degrada-tion and level of degradadegrada-tion on riblet micro structure surfaces. The assessment with this proposed methodology to identify riblet structured coatings ensures the application and comparison with the results acquired by the prototype of the laser sensor device developed and described as a potential tool to be used in quality assurance of structured surfaces, specially applied on aerospace industry.
Acknowledgements
Coordination for the Improvement of Higher Level Personnel (CAPES), for supporting the student Mauricio Zadra Pacheco, under the frame of the Brazili-an Program Science without Borders. State University of Ponta Grossa (UEPG), for funding the student Mauricio Zadra Pacheco. The authors acknowledge con-tributions by M. Noeske in discussions.
References
[1] García-Mayoral, R. and Jiménez, J. (2011) Drag Reduction by Riblets. Philosophical Transactions of the Royal Society A: Mathematical Physical and Engineering Sciences, 369, 1412-1427.
[2] Stenzel, V., Wilke, Y. and Hage, W. (2011) Drag-Reducing Paints for the Reduction of Fuel Consumption in Aviation and Shipping. Progress in Organic Coatings, 70, 224-229. https://doi.org/10.1098/rsta.2010.0359
[3] Commission of the European Communities (2008) Package of Implementation Measures for the EU’s Objectives on Climate Change and Renewable Energy for 2020. https://doi.org/10.1016/j.porgcoat.2010.09.026
[4] Fahr, A. and Wallace, W. (2014) Aeronautical Applications of Non-Destructive Testing. DEStech Publications Inc, Lancaster.
[5] ASTM Specification for Agencies Performing Nondestructive Testing.
[6] Takeda, S., Aoki, Y., Ishikawa, T., Takeda, N. and Kikukawa, H. (2007) Structural Health Monitoring of Composite Wing Structure during Durability Test. Compo-site Structures, 79, 133-139. https://doi.org/10.1016/j.compstruct.2005.11.057
[7] Liu, C., Fu, W., Lin, T., Chang, C. and Chen, J. (2011) Nanoscale Surface Roughness Characterization by Full Field Polarized Light-Scattering. Optics and Lasers in En-gineering, 49, 145-151. https://doi.org/10.1016/j.optlaseng.2010.08.004
[8] Imlau, M., Bruening, H., Voit, K., Tschentscher, J. and Dieckmann, V. Riblet Sen-sor—Light Scattering on Micro Structured Surface Coatings: Final Report. [9] Tschentscher, J., Hochheim, S., Brüning, H., Brune, K. and Imlau, M. (2015) Optical
Riblet Sensor: Beam Parameter Requirements for the Probing Laser Source. [10] Webster “Degradation” Word Central: Merriam-Webster’s Student’s Electronic
[11] Yang, X., Vang, C., Tallman, D., Bierwagen, G., Croll, S. and Rohlik, S. (2001) Weathering Degradation of a Polyurethane Coating. Polymer Degradation and Sta-bility, 74, 341-351. https://doi.org/10.1016/S0141-3910(01)00166-5
[12] Yang, X.F., Li, J., Croll, S.G., Tallman, D.E. and Bierwagen, G.P. (2003) Degradation of Low Gloss Polyurethane Aircraft Coatings under UV and Prohesion Alternating Exposures. Polymer Degradation and Stability, 80, 51-58.
https://doi.org/10.1016/S0141-3910(02)00382-8
[13] Fowles, G. (1975) Introduction to Modern Optics. 2nd Edition, Holt, Rinehart and Winston, New York.
[14] Born, M. and Wolf, E. (2006) Principles of Optics: Electromagnetic Theory of Propagation, Interference and Diffraction of Light. 7th Expanded Edition, Cam-bridge University Press, CamCam-bridge.
[15] Reis, D.M., Santos, E.M. and Andrade-Neto, A.V. (2015) Diffraction Patterns from n Non-Symmetric Slits and Arbitrary Widths. Revista Brasileira de Ensino de Física, 37, 2312-1-2312-9.
Submit or recommend next manuscript to SCIRP and we will provide best service for you:
Accepting pre-submission inquiries through Email, Facebook, LinkedIn, Twitter, etc. A wide selection of journals (inclusive of 9 subjects, more than 200 journals)
Providing 24-hour high-quality service User-friendly online submission system Fair and swift peer-review system
Efficient typesetting and proofreading procedure
Display of the result of downloads and visits, as well as the number of cited articles Maximum dissemination of your research work
Submit your manuscript at: http://papersubmission.scirp.org/