Open Journal of Geology, 2017, 7, 690-719 http://www.scirp.org/journal/ojg
ISSN Online: 2161-7589 ISSN Print: 2161-7570
Petrological and Geochemical Evaluation of the
Paleocene-Eocene Lithofacies in Dahomey
Embayment, Southwestern Nigeria
Olugbenga A. Boboye, Olusegun J. Omotosho
Department of Geology, University of Ibadan, Ibadan, Nigeria
Abstract
The detail mapping and logging of the Ibese area within the Dahomey Basin has revealed the total thickness of the limestone to range between 12.0 m to 15.0 m. This study is based on qualitative lithologic, spectrochemical analyses via X-ray fluorescence and petrographic indices to understand the lithofacie, chemistry, viability of the sequences and depositional environment. This con-sists of milky to grey and nodular to massive fossiliferous limestone units while the sand content increases with depth. The composition of the major oxides in the thirty-seven (37) samples from six exploratory wells revealed that CaO (51% - 56%), SiO2 (2.6% - 10.56%), Fe2O3 (0.33% - 0.94%), MgO
(0.78% - 1.02% and Al2O3 (0.72% - 0.98%) were the most abundant elements.
The trend of the geochemical indices show increase in the percentage compo-sition of CaO, and MgO down the sequences with high values which defined the depth of diagenetic re-distribution. The percentage composition of Al2O3,
Fe2O3 and K2O are significant indicating continental influence during
diage-nesis and diverse depositional episodes. The three different microfacies recog-nized based on depositional texture are shelly biomicrite, shelly biosparmicrite and alga biosparmicrite. The predominance of micrite as the cementing ma-trix revealed that the rock was deposited in a quiet shallow inner shelf envi-ronment occasioned by storm waves.
Keywords
Environment, Petrography, Geochemistry, Diagenesis, X-Ray Fluorescence
1. Introduction
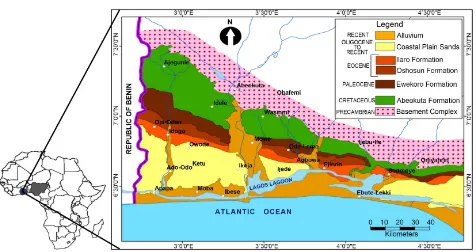
The Dahomey Basin is an arcuate extensive basin located within the Gulf of Guinea, West Africa (Figure 1). It extends from the eastern part of Takoradi
How to cite this paper: Boboye, O.A. and Omotosho, O.J. (2017) Petrological and Geochemical Evaluation of the Paleocene- Eocene Lithofacies in Dahomey Embay-ment, Southwestern Nigeria. Open Journal of Geology, 7, 690-719.
https://doi.org/10.4236/ojg.2017.75047
Received: November 30, 2016 Accepted: May 23, 2017 Published: May 26, 2017
Copyright © 2017 by authors and Scientific Research Publishing Inc. This work is licensed under the Creative Commons Attribution International License (CC BY 4.0).
http://creativecommons.org/licenses/by/4.0/ Open Access
Figure 1. Map of Africa showing the location of Nigeria and the generalized geological map of the eastern. Dahomey Basin (mod-ified after Gebhardt et al. [27]).
Height in Ghana through Togo, Republic of Benin and then terminates at the Okitipupa ridge, south western Nigeria separating it from the Niger Delta. It runs parallel to the coastal states of these countries covering a total area of ap-proximately 49,209 km2 [1]. The states within the basin in the Nigerian sector
include Lagos, Ogun, Ondo and Benin and the sediments’ thicknesses increase toward the sea (Figure 1). The northern part of the basin in Nigeria is the expo-sure of the Abeokuta group which unconformably overlying the basement while towards the sea, there is a progressive increase in the thickness of chemical and biochemical sediments such as gypsum, glauconite, limestone and other asso-ciated marine deposits which is then capped by coastal sands [2][3]. Numerous works have been carried out on the Ewekoro and Akinbo formations which are exposed at different sections of eastern part of the Dahomey Basin [3][4][5].
Omatsola and Adegoke described the structure and stratigraphy of the Abeo-kuta formation [6]. Ogbe proposed that the overlying finely laminated shale at
the Ewekoro quarry is Akinbo Formation [7]. Ekweozor and other workers
stu-died the origin of tar sands, organic geochemical investigation of bitumen, pro- perties and source rock evaluation of interbedded shale of southwestern Nigeria
[8][9]. They concluded that the tar sand deposits represent the product of re-servoir transformation of hydrocarbon by anaerobic micro-organisms. The study of the subsurface in Dahomey Basin of upper Cretaceous and lower Ter-tiary of Bodashe-1 and Ile paw wells was carried out and concluded that the
se-diments belong to the Araromi Formation [10], while the use of pebble
O. A. Boboye, O. J. Omotosho
quiet shallow marine environments and that the presence of Toweiuscallosus
and Coccolithusformosus indicated that Oshosun and Ewekoro Formations were
Ypresian and Thanetian to Ypresian age [3]. This rock is a potential hydrocar-bon reservoir for the overlying shale while this character of the rock is seen in the Benin Republic sector of the basin, where petroleum is produced at marginal level [3][13][14]. The aspect geochemical evaluation, depositional environment and reserve estimation of limestone deposit were also reported around
Orimogi-ja and Okeluse areas of eastern Dahomey Embayment [15][16]. However, this
study focus on the distribution of diverse lithofacies, genetic description of the Ewekoro Formation with emphasis on the limestone and what characterize the environment of its deposition, the extent of diagenesis, biological influence on the chemistry of the units, major elemental composition, post depositional processes and their viability in determining its economic values.
2. Stratigraphy of the Dahomey Basin
The Dahomey Basin is described by an extensive wedge of Cretaceous to Recent sediments which lies unconformably on the basement [1]. Theses rocks are up-per Cretaceous Post Santonian which also outcrops in the River Niger, Bida Ba-sin and the eastern sector part of the Anambra BaBa-sin down to the Okitipupa high. In the Dahomey Basin the three stage tectonic evolution allows the strati-graphic sequence to be divided into three sequences namely Precambrian to Tri-assic intracratonic rocks and JurTri-assic to lower Cretaceous, Continental to mar-ginal marine rocks representing the pre-transform stage, the lower Cretaceous to late Albian rocks representing the syn-transform stage and Cenomanian to Ho-locene rocks representing the post-transform stage [9].
The lower Ise Formation which overlies the basement contains conglomerates, coarse to medium grain sandstones and shales that were deposited in continental and deltaic environments. The conglomerates are imbricated and at some loca-tions, ironstones occur [10]. The conglomerates are poorly sorted, micaceous and more or less clayey [1]. This formation which is part of the Abeokuta group can be classified under the groups of rocks formed in the pre-transform stage between Upper Jurassic to Neocomian, [9][11][12]. This age is more represent-ative on the offshore part of the basin which may reach about 2000 m thick though this has not been reached by drilling but geological interpretation have been inferred from various seismic data [13]. This formation also is represented in the Neocomian. Cross bedding is noticeable while the rock is soft and friable
[1].
Overlying the Ise Formation of the Abeokuta group is the Afowo Formation which is made up coarse to medium grained sands and interbedded shales, silt-stones and claystone with the sandy facies bearing tar while the shales are or-ganic rich [12][18] (Figure 2).
The lower part of this formation which overlie the Ise Formation is transition-al with mixed brackish to margintransition-al horizons that transition-alternate with well sorted, sub-rounded sands indicating a littoral or estuarine near shore environment of
Figure 2. Stratigraphy of Nigerian eastern sector of Dahomey Basin (modified after Omatsola and Adegoke, [4]).
deposition [2]. Brownfield and other workers described fairly sorted sandstone interbedded with shale beds overlying a shale and siltstone sequence deposited as a reworked fan delta in a marginal marine to inner shelf environment [19]. This unit corresponds to the beginning of the post transform stage in the basin and is dated as Turonian. The upper part of this formation grades into Maas-trichtian in different parts of the basin [19].
3. Location of the Study Area and Geology
The study area is located in Ibese, southwestern Nigeria about 40km southwest of Abeokuta where quarrying activities have revealed rocks of diverse ages and lithologies within the basin (Figure 1). The geology as exposed at different road cuts and quarry exposures show the occurrence of lateritic sandy horizon which is the topmost layer. The underlying lithology in this sequence is sandy shale with lateritic concretions which is succeeded by the occurrence of shale. At other sections where weathering is minimal, this layer show glauconitic nodules fol-lowed by the occurrence of partially weathered poor fossiliferous limestone units succeeded by a fossiliferous horizon which extends to a significant depth before terminating on marl. Intercalating the marl units are sandy shale and poorly sorted sandstones.
4. Materials and Methods
4.1. Field Study
O. A. Boboye, O. J. Omotosho
sandstone. A systematic mapping and sampling was adopted at five meters’ in-tervals. The lithostratigraphic descriptive geology of the study area is well de-scribed in the quarry site where exposures of the rocks can be studied (Figures 3-9). The rocks are structurally undeformed and strike east west running parallel to the coastline. The rocks association were defined from core samples with the uppermost unit extending up to about 0.7 m.
4.2. Laboratory Analyses
The samples were disaggregated and subjected to lithological description and petrography in the laboratory while the samples for the XRF analysis were pul-verized into a fine powder. Between 10 mg - 15 mg of the samples were subjected to X-ray fluorescence Spectrometric analysis which was done using the Rigaku XRF Spectrometer with a rhodium (Rh) target. This runs at 50 KV/50 mA with full vacuum and a 25 mm mask for the analysis of various major oxides with the detectable limits for the major elements which were 0.01% for SiO2, Al2O3, CaO
and 0.04% for Fe2O3 both at 100% upper limit. The petrographic slides were
prepared at the thin section laboratory, where thin sections approximately 30 µm thick of the samples were produced for microscopic study.
5. Results and Discussion
5.1. Lithostratigraphy
[image:5.595.63.535.440.715.2]The lithofacies that constitute the study area are sandstone, clay, shale, limestone and marl. The sandstones are fine grain with the ferruginized sandy clay units
Figure 3. A lithostratigraphic section as exposed in Ibese.
O. A. Boboye, O. J. Omotosho
Figure 5. Lithostratigraphy profile of well-2.
O. A. Boboye, O. J. Omotosho
Figure 7. Lithostratigraphy profile of well-4.
O. A. Boboye, O. J. Omotosho
Figure 9. Lithostratigraphy profile of well-6.
significantly difference from the upper units. The clay and shale units are lateri-tized occurring as concretions ranging from brown to reddish brown and grey in colour respectively. The shale units are rich in glauconite and the limestone units constitute the weathered, poorly fossiliferous partly to the telltale of wea-thering on the layer and unweathered units which grades from the upper layer in a diffuse manner. The diagenetic process has had its toll on this layer due to pore spaces (mouldic and vuggy porosities) which shows casts of the disintegrated fossils (Figures 3-9). The marl units are described as the impure limestone. The deeper section of this unit shows contact between the basal weathered marl and a fresh top layer with the former occurring in the form of lateritic clay concre-tions.
5.2. Geochemistry
The major elements from the six wells within the Ewekoro Formation put the average percentages of major oxides across the wells as CaO (51% - 56%), SiO2
(2.6% - 10.56%), Fe2O3 (0.33% - 0.94%), MgO (0.78% - 1.02% and Al2O3 (0.72% -
0.98%) (Appendix: Tables 1-6). The percentage concentration of CaO increases down the formation to approximately 13.0 m depth, where the highest value was recorded which tapper down the formation to the limestone-marl contact. The average percentage composition of CaO is 52.6% which indicate the dominancy of this oxide. This corroborate with the petrographic studies with the occurrence of carbonate bioclasts within the lime mud matrix [3][19][20]. The high ratio observed in calcium and magnesium defines a high calcite purity which is signi-ficance in the cement production. The presence of magnesium in carbonate rocks is a function of the temperature of deposition and time due to its removal by interstitial solution while dolomitization process could also contribute to high magnesium content [21].
The increase in the amount of CaO at different depths clearly defines diverse carbonate lithologic units. At 13 m depth, there is a significant increase in the amount of MgO, this significant enrichment is attributed to increase in the amount of coralline algae and/or had an initial dolomitization where the water in the basin may be partially isolated under conditions of aridity and hence enriched in magnesium by continual inflow of sea water and subsequent preci-pitation of carbonate. Enrichment in this manner would form a heavy brine so-lution that moved down through porous sediments below and dolomitize those carbonates with which it came in contact with [21][22] [23]. This depth of re-placement serves as the datum of skeletal accumulations at water thermody-namic condition. At depth ranging from 12 m to about 14 m, there is an increase in fossil content with large primary porosity which creates the avenue for re-placement. At other deeper depths there is an inversion of aragonite to calcium and also consequent shedding of carbonate sediments from above [3].
The geochemistry of well-1 defined the depth of carbonate diagenetic
redi-stribution complemented by the amount of SiO2 measured from various
O. A. Boboye, O. J. Omotosho
Figure 10. A lithofacies correlation of study wells showing diverse horizons.
MgO peaked showing the depth of favoured carbonate deposition and/or arago-nite-calcite inversion which also correspond with the increase in the value of SiO2. This helps in inferring the environment of deposition and the diagenetic
redistribution [21] [24]. Fairly high SiO2 percentage range between 2.4% to
10.38% (average of 4.363%), suggest that the continental areas have an effect on the limestone though diagenesis and leaching tend to minmize such effects. Feldspars containing silica had been broken down during transportation before the commencement of diagenetic alterations. The presence of alumina (Al2O3),
confirms the occurrence of alumino silicates (feldspars) and micas in the adja-cent areas that have being subjected to partial weathered prior diagenesis [3][18] [22]. The average percentage composition of Al2O3 in the shale units (12.63%) and
Figure 11. A Ternary plot showing degree of diagenesis in the study wells.
limestone (0.693%) has constituted a slight alumina contaminant to the upper limestone units viametoric water percolation.
The modal composition of Fe2O3 in the Ewekoro Formation is low compared
to other oxides in the well. The low Fe3+ confirms the suboxic character of the
O. A. Boboye, O. J. Omotosho
in the upper limestone horizon with an average of 0.40 is an indication of conti-nental influence [22]. The moderate amount of both seems to reflect in the fer-ruginous syn-sedimentary and post depositional inputs of these sediments by surface meteoric waters flushing rapidly through ferromagnesian rich minerals (shale and glauconite) overlying the limestone. The rocks are stained at some parts with reddish brown colouration when exposed and it is seen that some of the allochems exhibit some iron oxide stained under the microscope [3]. How-ever, the results have shown that the limestone sequence bounded by thick shales, correspond to higher value of Fe/Mg ratio, due to the occurrence of sha-ley glauconitic bands and leaching of smectite clays into the unit. The result of the major oxides in well-2 has shown that the depth at which Mg occur in this well tend to become shallower to that measured in Well-1 suggesting the possi-ble increase in water level thus causing the deposition of the carbonate at a shal-lower depth. The depth of SiO2 still remainat 13.5 m indicating a common
di-agenetic depth for both horizons. Silica percentage (SiO2) is low and range
be-tween 2.4% to 10.38% (average of 4.46%). This is an indication that the conti-nental areas have a mild effect on the limestone through diagenesis [21]. The presence of alumina with average value of 14.43% (shale) and 0.66% (limestone) confirms the presence of little alumino silicates in the adjacent areas that had not been completely weathered prior diagenesis and also that which dripped on the upper limestone horizons with high alumina value of 2.44% in the limestone
[21]. The modal composition of Fe2O3 is low relative to others hence suggesting
low availability of oxygen to oxidize Fe2+ present in heavy minerals to Fe3+
dur-ing diagenesis with little effect of post depositional processes on the overlydur-ing glauconite (Appendix: Table 2, Figure 11 and Figure 12).
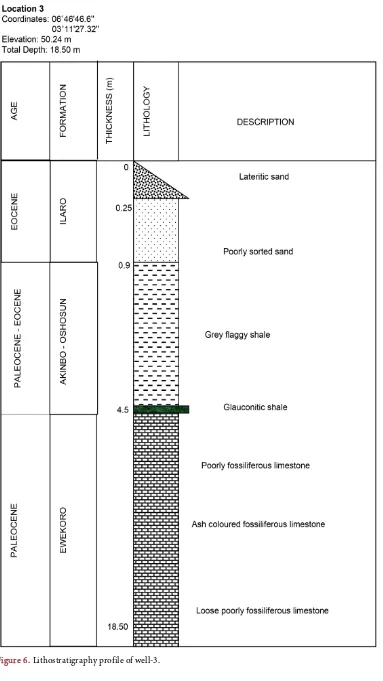
The amount of MgO relative to depth in well-3 defined the depth of carbonate
primary replacement complemented by the amount of SiO2 measured from
var-ious horizons which showed different peaks (Figure 11). Though there exists fluctuations at diverse horizons but the depth of high MgO and SiO2
concentra-tion is put at 12.0 m to 14.0 m. MgO peaked showing the depth of favoured car-bonate deposition of aragonite - calcite inversion which also correspond with an
increase in the amount of SiO2. Two peaks were recorded for this horizon
(Figure 11). An average of 64.91% and 4.89% were measured for the shale and
limestone respectively. Relative to previous wells, a high percentage of SiO2 was
recorded at 13.0 m depth which indicate the presence of authigenic quartz and minor detrital quartz [21] (Appendix: Table 3). An average of 11.97% and 0.96% of alumina were recorded for the shale and limestone. A local enrichment of 4.2% was measured at the upper limestone horizons while a gradual decrease in Al2O3 with depth was recorded. This indicated the rate of Al2O3 percolating into
the limestone from the shale unit. The K2O value (0.06%) measured from the top
of the limestone unit confirm with the shaly contamination. Average values of Fe2O3 (7.864% and 0.675%) were recorded for the shale and limestone while a
peak of 8.36% at the shale-limestone contact suggest the partial oxidation of glauconite from Fe2+ to Fe3+.
O. A. Boboye, O. J. Omotosho
The ratio of MgO with depth in well-4 defined the depth of carbonate
diage-netic re-distribution which is complemented by the amount of SiO2 measured
from various horizons with different peak (Figure 10). At 12 m to 14 m depth MgO peaked showing the depth of favoured carbonate deposition or arago-nite-calcite inversion which also correspond with an increase in the amount of SiO2. SiO2 percentage is fairly high and ranged from 1.45% to 10.56% (average of
3.87%). The rock can be described as chemically pure indicating that the conti-nental areas have little effect on the limestone [24] (Appendix: Table 4). Feldspar containing silica had been weathered during transportation prior the commencement of diagenesis. The values of Al2O3 in the shale (11.8%) and
li-mestone (0.81%) lithofacies confirms the presence of little alumino silicates in the adjacent areas that are partially weathered priorthe diagenetic processes in the overlying shale facie. Significant shale contamination is well defined by the increase in percentage of K2O (0.11%) measured at the shale-limestone contact [21]. The percentage composition of Fe2O3 measured in the shale (7.3%)
in-creased compared to other oxides thus helps to infer the amount of oxygen available to oxidize Fe2+ present in heavy minerals to Fe3+. The increase in the
amount of Fe2O3 in this horizon describes the intense chemical weathering of the
continental areas (Appendix: Table 4).
In well-5 at 13.0 m depth, there is a sharp increase in both MgO and SiO2
(Figure 12). This graphical behaviour is suggestive of an increase in the
thick-ness of the deposit towards the continent, which showed a decrease in the extent of continental inputs as the deposits progrades onshore. Silica (SiO2) percentage
ranged from 1.4% to 10.2% (average of 5.1%) (Appendix: Table 5). This is an
indication of the Continental areas having little effect on the limestone [22]. Alumina, (Al2O3), increases in this horizon confirms the presence of
alumi-no-sili- cates in the adjacent formations. The effect of shale contaminante in the limestone units is minimal. This corroborates with the average percentage of K2O (0.1%). The amounts of Fe decreases down the formation making it obvious
that it is post depositional. This is due to the percolation of meteoric waters through shale and glauconitic layers into the underlying limestone units.
5.3. Carbonate Petrography
Three microfacies recognized are shelly biomicrite (bioclastic wackestone), shel-ly biosparmicrite (bioclastic wackestone-packstone) and alga biosparmicrite (Alga bioclastic wackestone-packestone) [21][22][25] (Appendix: Table 7 and
Figures 13-15).
5.3.1. Shelly Biomicrite
This represents the topmost portion of the limestone layers. The rock is micrite (mud) supported and contain a substantial amount of bioclasts (grain). At dif-ferent sections, the rock defines about 1/4 of spar. Bioclasts described from this layer include pelecypods which take a higher percentage of bioclasts population, gastropods, echinoids, cup corals exhibiting radial structure and coralline algae.
(a)
[image:18.595.128.543.69.446.2](b)
Figure 13. (a): Photomicrographs of a shelly biomicrite (Sample A1). Allochems present include mollusk which are gastropod (G) pelecypod (Pe), spar ite (S). Note the internal micritization of the fossils especially the mollusk, brachiopod and pelecypod. (Mag. X40). (b): Photomicrographs of shelly biomicrite. The allochems present include echinoid (E) pelecypods (P), foraminifera (F), broken shell fragment (X), prismatic pelecypod, spar fill brachiopod (Bs), gastropods (G) and micrite (M), sparite (S). Note the internal micritization of the fos-sils and spar fill echinoid.(Mag. X40).
Internal micritization of some grains were observed especially the mollusks, ga-stropods, echinoids and brachiopods. Micritic corrosion of the surface of coral-line algae and pelecypods gave rise to more degenerated structures. Internal re-crystallization of bioclasts is well defined. Non bioclastic components are intrac-lasts, quartz grains and occasional pellets.
5.3.2. Shelly Biosparmicrite
O. A. Boboye, O. J. Omotosho
(a)
[image:19.595.128.542.71.444.2](b)
Figure 14. (a): Photomicrographs of sorted shelly biosparmicrite (Sample B2). Allochems present include co-ralline algae (CA), intraclasts (I), ooids (O), brachiopods (B), pelecypods (Pe), foraminifera (F), algae (A). Note the spar cement around coralline algae and brachiopods and internal micritization of the bioclasts. (Mag. X40).
(b): A photomicrographs of shelly biosparmicrite. The allochems present include micritizedalgae (Am), algae (A), intraclasts (I), sparite (S). Note the predominance of internal micritization of thebioclasts and also the binding action of sparite within the lime mud. (Mag. X40).
spars crystal increase outward from shell boundaries, however, the compaction increases grain to grain contact.
5.3.3. Alga Biosparmicrite
This microfacies is the lowermost section of the limestone sequence in Ibese. It is synonymous to the alga bioclastic wackestone-packstone [25]. This facies is cha-racterized by abundant stromatolitic algae which defines sediment binding. Other bioclasts include coiled gastropods, micritized echinoids, foraminifera, mollusks and spherulitic corals. Non bioclastic components include pellets and intraclasts which make about 1/3 of various portions of this microfacies. The radial pattern show internal rim cement (microspore calcite cement) within mi-critic ground mass. Other depositional texture that can be inferred from this layer is oncolitic grainstone defined by corals and algae complemented by increase
(a)
[image:20.595.128.541.67.414.2](b)
Figure 15. (a): Photomicrographs of alga biosparmicrite (Sample C2). The allochems present include brachi-opod (B), pelecypods (Pe), intraclasts (I), gastrbrachi-opods (G), pellets (P) coralline algae (C). alga mat (Am). Note the internal micritization and sparitization and its binding action on the bioclasts and iron mineral infill. (Mag. X40). (b): Photomicrographs of alga biosparmicrite. The allochems present include Brachiopod (B), Sponges (Sp), intraclasts (I) sparitized nacreous pelecypod (nPs). Notice the internal micritization of the fossils and Iron mineral (Ir) infill also note the growth sparry calcite within the alga mat and also the rarity of micrite within the mat. (Mag. X40).
in the amount of skeletal debris. Grain dissolution and interparticle porosity are significant as they reflect the degree of diagenetic process, hence affecting their physical properties.
5.4. Depositional Palaeoenvironment
Based on the sedimentological indices, the shale units of Akinbo Formation are fine with no sand, silt or carbonates, grey, flaggy and slabby indicating low energy quiet water setting. The palaeobathymetry of the fossil assemblage de-fined from the earlier studies indicated benthic dwellers except for some shell fragments whose origin could not be ascertain [3][20][22][26].
se-O. A. Boboye, se-O. J. Omotosho
quel to this, there has been decrease in the total porosity of the rocks where the topmost biomicrite defines mouldic, fenestrael, intraparticle and little interpar-ticle porosities. The shelly biosparmicrite and alga biosparmicrite microfacies are characterized by increase in grains’ components which increase the grain to grain contacts of the rock units thus enhances interparticle porosity [27].
The magnesium content of the carbonate rock is low when compared to cal-cium, while the average percentage composition across the wells ranges between 0.78% - 1.02%. This low composition is attributed to an increase in organism complexities (advanced phyla) based on this premise, a shallow marine envi-ronment of deposition is suggested. The presence of SiO2, K2O and Al2O3 is an
indication of clastic input and degree of diagenesis on the lithofacies [21][22] [28]. The downhole increment of SiO2 in the formation indicates an increase in
the continental influence. In well-1, the relative increase in the amount of SiO2
defines the degree of continental influence which suggest that the paleobathy-metry during the formation of the carbonate to be within the range of 12.0 m to 14.0 m depth suggesting a shallow water environment (Figure 10 and Figure
11). The average Fe/Mg in well-3 measured in the limestone (1.24) indicated
gradual increase suggesting a continental influence. The moderate amount of both reflect the ferruginous syn-sedimentary and post-depositional inputs of these sediments by suface meteoric waters flushing rapidly through ferromagne-sian rich minerals overlying the limestone.
6. Conclusion
Detailed mapping and logging of the study area showed the total thickness of the limestone ranged from 12.0 m to 15.0 m. The limestone consists of milky to grey and nodular to massive fossiliferous units. It is evident that the sand units in-crease with depth. The major element percentages revealed an inin-crease in CaO with depth and an average of 56% and also a corresponding increase in MgO with average of 0.86% which show the calcitic nature of the deposit. The six wells
showed significant peaks in MgO and SiO2 at depth approximately 13.0 m. The
increase in the Mg component suggests diagenetic processes and the significant occurrence of Al2O3 and Fe2O3 in the sequence is an indication of continental
in-fluence in the diagenetic history of the sedimentation. Three different microfa-cies were recognized based on depositional texture, they are shelly biomicrite, shelly biosparmicrite and alga biosparmicrite. The predominance of micrite as the cementing matrix revealed that the rock was deposited in a quiet shallow in-ner shelf environment occasioned by storm waves. The elemental composition of the rock units suggested the suitability of deposit for cement production howev-er; further studies could look into the lime saturation factor (LSF), silica mod-ulus (SR) and alumina modmod-ulus (AR) in making up for corrections to meet pro-duction specifications.
References
[1] Whiteman, A.J. (1982) Nigeria, Its Petroleum Geology, Resources and Potential.
Graham and Trotman Publishing, London, 1 and 2, 251-269, 104-110.
https://doi.org/10.1007/978-94-009-7361-9
[2] Nton, M.E., Tijani, M.N. and Ikhane, P.R. (2009) Aspect of Rock-Eval Studies of the Maastrichtian-Eocene Sediments from Subsurface, in the Eastern Dahomey Basin Southwestern Nigeria. European Journal of Scientific Research, 25., 417-423. [3] Boboye, O.A. and Raji, K.A. (2013) Aspect of Biostratigraphic and Petrographic
Studies of the Late Palaeocene to Eocene Sequence of the Eastern Dahomey Em-bayment, Southwestern Nigeria. Journal of Science Research, 12, 231-262.
[4] Akinmosin, A. and Osinowo, O.O, (2010) Petrographical Study of Ewekoro Carbo-nate Rocks, in Ibese, South Western Nigeria. Earth Sciences Research Journal, 14, 187-196.
[5] Adekeye, O.A. and Akande, S.O. (2006) Depositional Environment and Reservoir Potential Assessment of the Paleocene Ewekoro Formation, eastern Dahomey Basin South-Western Nigeria in Nigeria. Journal of Mining and Geology, 42, 133-140. [6] Omatsola, M.E. and Adegoke, O.S. (1981) Tectonic Evolution and Cretaceous
Stra-tigraphy of the Dahomey Basin. Journal of Mining Geology, 18, 130-137.
[7] Ogbe, F.A. (1972) Stratigraphy of Strata Exposed in the Ewekoro Quarry Southwes-tern Nigeria. African Geology, 305-322.
[8] Adekeye, O.A. and Akande, S.O. (2010) The Principal Source Rocks for Petroleum Generation in the Dahomey Basin, Southwestern Nigeria. Continental Journal of Earth Sciences, 5, 42-55.
[9] Boboye, O.A. and Nwosu, O.R. (2013) Petrography and Geochemical Indices of the Lagos Lagoon Coastal Sediments, Dahomey Basin (Southwestern Nigeria) Sea Level Change Implications. Quaternary International Journal, 338, 14-27.
https://doi.org/10.1016/j.quaint.2013.07.006
[10] Ekweozor, C.M. (1990) Geochemistry of Oil Sands of Southern Nigeria. Mining and Geosciences Society Publications on tar Sands Workshop. Ago Iwoye, 50-62. [11] Nwanchukwu, J.I., Adegoke, O.S. and Salami, M.B. (1992) Micropaleontology of the
Upper Cretaceous and lower Tertiary of Bodashe-1 and Ile Paw Wells Southwestern Nigeria. Journal of Mining and Geology, 29, 163-170.
[12] Ikhane, P.R., Akintola, A.I., Akintola, G.O., Okunlola, O.A. and Oyebolu, O.O. (2013) Granulometric Analysis and Heavy Mineral Studies of the Sandstone Facies Exposed near Igbile, South Western Nigeria. International Research Journal of Ge-ology and Mining (IRJGM), 3, 158-178.
[13] Adeonipekun, P.A., Ehinola, O.A., Yussuph, I.A., Toluhi, A. and Oyelami, A. (2012) Bio-Sequence Stratigraphy of Shagamu Quarry Outcrop, Benin Basin, Southwestern Nigeria. World Applied Sciences Journal, 18, 91-106.
[14] Fakolade, O.R. and Obasi, R.A. (2012) The Geotechemical Assessment of Subsur-face Coastal Plain Clastic Deposits of Eastern Dahomey Basin around Lagos Area, South West Nigeria. International Journal of Science and Technology, 1, 300-307 [15] Abayomi, E. and Dare, O.O. (2016) Geochemical Evaluation of Arimogija-Okeluse
Limestones, Eastern Dahomey Basin, Southwestern Nigeria. Journal of Sedimentary Petrology, 36, 317-340. https://doi.org/10.18052/www.scipress.com/ilns.56.57
[16] Ehinola, O.A., Oluwajana, A. and Nwabueze, C.O. (2012) Depositional Environ-ment, Geophysical Mapping and Reserve Estimation of Limestone Deposit in Ari-mogija-Okeluse Area, Southwestern Nigeria. Research Journal in Engineering and Applied Sciences, 1, 7-11.
O. A. Boboye, O. J. Omotosho
Dahomey Basin, Southwestern Nigeria. Gjahrbuch Der Geologischem Bundesantalt, 150, 407-419.
[18] Olabode, S.O. (2007) Lithofacies Characterization and Channel Development in the Outcrops of Cretaceous Sedimentary Rocks, Eastern Dahomey Basin, South West-ern Nigeria. Journal of Mining and Geology, 43, 131-145.
[19] Brownfield, M.E. and Charpentier, R.R. (2006) Geology and Total petroleum sys-tems of the Gulf of Guinea Province, West Africa. U.S. Geological Survey Bulletin, 2207-C, 32 p.
[20] Elvsborg, A. and Dalode, J. (1985) Benin Hydrocarbon Potential Looks Promising.
Oil Gas Journal, 83, 126-131.
[21] Fayose, E.A. and Azeez, L.O. (1972) Micropaleontological Investigation of Ewekoro Formation, Southwestern Nigeria. Micropaleontology, 18, 69-332.
https://doi.org/10.2307/1485014
[22] Flugel, E. (1982) Microfacies Analysis of Limestones. Springer-Verley, Berlin, Hei-delberg, New York, 633 p. https://doi.org/10.1007/978-3-642-68423-4
[23] Pettijohn, F.J. (1975) Sedimentary Rocks. 3rd Edition, Harper and Row, New York, 628 p.
[24] Roser, B.P. and Korsch, R.J. (1986) Determination of Tectonic Setting of Sand-stone-Mudstone Suites Using SiO2 Content and K2O/Na2O Ratio. Journal of
Geolo-gy, 94, 635-650. https://doi.org/10.1086/629071
[25] Roser, B.P. and Korsch, R.J. (1988) Provenance Signatures of Sandstone-Mudstone Suite Determined Using Discriminant Function Analysis of Major Element Data.
Chemical Geology, 67, 119-139. https://doi.org/10.1016/0009-2541(88)90010-1
[26] Dunham, R.J. (1962) Classification of Carbonate Rocks According to Depositional Texture. In: Ham, W.E., Ed., Classification of Carbonate Rock, American Associa-tion of Petroleum Geologists Memoir, 108-201.
[27] Folk, R.L. (1974) Petrography of Sedimentary Rocks. Hemphill Publishing Compa-ny, Austin, Texas, 182 p.
[28] Armstrong-Altrin, J.S., Lee, Y.I., Verma, S.P. and Ramasamy, S. (2004) Geochemi-stry of 373 Sandstones from the Upper Miocene Kudankulam Formation, Southern India: Implications for 374 Provenance, Weathering, and Tectonic Setting. Journal of Sedimentary Research, 74, 285-297. https://doi.org/10.1306/082803740285
Appendix
Table 1. Major elemental geochemistry of the Akinbo and Ewekoro Formations in Well 1.
Depth
(m) CaO (%) SiO(%) 2 Al(%) 2O3 Fe(%) 2O3 MgO (%) K(%) 2O SiO(%) Mg/Ca Fe/Ca 2 Si/Ca Fe/Mg Si/Al Ca/Mg Mg/Ca Fe/Ca Si/Ca 1.00 0.22 77.49 9.50 4.20 0.19 0.77 77.49 0.863636 19.09091 352.2273 22.10526 8.156842 1.157895 0.863636 19.09091 352.2273 1.50 0.17 65.27 14.71 6.20 0.36 0.70 65.27 2.117647 36.47059 383.9412 17.22222 4.437118 0.472222 2.117647 36.47059 383.9412 2.00 0.18 65.94 13.58 6.75 0.39 0.82 65.94 2.166667 37.50000 366.3333 17.30769 4.855670 0.461538 2.166667 37.50000 366.3333 2.50 0.15 65.25 14.22 7.12 0.4 0.88 65.25 2.666667 47.46667 435.0000 17.80000 4.588608 0.375000 2.666667 47.46667 435.0000 3.00 0.18 64.32 1.87 9.16 0.38 0.84 64.32 2.111111 50.88889 357.3333 24.10526 34.39572 0.473684 2.111111 50.88889 357.3333 3.50 0.19 62.96 15.32 5.84 0.47 0.84 62.96 2.473684 30.73684 331.3684 12.42553 4.109661 0.404255 2.473684 30.73684 331.3684 4.00 0.2 65.32 14.80 5.45 0.41 0.82 65.32 2.050000 27.25000 326.6000 13.29268 4.413514 0.487805 2.050000 27.25000 326.6000 4.50 0.21 64.19 14.20 5.13 0.38 1.54 64.19 1.809524 24.42857 305.6667 13.50000 4.520423 0.552632 1.809524 24.42857 305.6667 5.00 0.20 63.82 15.22 4.98 0.43 0.87 63.82 2.150000 24.90000 319.1000 11.58140 4.193167 0.465116 2.150000 24.90000 319.1000 5.50 51.10 4.44 0.82 0.44 1.13 0.17 4.44 0.022114 0.008611 0.086888 0.389381 5.414634 45.22124 0.022114 0.008611 0.086888 6.00 52.43 3.61 0.59 0.39 1.10 0.27 3.61 0.020980 0.007438 0.068854 0.354545 6.118644 47.66364 0.020980 0.007438 0.068854 6.55 51.80 4.94 0.55 0.40 1.44 0.08 4.94 0.027799 0.007722 0.095367 0.277778 8.981818 35.97222 0.027799 0.007722 0.095367
7.00 - - washout - - - -
7.50 52.72 3.48 0.84 0.48 0.84 0.06 3.48 0.015933 0.009105 0.066009 0.571429 4.142857 62.76190 0.015933 0.009105 0.066009 8.05 52.74 3.32 0.57 0.52 1.06 0.72 3.32 0.020099 0.009860 0.062950 0.490566 5.824561 49.75472 0.020099 0.009860 0.062950 8.50 51.66 4.82 0.87 0.52 1.11 0.07 4.82 0.021487 0.010066 0.093302 0.468468 5.540230 46.54054 0.021487 0.010066 0.093302 9.00 51.74 4.16 0.82 0.50 1.68 0.08 4.16 0.032470 0.009664 0.080402 0.297619 5.073171 30.79762 0.032470 0.009664 0.080402 9.50 52.16 3.27 0.65 0.36 106 0.07 3.27 2.032209 0.006902 0.062692 0.003396 5.030769 0.492075 2.032209 0.006902 0.062692 10.00 52.58 3.37 0.59 0.39 0.98 0.17 3.37 0.018638 0.007417 0.064093 0.397959 5.711864 53.65306 0.018638 0.007417 0.064093 10.50 52.52 3.90 0.47 0.32 0.83 0.16 3.90 0.015804 0.006093 0.074257 0.385542 8.297872 63.27711 0.015804 0.006093 0.074257 11.00 52.16 3.51 0.52 0.35 0.70 0.06 3.51 0.013420 0.006710 0.067293 0.500000 6.750000 74.51429 0.013420 0.006710 0.067293 11.50 51.80 4.36 0.85 0.42 1.18 0.12 4.36 0.022780 0.008108 0.084170 0.355932 5.129412 43.89831 0.022780 0.008108 0.084170 12.00 51.85 4.06 0.90 0.45 1.11 0.19 4.06 0.021408 0.008679 0.078303 0.405405 4.511111 46.71171 0.021408 0.008679 0.078303
12.30 - - washout - - - -
O. A. Boboye, O. J. Omotosho
Table 2. Major elemental geochemistry of the Akinbo and Ewekoro Formations in Well-2.
Depth (m) CaO(%) SiO2(%) Al2O3(%) Fe2O3(%) MgO(%) K2O(%) Mg/Ca Fe/Ca Si/Ca Fe/Mg Si/Al Ca/Mg 0.50 0.16 72.36 10.16 5.38 0.15 0.10 0.937500 33.62500 452.2500 35.86667 7.122047 1.066667 1.00 0.14 6.77 15.68 6.65 0.40 0.80 2.857143 47.50000 48.35714 16.62500 0.431760 0.350000 1.50 0.15 62.85 14.76 5.57 0.19 0.29 1.266667 37.13333 419.0000 29.31579 4.258130 0.789474 2.00 0.13 63.82 14.72 6.48 0.31 0.62 2.384615 49.84615 490.9231 20.90323 4.335598 0.419355 2.50 0.12 62.94 15.37 5.94 0.37 0.76 3.083333 49.50000 524.5000 16.05405 4.094990 0.324324 3.00 0.14 60.85 14.13 5.30 0.26 0.39 1.857143 37.85714 434.6429 20.38462 4.306440 0.538462 3.50 0.14 62.86 14.12 7.24 0.36 0.79 2.571429 51.71429 449.0000 20.11111 4.451841 0.388889 4.00 0.19 63.75 14.45 4.98 0.47 0.90 2.473684 26.21053 335.5263 10.59574 4.411765 0.404255 4.50 0.17 62.93 14.10 6.18 0.14 0.79 0.823529 36.35294 370.1765 44.14286 4.463121 1.214286 5.00 0.19 65.27 16.26 5.30 0.47 0.94 2.473684 27.89474 343.5263 11.27660 4.014145 0.404255 5.50 0.18 63.79 15.15 5.18 0.38 0.92 2.111111 28.77778 354.3889 13.63158 4.210561 0.473684 6.00 0.16 67.62 11.14 5.30 0.35 0.35 2.187500 33.12500 422.6250 15.14286 6.070018 0.457143 6.50 0.19 62.90 15.92 5.17 0.39 0.97 2.052632 27.21053 331.0526 13.25641 3.951005 0.487179 6.90 0.30 65.72 13.47 5.31 0.29 1.79 0.966667 17.70000 219.0667 18.31034 4.878990 1.034483 7.50 49.43 8.12 2.27 1.27 1.15 0.13 0.023265 0.025693 0.164273 1.104348 3.577093 42.98261 8.00 52.45 2.76 0.49 0.35 0.67 0.09 0.012774 0.006673 0.052622 0.522388 5.632653 78.28358 8.50 53.31 2.15 0.35 0.22 0.50 0.06 0.009379 0.004127 0.040330 0.440000 6.142857 106.6200 9.00 53.35 2.74 0.45 0.35 0.52 0.06 0.009747 0.006560 0.051359 0.673077 6.088889 102.5962 9.50 49.63 6.22 0.97 0.65 0.77 0.05 0.015515 0.013097 0.125327 0.844156 6.412371 64.45455 10.00 51.87 4.80 0.45 0.37 0.66 0.06 0.012724 0.007133 0.092539 0.560606 10.66667 78.59091 10.50 53.55 2.32 0.39 0.32 0.75 0.05 0.014006 0.005976 0.043324 0.426667 5.948718 71.40000 11.00 52.25 3.80 0.47 0.38 0.65 0.06 0.012440 0.007273 0.072727 0.584615 8.085106 80.38462 11.50 53.34 2.30 0.47 0.32 0.67 0.05 0.012561 0.005999 0.043120 0.477612 4.893617 79.61194 12.00 52.48 3.26 0.38 0.28 0.52 0.04 0.009909 0.005335 0.062119 0.538462 8.578947 100.9231 12.50 53.49 2.16 0.42 0.25 0.49 0.05 0.009161 0.004674 0.040381 0.510204 5.142857 109.1633 13.00 53.44 2.90 0.44 0.36 0.56 0.38 0.010479 0.006737 0.054266 0.642857 6.590909 95.42857 13.50 52.57 3.67 0.45 0.34 0.52 0.05 0.009892 0.006468 0.069812 0.653846 8.155556 101.0962 14.00 53.88 2.40 0.73 0.35 0.68 0.06 0.012621 0.006496 0.044543 0.514706 3.287671 79.23529 14.60 51.90 4.25 0.60 0.40 1.02 0.07 0.019653 0.007707 0.081888 0.392157 7.083333 50.88235
15.00 - - washout - - - -
15.50 48.67 7.40 0.80 0.59 2.52 0.09 0.051777 0.012122 0.152044 0.234127 9.250000 19.31349 16.00 51.33 4.29 0.45 0.37 1.32 0.08 0.025716 0.007208 0.083577 0.280303 9.533333 38.88636 16.50 54.39 1.36 0.58 0.47 0.95 0.06 0.017466 0.008641 0.025005 0.494737 2.344828 57.25263 17.00 53.99 2.19 0.52 0.32 0.76 0.06 0.014077 0.005927 0.040563 0.421053 4.211538 71.03947 17.50 53.23 2.59 0.56 0.49 0.57 0.05 0.010708 0.009205 0.048657 0.859649 4.625000 93.38596 18.00 51.18 4.33 0.83 0.44 1.10 0.07 0.021493 0.008597 0.084603 0.400000 5.216867 46.52727 18.60 51.99 4.44 0.68 0.39 1.28 0.03 0.024620 0.007501 0.085401 0.304688 6.529412 40.61719 19.50 49.23 8.44 0.52 0.45 1.23 0.13 0.024985 0.009141 0.171440 0.365854 16.23077 40.02439 20.00 47.13 10.24 1.54 1.20 1.22 0.12 0.025886 0.025461 0.217271 0.983607 6.649351 38.63115 20.50 48.94 7.52 0.82 0.67 0.71 0.06 0.014508 0.013690 0.153658 0.943662 9.170732 68.92958
Table 3. Major elemental geochemistry of the Akinbo and Ewekoro Formation in Well-3.
Depth (m) CaO(%) SiO2(%) Al2O3(%) Fe2O3(%) MgO(%) K2O(%) Mg/Ca Fe/Ca Si/Ca Fe/Mg Si/Al Ca/Mg 1.00 0.18 72.79 10.65 6.25 0.19 0.12 1.055556 34.72222 404.3889 32.89474 6.834742 0.947368 1.50 0.13 63.42 12.89 9.27 0.28 0.55 2.153846 71.30769 487.8462 33.10714 4.920093 0.464286 2.00 0.1 64.42 12.19 11.14 0.31 0.71 3.100000 111.4000 644.2000 35.93548 5.284660 0.322581 2.50 0.14 62.57 12.86 8.17 0.33 0.75 2.357143 58.35714 446.9286 24.75758 4.865474 0.424242 3.00 0.16 63.92 11.14 7.32 0.29 0.71 1.812500 45.75000 399.5000 25.24138 5.737882 0.551724 3.50 0.44 65.95 12.9 4.26 0.21 1.38 0.477273 9.681818 149.8864 20.28571 5.112403 2.095238 4.00 0.28 64.52 10.57 7.44 0.2 1.27 0.714286 26.57143 230.4286 37.20000 6.104068 1.400000 4.50 0.12 63.94 11.27 8.57 0.27 1.93 2.250000 71.41667 532.8333 31.74074 5.673469 0.444444 5.00 0.11 62.67 13.32 8.36 0.26 2.79 2.363636 76.00000 569.7273 32.15385 4.704955 0.423077 5.50 52.4 3.30 0.75 0.60 0.57 0.06 0.010878 0.011450 0.062977 1.052632 4.400000 91.92982
6.00 - - - washout - - - -
6.50 40.21 18.2 4.22 2.72 1.13 0.04 0.028102 0.067645 0.452624 2.407080 4.312796 35.58407 7.00 52.69 3.76 0.84 0.46 0.56 0.07 0.010628 0.00873 0.071361 0.821429 4.476190 94.08929 7.50 52.12 3.68 0.65 0.54 0.48 0.06 0.00921 0.010361 0.070606 1.125000 5.661538 108.5833 8.00 53.74 2.5 0.34 0.29 0.38 0.06 0.007071 0.005396 0.046520 0.763158 7.352941 141.4211 8.50 52.44 3.34 0.52 0.42 0.32 0.05 0.006102 0.008009 0.063692 1.312500 6.423077 163.8750 9.00 54.19 1.43 0.34 0.28 0.40 0.08 0.007381 0.005167 0.026389 0.700000 4.205882 135.4750 9.50 53.37 2.17 0.59 0.36 0.54 0.09 0.010118 0.006745 0.040660 0.666667 3.677966 98.83333 10.00 52.22 3.55 0.75 0.55 0.52 0.05 0.009958 0.010532 0.067982 1.057692 4.733333 100.4231
10.50 - - - washout - - - -
11.00 53.94 2.27 0.56 0.32 0.32 0.06 0.005933 0.005933 0.042084 1.000000 4.053571 168.5625 11.50 54.15 1.25 0.45 0.32 0.36 0.16 0.006648 0.005910 0.023084 0.888889 2.777778 150.4167 12.00 53.94 2.66 0.44 0.21 0.49 0.06 0.009084 0.003893 0.049314 0.428571 6.045455 110.0816 12.50 53.72 2.41 0.2 0.36 0.51 0.11 0.009494 0.006701 0.044862 0.705882 12.05000 105.3333 13.00 53.51 2.82 0.45 0.32 0.64 0.04 0.011960 0.005980 0.052700 0.500000 6.266667 83.60938 13.50 52.32 3.63 0.58 0.45 0.92 0.04 0.017584 0.008601 0.069381 0.489130 6.258621 56.86957 13.70 48.42 7.69 1.55 1.03 3.71 0.06 0.076621 0.021272 0.158819 0.277628 4.961290 13.05121
14.20 - - - washout - - - -
14.50 48.42 7.69 1.55 1.03 3.71 0.06 0.076621 0.021272 0.158819 0.277628 4.961290 13.05121 15.00 48.84 5.32 1.85 1.10 2.36 0.06 0.048321 0.022523 0.108927 0.466102 2.875676 20.69492 15.50 51.75 4.37 0.87 0.45 1.32 0.05 0.025507 0.008696 0.084444 0.340909 5.022989 39.20455 16.00 51.96 4.03 1.48 1.20 1.12 0.08 0.021555 0.023095 0.077560 1.071429 2.722973 46.39286 16.60 48.73 6.73 1.48 1.20 1.12 0.08 0.022984 0.024625 0.138108 1.071429 4.547297 43.50893
17.70 - - - washout - - - -
O. A. Boboye, O. J. Omotosho
Table 4. Major elemental geochemistry of the Akinbo and Ewekoro Formations in Well-4.
Depth (m) CaO(%) SiO2(%) Al2O3(%) Fe2O3(%) MgO(%) K2O(%) Mg/Ca Fe/Ca Si/Ca Fe/Mg Si/Al Ca/Mg
1.00 0.13 72.7 10.34 5.16 0.18 0.19 1.384615 39.66154 559.2308 28.64444 7.030948 0.722222
1.50 0.18 72.31 11.31 5.31 0.16 0.24 0.888889 29.50000 401.7222 33.1875 6.393457 1.125000
2.00 0.19 65.83 12.81 8.35 0.30 4.68 1.578947 43.94737 346.4737 27.83333 5.138954 0.633333
2.50 0.16 64.25 12.75 10.23 0.27 3.44 1.687500 63.93750 401.5625 37.88889 5.039216 0.592593
3.00 51.26 4.15 0.82 0.62 0.69 0.11 0.013461 0.012095 0.080960 0.898551 5.060976 74.28986
3.30 53.73 2.24 0.55 0.34 0.51 0.06 0.009492 0.006328 0.041690 0.666667 4.072727 105.3529
4.00 52.84 3.44 0.49 0.38 0.54 0.65 0.010220 0.007192 0.065102 0.703704 7.020408 97.85185
4.50 53.49 2.31 0.65 0.53 0.51 0.06 0.009534 0.009908 0.043186 1.039216 3.553846 104.8824
5.00 54.68 1.47 0.56 0.45 0.50 0.08 0.009144 0.008230 0.026884 0.900000 2.625000 109.3600
5.50 54.39 1.45 0.49 0.28 0.34 0.05 0.006251 0.005148 0.026659 0.823529 2.959184 159.9706
6.00 53.63 2.60 0.52 0.35 0.35 0.13 0.006526 0.006526 0.048480 1.000000 5.000000 153.2286
6.50 53.84 2.49 0.64 0.52 0.34 0.07 0.006315 0.009658 0.046248 1.529412 3.890625 158.3529
7.00 53.17 2.94 0.52 0.40 0.25 0.08 0.004702 0.007523 0.055294 1.600000 5.653846 212.6800
7.50 54.62 1.69 0.40 0.24 0.29 0.06 0.005309 0.004394 0.030941 0.827586 4.225000 188.3448
8.00 54.36 1.59 0.45 0.35 0.38 0.05 0.006990 0.006439 0.029249 0.921053 3.533333 143.0526
8.50 48.11 7.17 1.95 0.86 0.97 0.11 0.020162 0.017876 0.149033 0.886598 3.676923 49.59794
9.00 48.35 6.75 1.65 1.00 1.20 0.21 0.024819 0.020683 0.139607 0.833333 4.090909 40.29167
9.50 51.40 4.31 0.55 0.42 1.37 0.09 0.026654 0.008171 0.083852 0.306569 7.836364 37.51825
10.00 52.29 3.34 0.72 0.65 0.89 0.05 0.017020 0.012431 0.063875 0.730337 4.638889 58.75281
10.50 52.79 3.45 0.60 0.44 0.88 0.05 0.016670 0.008335 0.065353 0.500000 5.750000 59.98864
11.00 53.12 2.93 0.67 0.47 0.92 0.05 0.017319 0.008848 0.055158 0.510870 4.373134 57.73913
11.50 53.19 2.30 0.57 0.45 0.68 0.05 0.012784 0.008460 0.043241 0.661765 4.035088 78.22059
12.00 52.37 3.21 0.54 0.38 0.86 0.05 0.016422 0.007256 0.061295 0.441860 5.944444 60.89535
12.50 52.24 3.62 0.54 0.42 0.87 0.08 0.016654 0.008040 0.069296 0.482759 6.703704 60.04598
13.00 51.69 4.24 0.62 0.45 0.91 0.04 0.017605 0.008706 0.082027 0.494505 6.838710 56.80220
13.50 51.33 4.50 0.92 0.82 0.8 0.05 0.015585 0.015975 0.087668 1.025000 4.891304 64.16250
14.00 51.92 4.32 0.82 0.62 0.77 0.04 0.014831 0.011941 0.083205 0.805195 5.268293 67.42857
14.50 50.05 5.36 0.96 0.85 1.03 0.05 0.020579 0.016983 0.107093 0.825243 5.583333 48.59223
15.00 48.21 8.26 1.27 0.85 0.98 0.05 0.020328 0.017631 0.171334 0.867347 6.503937 49.19388
15.50 46.48 10.56 2.54 1.24 1.11 0.12 0.023881 0.026678 0.227194 1.117117 4.157480 41.87387
Table 5. Major elemental geochemistry of the Akinbo and Ewekoro Formations in Well-5.
Depth (m) CaO(%) SiO2(%) Al2O3(%) Fe2O3(%) MgO(%) K2O(%) Mg/Ca Fe/Ca Si/Ca Fe/Mg Si/Al Ca/Mg
1.00 0.14 30.47 8.62 4.34 0.29 0.54 2.071429 31.00000 217.6429 14.96552 3.534803 0.482759
1.50 0.18 70.77 12.37 6.04 0.22 0.17 1.222222 33.55556 393.1667 27.45455 5.721099 0.818182
2.00 0.10 68.47 1362 7.14 0.29 0.24 2.900000 71.40000 684.7000 24.62069 0.050272 0.344828
2.55 0.15 64.84 12.6 8.30 0.17 0.22 1.133333 55.33333 432.2667 48.82353 5.146032 0.882353
3.00 54.10 1.45 0.49 0.35 0.44 0.06 0.008133 0.006470 0.026802 0.795455 2.959184 122.9545
3.50 53.91 2.80 0.56 0.39 0.43 0.08 0.007976 0.007234 0.051938 0.906977 5.000000 125.3721
4.00 53.22 2.16 0.54 0.43 0.45 0.16 0.008455 0.008080 0.040586 0.955556 4.000000 118.2667
4.40 - - - washout - - - -
4.50 53.22 2.16 0.54 0.43 0.45 0.16 0.008455 0.008080 0.040586 0.955556 4.000000 118.2667
5.00 54.36 4.31 0.48 0.38 0.38 0.06 0.006990 0.006990 0.079286 1.000000 8.979167 143.0526
5.50 52.94 3.46 0.75 0.47 0.48 0.05 0.009067 0.008878 0.065357 0.979167 4.613333 110.2917
6.00 52.46 3.37 0.64 0.54 0.59 0.08 0.011247 0.010294 0.064239 0.915254 5.265625 88.91525
6.50 51.70 4.32 0.62 0.45 0.96 0.09 0.018569 0.008704 0.083559 0.468750 6.967742 53.85417
7.50 49.39 6.60 0.88 0.45 1.14 0.08 0.023082 0.009111 0.133630 0.394737 7.500000 43.32456
8.00 52.68 3.34 0.79 0.44 0.69 0.05 0.013098 0.008352 0.063402 0.637681 4.227848 76.34783
8.50 52.44 3.20 0.71 0.48 0.83 0.06 0.015828 0.009153 0.061022 0.578313 4.507042 63.18072
9.00 53.57 2.65 0.55 0.43 0.57 0.04 0.010640 0.008027 0.049468 0.754386 4.818182 93.98246
9.50 51.8 4.44 0.84 0.65 0.63 0.06 0.012162 0.012548 0.085714 1.031746 5.285714 82.22222
10.00 51.96 4.80 0.65 0.35 0.90 0.05 0.017321 0.006736 0.092379 0.388889 7.384615 57.73333
10.50 52.8 3.40 0.84 0.56 0.73 0.04 0.013826 0.010606 0.064394 0.767123 4.047619 72.32877
11.00 51.50 4.90 0.82 0.65 0.32 0.14 0.006214 0.012621 0.095146 2.031250 5.975610 160.9375
11.50 52.79 3.67 0.68 0.54 0.39 0.12 0.007388 0.010229 0.069521 1.384615 5.397059 135.3590
12.00 51.47 4.73 0.73 0.48 1.29 0.15 0.025063 0.009326 0.091898 0.372093 6.479452 39.89922
12.50 43.46 15.2 3.75 2.10 0.29 0.07 0.006673 0.048320 0.349747 7.241379 4.053333 149.8621
13.00 51.62 4.32 0.62 0.50 0.30 0.13 0.005812 0.009686 0.083688 1.666667 6.967742 172.0667
13.50 37.95 21.4 3.25 2.75 1.45 0.20 0.038208 0.072464 0.563900 1.896552 6.584615 26.17241
14.00 51.36 4.73 0.96 0.84 0.62 0.15 0.012072 0.016355 0.092095 1.354839 4.927083 82.83871
O. A. Boboye, O. J. Omotosho
Table 6. Major elemental geochemistry of the Akinbo and Ewekoro Formations in Well-6.
Depth (m) CaO(%) SiO2(%) Al2O3(%) Fe2O3(%) MgO(%) K2O(%) Mg/Ca Fe/Ca Si/Ca Fe/Mg Si/Al Ca/Mg
1.00 0.16 69.21 12.45 8.88 0.15 0.14 0.937500 55.50000 432.5625 59.20000 5.559036 1.066667
1.50 0.14 70.5 10.81 6.26 0.17 0.10 1.214286 44.71429 503.5714 36.82353 6.521739 0.823529
2.00 0.10 60.75 15.6 9.63 0.18 0.29 1.800000 96.30000 607.5000 53.50000 3.894231 0.555556
2.50 0.11 61.78 16.22 9.02 0.19 0.30 1.727273 8200000 561.6364 47.47368 3.808878 0.578947
3.00 54.13 1.29 0.49 0.34 0.37 0.06 0.006835 0.006281 0.023832 0.918919 2.632653 146.2973
3.10 54.12 1.82 0.38 0.29 0.25 0.06 0.004619 0.005358 0.033629 1.160000 4.789474 216.4800
4.00 54.12 1.82 0.38 0.29 0.25 0.06 0.004619 0.005358 0.033629 1.160000 4.789474 216.4800
4.50 53.40 2.90 0.42 0.37 0.67 0.13 0.012547 0.006929 0.054307 0.552239 6.904762 79.70149
5.00 41.63 19.00 1.98 1.39 0.78 0.08 0.018736 0.033389 0.456402 1.782051 9.595960 53.37179
5.50 54.24 1.42 0.42 0.25 0.33 0.04 0.006084 0.004609 0.026180 0.757576 3.380952 164.3636
6.00 51.40 4.37 0.62 0.42 0.6 0.12 0.011673 0.008171 0.085019 0.700000 7.048387 85.66667
6.50 0.23 64.84 11.5 5.88 0.14 0.08 0.608696 25.56522 281.9130 42.00000 5.638261 1.642857
7.10 51.12 4.27 0.59 0.42 0.22 0.06 0.004304 0.008216 0.083529 1.909091 7.237288 232.3636
8.50 53.34 2.25 0.38 0.25 0.71 0.35 0.013311 0.004687 0.042182 0.352113 5.921053 75.12676
9.50 52.72 3.56 0.54 0.42 0.62 0.05 0.011760 0.007967 0.067527 0.677419 6.592593 85.03226
10.00 53.12 2.25 0.63 0.54 0.66 0.10 0.012425 0.010166 0.042357 0.818182 3.571429 80.48485
10.50 51.24 4.21 0.52 0.44 0.96 0.15 0.018735 0.008587 0.082162 0.458333 8.096154 53.37500
11.00 52.67 3.2 0.64 0.46 0.82 0.06 0.015569 0.008734 0.060756 0.560976 5.000000 64.23171
11.40 52.85 3.71 0.8 0.47 0.42 0.08 0.007947 0.008893 0.070199 1.119048 4.637500 125.8333
12.00 52.02 3.14 0.65 0.52 0.69 0.15 0.013264 0.009996 0.060361 0.753623 4.830769 75.39130
12.50 51.10 4.19 0.74 0.46 1.2 0.14 0.023483 0.009002 0.081996 0.383333 5.662162 42.58333
13.00 51.25 4.25 0.48 0.37 0.92 0.05 0.017951 0.007220 0.082927 0.402174 8.854167 55.70652
13.50 51.20 4.71 0.62 0.38 0.72 0.06 0.014063 0.007422 0.091992 0.527778 7.596774 71.11111
14.00 50.61 5.98 0.56 0.44 0.6 0.13 0.011855 0.008694 0.118158 0.733333 10.67857 84.35000
14.50 43.72 18.18 0.79 0.63 0.63 0.26 0.014410 0.014410 0.415828 1.000000 23.01266 69.39683
15.00 53.29 2.27 0.36 0.24 0.82 0.07 0.015388 0.004504 0.042597 0.292683 6.305556 64.98780
15.50 48.12 11.7 0.58 0.41 0.68 0.18 0.014131 0.008520 0.243142 0.602941 20.17241 70.76471
16.00 48.14 9.34 0.57 0.33 0.53 0.28 0.011010 0.006855 0.194017 0.622642 16.38596 90.83019
Table 7. Summary of carbonate petrography of the limestone.
Sample No Depth (m)
Allochems (and% Composition)
Sparite Micrite Support Bioclasts Intraclasts Pellets Ooids
A2 12.0 Sponge spicules, pelecypods, algae, echinoids, shell fragments, gastropods (48%)
Intraclasts
(2%) Few (2%) Few (2%)
Present as infill within bioclasts, (6%)
Present as
matrix, (40%) Micrite
B2 15.0 Coralline algae, gastropods, algae, corals, pelecypods, foraminifera, shell fragments, sponge spicules, (35%)
Present
(15%) Present (3%) Few (2%)
Present as infill and matrix components, (10%)
Present as
matrix, (35%) Micrite
C2 19.0 Gastropods foraminifera, algae mat, echinoid, shell fragments, sponge spicules, (36%)
Present
(10%) Present (6%) Few (2%)
Present as infill and matrix components, (6%)
Present as
matrix, (40%) Micrite
Submit or recommend next manuscript to SCIRP and we will provide best service for you:
Accepting pre-submission inquiries through Email, Facebook, LinkedIn, Twitter, etc. A wide selection of journals (inclusive of 9 subjects, more than 200 journals)
Providing 24-hour high-quality service User-friendly online submission system Fair and swift peer-review system
Efficient typesetting and proofreading procedure
Display of the result of downloads and visits, as well as the number of cited articles Maximum dissemination of your research work
Submit your manuscript at: http://papersubmission.scirp.org/
![Figure 2. Stratigraphy of Nigerian eastern sector of Dahomey Basin (modified after Omatsola and Adegoke, [4])](https://thumb-us.123doks.com/thumbv2/123dok_us/7758308.711707/4.595.217.534.66.317/figure-stratigraphy-nigerian-eastern-dahomey-modified-omatsola-adegoke.webp)