2. The simulation, synthesis and design of reactive and azeotropic distillation. Such topics still consti-tute a gap in the knowledge of distillation tech-nology.
3. Investigation of complex conRgurations for batch distillation processes.
4. Use of optimization methods for obtaining opti-mal conRguration and design of batch and con-tinuous distillation processes.
5. Online optimization and control of columns.
See also: II/Distillation: Batch Distillation; Theory of Dis-tillation; Vapour-Liquid Equilibrium: Correlation and Pre-diction; Vapour-Liquid Equilibrium: Theory.
Further Reading
Diwekar UM (1995)Batch Distillation:Simulation, Opti-mal Design and Control. Series in Chemical and Mech-anical Engineering. Washington, DC: Taylor&Francis.
Doherty MF and Buzad G (1992) Reactive distillation by design.Transactions of the Institution of Chemical En-gineers70: part A.
Gmehling J and Onken U (1977) Vapor}Liquid Equilib-rium Data Collections, DECHEMA Chemistry Data series, vol. 1. Frankfurt:
Henley EJ and Seader JD (1981)Equilibrium-Stage Separ-ation OperSepar-ations in Chemical Engineering. New York: Wiley.
Holland CD (1981)Fundamentals of Multicomponent Dis-tillation. New York: McGraw-Hill.
King CJ (1980)Separation Processes,2nd edn. New York: McGraw-Hill.
Kister HZ (1992) Distillation Design. New York: McGraw-Hill.
Perry RH, Green DW and Maloney JO (1984) Perry’s Chemical Engineers’ Handbook, 6th edn. New York: McGraw-Hill.
Schweitzer PA (1979)Handbook of Separation Techniques for Chemical Engineers. New York: McGraw-Hill, The Kingsport Press.
Treybal RE (1980) Mass Transfer Operations, 3rd edn. New York: McGraw-Hill.
Packed Columns: Design and Performance
L. Klemas, Bogota, Colombia J. A. Bonilla, Ellicott City, MD, USA
Copyright^ 2000 Academic Press
Use of Packing in Distillation
Use of packing in mass transfer has its origins in the early 1800s for simple applications such as alcohol distillation, and in sulfuric acid plant absorbers. Glass balls, coke or even stones were used as packing ma-terials. Nevertheless packings for distillation were not established until the 1930s with the use of regular shape materials such as ceramic Raschig rings and Berl saddles, as well as the availability of distillation calculations such as the McCabe}Thiele and Pon-chon}Savarit methods. Early in the second half of the century, the use of packing for distillation went through a transformation, producing the second-generation packings (see Table 1). Regular and im-proved shape of packings, such as pall rings, became available with larger open areas that permitted a sub-stantial increase both in capacity and column efR cien-cy. In the 1960s Sulzer introduced the wire-mesh packings with very high efRciency (low height equiva-lent to a theoretical plate, HETP), resulting in a new transformation in the use of packings. In the 1970s
and 1980s all major mass-transfer equipment manu-facturers developed structured packings. Compared to the traditional tray columns spectacular improve-ments in plant capacity were achieved, but also some projects were pitfalls, when the expected beneRts did not materialize. Manufacturers started realizing that liquid distributors had to be improved, but there was no coherent understanding, nor correlations, that could lead to a safe distributor-column system design. Many manufacturers returned to trays, producing new improved designs, using the area under the downcomer for vapourSow: these trays are offered with new names that indicate their increased vapour
Sow capacity (MaxySow, Superfrack, etc.). The need for good distribution and its effect on the column efRciency are now well understood, allowing safe design and efRcient applications for random and structured packings in large industrial columns.
General Concepts
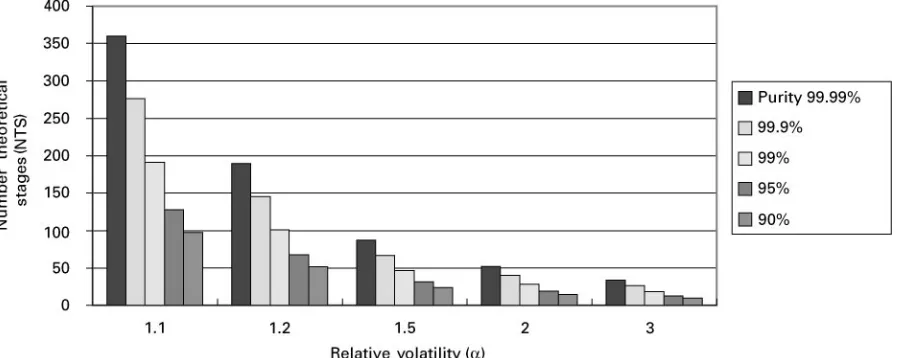
Figure 1 Number of stages required vs. relative volatility at several product purities.
Table 1 Evolution of packing
First generation, before 1950
Second generation, 1950}1970
Third generation, after 1970
Random packings Rashing rings Intalox威(Norton) IMTP威(Norton)
Lessing rings Pall Ringsa CMR威(Koch Glitsch)
Saddles Chempak威b
Fleximax威(Koch Glitsch) Nutter Ring威(Nutter)
Grids C-Grid (Koch Glitsch)c
EF-25 (Koch Glitsch)c
Structured packing Wire-mesh typed Sulzer BX and CY
Mellapack威(Sulzer) Flexipack威(Koch Glitsch) Gempack威(Koch Glitsch) Intalox威(Norton) Montz packing (Montz)
aDeveloped by BASF, still marketed (or variations of it) by most packing manufacturers. bDeveloped by Leva, marketed by Nutter.
cVariations of these grids are now offered by most packing manufacturers. dDeveloped by Sulzer, they are now offered by other manufacturers.
The main variable inSuencing the column design requirements is the relative volatility, . Figure 1 illustrates the effect of on the column perfor-mance:
E As increases, the number of theoretical stages (NTS) required to achieve aRxed product quality decreases, since NTS is proportional to 1/ln(). As
decreases and approaches 1, the number of stages required increases approaching inRnity. At any given, the minimum number of stages required to achieve a given separation corresponds to a total reSux operation. At total reSux all overhead va-pours are condensed and returned to the column as
reSux, so that there is no net product. The min-imum reSux sets the limiting slope of the operating line, required to achieve a given separation. E At constant , the NTS increases as the product
purity increases. The increase is proportional to the logarithm of the key components purity ratio. It can be also demonstrated that:
E At constant product purity, the minimum reSux decreases asincreases.
E At constant product purity, the minimum number of stages decrease asincreases.
E At constant, the minimum reSux decreases as the product purity decreases.
Figure 2 Packed tower illustration. (Photo courtesy of Sulzer Chemtech.)
E At constant, the minimum number of stages in-creases as the product purity inin-creases.
All these statement say that deRnes the separation difRculty. For values around 1.1 and lower, separ-ation by distillsepar-ation becomes very difRcult, requiring very large and expensive columns. For"1 the mix-ture is azeotropic and would require the addition of selective entrainers if azeotropic or extractive distilla-tion is to be applied.
Packed Column Description
Figure 2illustrates a tower with structured packing. In addition to the packing itself, packed columns require other internals to assure the performance of the packing. These internals are:
E Liquid feed pipes to deliver theSuid to the liquid distributors, as seen at the top of the tower and at the intermediate distributor.
E Liquid collection and mixing as shown below the top bed.
E Liquid draw-off sump and pipe as shown below the top bed.
E Liquid redistributors, as presented between the two beds.
E Vapour feed pipes as shown at the vapour inlet nozzle, at the bottom of the tower.
E Packing support plates resting on beams and level-led rings welded to the vessel.
E Hold-down plates.
Incorrect design or incorrect installation of any of these elements can lead to tower failure. One of the most critical element, and often the culprit of tower failures, is the liquid distributor.
Packing Selection
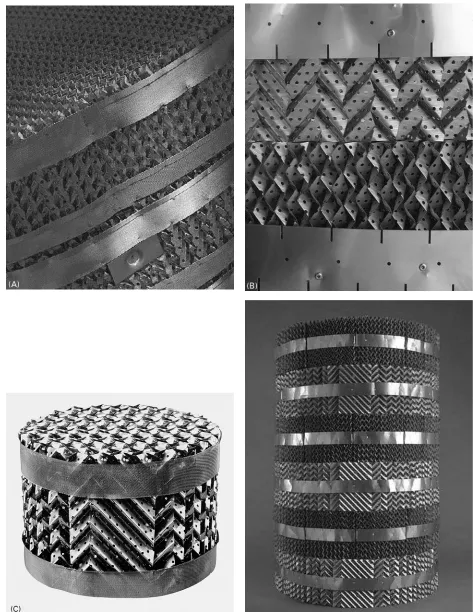
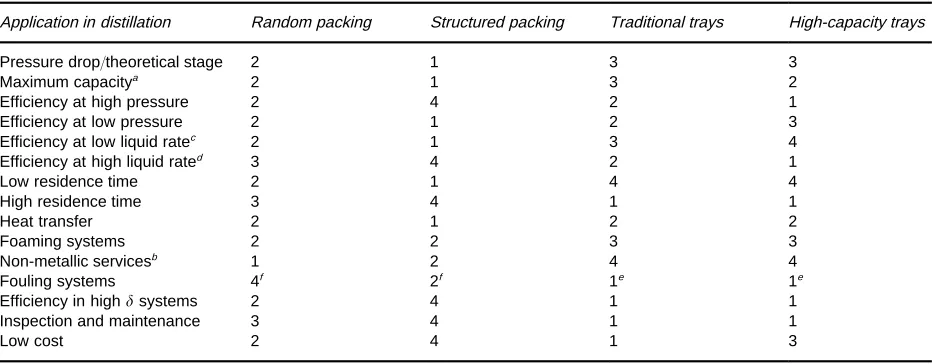
Figures 3 and 4 illustrates random and structured packings. There are many parameters to be con-sidered in the selection of packings; in some cases, there are one or two considerations that dictate the selection, such as capacity for a revamp, which could favour structured packing. There are also some con-siderations or applications, such as high-pressure distillation, that could make structured packing a questionable choice.Table 2gives some general guid-lines on packing selection.
Pressure Drop in Packed Beds
The dry-bed pressure gradient is given by the follow-ing equation:
Figure 3 Random packings: (A) IMTP威. (Photo courtesy of Norton Chemical Process Products Corporation.) (B) Nutter Ring威. (Photo courtesy of Sulzer Chemtech.) (C) Cascade Mini-Rings威(CMR2+) and Fleximax威. (Courtesy of Koch}Glitsch Inc.) (D) Pall Rings metal and plastic. (Courtesy of Koch}Glitsch Inc.)
HNote: in this correlation the original term 100.3Mgwas replaced by
100.024Mgsince the original correlation predicts too high a pressure
drop.
Leva extended the correlation to irrigated beds:
Pi"C110@u1gu2g.
Robbins developed the following set of general pres-sure-drop correlations:
P"C2G2f 10C3Lf
#0.4(Lf/20 000)0.1(C2G2f10C3Lf)4 [2]
where:
Gf"G(0.075/g)0.5(Fp/20)0.5100.024Mg
Figure 4 Continued
Table 2 Packing selection guidelines (trays included as a reference)
Application in distillation Random packing Structured packing Traditional trays High-capacity trays
Pressure drop/theoretical stage 2 1 3 3
Maximum capacitya 2 1 3 2
Efficiency at high pressure 2 4 2 1
Efficiency at low pressure 2 1 2 3
Efficiency at low liquid ratec 2 1 3 4
Efficiency at high liquid rated 3 4 2 1
Low residence time 2 1 4 4
High residence time 3 4 1 1
Heat transfer 2 1 2 2
Foaming systems 2 2 3 3
Non-metallic servicesb 1 2 4 4
Fouling systems 4f 2f 1e 1e
Efficiency in highsystems 2 4 1 1
Inspection and maintenance 3 4 1 1
Low cost 2 4 1 3
Application rating: 1, best; 2, good; 3, fair; 4, poor. aEfficiency may be reduced at high capacities.
bAs may be required based on corrosion protection considerations, such as ceramic. cSystems below 5 gallons min\1ft\2.
dSystems over 15 gallons min\1ft\2.
eApplies to sieve trays, specially dual-flow, not to valve trays.
fIt would require a fouling-resistant distributor, which may result in reduced efficiency.
Figure 5 BedP vs. rates. (Permission from Gulf Publishing Company.)
Lf"L(62.4/1)(Fp/20)0.50.1l (forFpover 15)
C2"7.4;10\8andC3"2.7;10\5
For the case of dry packingLf"0, the
pressure-drop equation reduces to:
P"C2G2f"C2(0.075/20)FpG2/g. [3]
Figure 5 presents a family of pressure drop-lines at constant liquidSow as a function of the vapourSow. The constant liquid rate lines start parallel to the
dry-column line (which is a function of the drag only). Equation [3] allows calculation of the packing factor,Fp, by measuring the slope of the dry-packing
[image:6.568.51.522.457.639.2]point. For any given liquid rate, as the vapour rate further increases, the pressure-drop line slope in-creases rapidly until the line becomes near vertical. At this point theSow andPare unstable, and the bed is
Sooded; the vapourSow does not allow the liquid to
Sow down the bed and there is massive entrainment of liquid in the vapour phase and mass transfer is no longer viable.
For most packings, bed Sooding occurs between 1 and 2 inches of water-pressure drop per foot of packing. Pressure drop atSooding seems to be a func-tion of the packing size. Kister cited Zenz and later Strigle and Rukovena observations indicating that
Sooding (Pfl) is higher for smaller size packings, and
proposed a correlation to determine the pressure drop at Sooding as a function of the packing factor.
Pfl"0.115(Fp)0.7 [4A]
We also obtained by regression from data published by Strigle:
Pfl"0.146Fp0.75inch liquid ft\1or [4B]
P"0.146SgFp0.75inch H2O ft\1 [5]
Pressure drop at incipient loading may be estimated:
Pl"0.072SgFp0.75 [6]
and pressure drop at maximum efRciency loading may be estimated by:
Pe"0.082SgFp0.75 [7]
All the above correlations have been regressed for metallic random packings (Pall Rings and IMPT威).
For column design, it is well-accepted practice to assumeSooding at 1 inch of water per foot of packing pressure drop and design the packing for an operation at 80%Sood. However, when reliable packing-factor information is available, the use of the calculated
Pfl, using one of the eqns [4A], [4B] and [5], is
a more accurate approach.
Caution: Presence of foam, even incipient foam, has a great impact on a packing column pressure drop and performance and should be avoided. Amines, insoluble Rne solids (such as corrosion products), high-viscosity organic liquid (0.5}1 cP or higher) and immiscible liquids are known to foam. For these systems, or other systems known to be prone to foam, continuous or intermittent dosing of antifoam agents may be required to maintain an efRcient packed-column operation. Nevertheless,
uncontrol-led antifoam injection is known to aggravate foaming problems. Filtration of liquids and adsorption of contaminants on activated carbon has proven valu-able to control foaming in some systems such as amines.
Flooding Correlations
Several generalized Sooding and pressure-drop cor-relations have been proposed for commercial pack-ings. Sherwood, Shipley and Holloway presented the Rrst correlation between a ‘Sow parameter’ X deRned as:
X"(L/G) (g/l)0.5 [8]
and a ‘Sooding parameter’YdeRned as:
Yf"(u2g/gc)(a/3)(g/l)0.2"(G2f/gc)(a/3)0.2/(gl).
[9] Sherwood and co-workers correlated dumped and stacked random packing data and found that Yf is
aroundRve times higher for stacked than for dumped packing, which means that mass velocity atSood is over two times higher for stacked packing. This was the precursor idea for the later development of ‘struc-tured’ packings.
Lobo and Friend presented a similar correlation of Yand X with indication of pressure-drop lines and
Sooding line.
Leva proposed a similar correlation with the same
Sow parameter given by eqn [8] and modiRed the
Sooding parameter Yf"(G2f/gc)(a/3)0.2(w/l)2/l.
According to this correlation, minimum loading Ymoccurs at about one-third ofYfwhich means that
loading starts at 50% of the mass Sow rates corre-sponding to theSooding point.
Eckert observed that the packing geometrical pro-perties factor (a/3) did not represent correctly the
packing in theSooding correlations. He introduced a packing factor,Fp. The value of Fp is determined
experimentally from pressure-drop data. The new
Sooding parameter became:
Yf"(G2f/gc)Fp0.2(w/l)2/(gl) [10]
and is correlated to the same Sow parameter X"(L/G) (g/l)0.5.
The most recent proposed correlation was present-ed by Strigle (seeFigure 6):
Figure 6 Striegle pressure drop chart. (Permission from Gulf Publishing Company.)
Figure 7 Modified flooding parameter as a function of the flow parameter. Yis the vapour Sow parameter and is a function of
vapour capacity factor Cs"ug(g/(l!g))0.5, the
packing factor and the kinematic viscosity "/Sg.
Note that atSoodingY"Yf.Yis plotted in a linear
ordinate as a function of the Sow parameter X in a logarithmic abscissa and a family of constant P lines. NoSooding line is shown. The advantage of the linear ordinate is that it is easier to interpolate than the older log}log charts.
Figure 7presents theSooding lines of packings as a function of the packing factor Fp and the Sow
parameterX. The ordinate is the modiRedSooding parameterYHf, deRned as follows:
YHf"Yf/Fp0.5"Cs0.05 [11B]
YHf is plotted as a function of theSow parameterX,
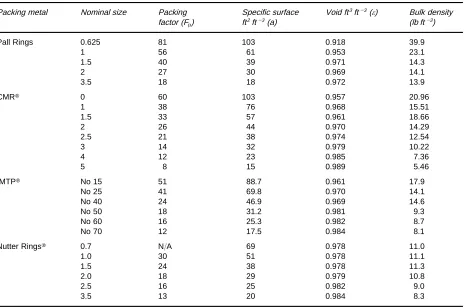
Table 3 Random packing design parameters
Packing metal Nominal size Packing
factor (Fp)
Specific surface ft2ft\3(a)
Void ft3ft\3() Bulk density (lb ft\3)
Pall Rings 0.625 81 103 0.918 39.9
1 56 61 0.953 23.1
1.5 40 39 0.971 14.3
2 27 30 0.969 14.1
3.5 18 18 0.972 13.9
CMR威 0 60 103 0.957 20.96
1 38 76 0.968 15.51
1.5 33 57 0.961 18.66
2 26 44 0.970 14.29
2.5 21 38 0.974 12.54
3 14 32 0.979 10.22
4 12 23 0.985 7.36
5 8 15 0.989 5.46
IMTP威 No 15 51 88.7 0.961 17.9
No 25 41 69.8 0.970 14.1
No 40 24 46.9 0.969 14.6
No 50 18 31.2 0.981 9.3
No 60 16 25.3 0.982 8.7
No 70 12 17.5 0.984 8.1
Nutter Rings威 0.7 N/A 69 0.978 11.0
1.0 30 51 0.978 11.1
1.5 24 38 0.978 11.3
2.0 18 29 0.979 10.8
2.5 16 25 0.982 9.0
3.5 13 20 0.984 8.3
Comparing Packed Column vs. Tray
Tower Capacity
Table 5presents packing capacities, calculated from the above relations, compared to traySooding capac-ities at several tray spacings.
Packed Tower Diameter
Figures 6or7 can be used to determine the column diameter. Using Figure 7 the procedure is as follows: 1. Determine the value of the abscissa X"
L/G(g/l)0.5.
2. Obtain from the manufacturer the selected pack-ingFpvalue, or fromTables 3or4.
3. Determine the ordinate YHf"Cs0.05 from
Fig-ure 7.
4. Calculate the capacity factor at Sood Cs from
the YHf value, the gas velocity at Sood ug"
Cs(l!g)0.5/gand theSooding gas mass velocity
Gfl"ugg.
5. Determine the column cross-sectional area Ac"V/(0.8Gfl), based on 80% of theG Sooding
rate. This is standard design practice for new column sizing, and allows for normalSowS
uctu-ations that occur in actual opeructu-ations and for process control requirements.
6. Determine the column diameterDc"12(4Ac/)0.5.
Turndown and Minimum Wetting Flow
In general, the turndown of a packed tower is limited to the turndown of the liquid distributor, which is its ability to reduce liquid load and still maintain a homogeneous distribution. Most standard liquid distributors can operate efRciently at 50% of its de-sign liquid load; turndown as low as 25% can be achieved.
To operate efRciently as mass-transfer devices, packing should be homogeneously wetted to assure use of the total surface. Minimum recommended values of liquid irrigation depend on the packing material and surface wettability, as follows:
Random packing
Ceramic 0.2 gallons min\1ft\2
Surface-treated or rusted metals
0.5 gallons min\1ft\2
Glass, glassed ceramic and stainless steel
1.0 gallons min\1ft\2
Table 4 Structured packing design parameters
Packing 453 Crimp angle
Size Packing factor Specific surface
ft2ft\3(a)
Void fraction () Bulk density (lb ft\3)
Mellapack威(Sulzer) 125Y 10 35 0.989 5.09
250Y 20 78 0.987 5.61
350Y 23 107 0.983 7.8
500Y 34 155 0.975 10.92
Sulzer BX (Gauze) BX 21 150
Gempack威(Koch Glitsch)
4A 55 138.1 0.942 17
3A 23 91.4 0.962 9.9
2A 15 67 0.972 6.3
1A 9 35 0.977 4.7
Intalox威(Norton) 1T 28.0 95.2 0.980 10.14
2T 20.0 65.3 0.984 8.23
3T 15.0 51.9 0.987 6.55
4T 13.5 40.6 0.986 6.75
5T 12.0 27.0 0.991 4.5
Montz B1-100 30
B1-200 20 61 0.94
B1-250 76
B1-300 33 91
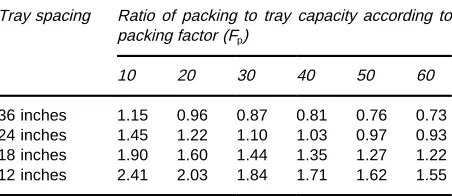
Table 5 Relative capacity of packing and traysa
Tray spacing Ratio of packing to tray capacity according to packing factor (Fp)
10 20 30 40 50 60
36 inches 1.15 0.96 0.87 0.81 0.76 0.73
24 inches 1.45 1.22 1.10 1.03 0.97 0.93
18 inches 1.90 1.60 1.44 1.35 1.27 1.22
12 inches 2.41 2.03 1.84 1.71 1.62 1.55
aTray capacity based on the column full cross-sectional area, without discounting any area for downcomers (which implies high-capacity trays). For conventional trays the ratio of packing capa-city/tray capacity will be higher. Tray capacity taken from the generalized correlation of tray flooding proposed by Fair JR and Matthews RL (Petroleum Refiner 37(4): 153). The packing capa-city taken from the generalized correlations presented by RF Striegle Jr and Figure 6).
Structure packings
Surface-treated metals 0.2 gallons min\1ft\2
Plain surface metals 0.5 gallons min\1ft\2
Type of Liquid Distributors
Liquid distributors can be gravity or pressure fed depending on how the liquid is introduced to the distributor. Pressure distributors are limited to heat transfer and some simple mass-transfer operations, mainly in stripping or absorption. For distillation,
especially for high-purity separations, only gravity distributions are used. Table 6 illustrates the main type of distributors and the main factors to be con-sidered for selection:
E Pipe oriTce headers (POH) (Figure 8) consist of a pipe ladder arrangement with calibrated oriRces drilled in the pipe laterals in a uniform layout. POH can be pressure or gravity fed.
E Pan distributors(PAN) (Figure 9) consist of a Sat horizontal plate (tray) with uniformly spaced calib-rated oriRces that allow the passage of liquid to the packing below. Round or rectangular risers (chim-neys), located within the oriRce pattern, distribute the vapour to the packing above. The riser layout should be uniform and should not interfere with the uniformity of the oriRce layout. PAN distribu-tors are always gravity fed.
E Narrow trough distributors (NTD) (Figure 10A and10B). This distributor is composed of a series of narrow (3}4 inches) parallel troughs fed by one or more larger troughs (parting boxes) oriented at 903from the narrow troughs. The narrow troughs distribute the liquid to the packing below, through calibrated oriRces drilled at the bottom or at the wall. NTD are always fed by gravity.
[image:10.568.52.278.530.628.2]Table 6 Guidelines for distributor selection
Gravity-fed distributors Pressure-fed distributors
POH PAN NTD POH SNH
Uniformity 1 1 1 2 3
High-purity fractionation 1 1 1 3 3
Maximum drip points per area 2 1 1 2 2
For large diameter towers (over 10 ft) 1 3 1 1 1
Leakage potential C Ha C C C
For high liquid rates 2 1 2 2 1
For high vapour rates 1 3 1 1 1
Residence time C A B C C
Solids handling 3 3 2b 2 1
Turndown 1 1 1 1 3
Easy installation and levelling 1 3 2 1 1
Cost B A A C C
1, Good; 2, fair; 3, poor; A, high; B, medium; C, low. aUnless it is seal-welded.
[image:11.568.288.520.509.693.2]bVery good if a V-notch is provided at the top of the trough wall for liquid flow. Nevertheless, the quality and turndown of the distributor are affected.
Figure 8 POH distributor. (Courtesy of Norton Chemical
Pro-cess Products Corp.) Figure 9 PAN distributor.
further spreading. This results in either an overlap or a gap of the cone projection over the packed bed, and deteriorates the uniformity of the distri-bution. SNHs can handle very large liquid rates and are very efRcient for heat transfer.
Liquid Mixing, Redistribution and
Maximum Bed Height
Initial liquid distribution is essential to achieve good packed tower efRciency. Hoek suggested that at a givenSow rate, each packing has its natural distri-bution determined by its radial spreading coefRcient. Although this effect does spread the initial liquid distribution, this effect is not sufRcient to correct poor initial distribution. Radial concentration gradi-ents already established at the top of the bed cannot be compensated by additional packing. The result is permanent efRciency loss.
In general, if a good distribution is established at the top of the bed, the packing will develop its natural distribution and maintain it for bed depths of 10 NTS or more. Columns requiring more than 10 NTS per section should be subdivided into several packing beds to maintain coefRcient HETP values. Liquid redistribution, and often mixing, are required be-tween these bed sections.
Distributor Design Parameters
Distributor Liquid Level and Hole Diameter
The basic distributor design equation relates the total oriRce open area, the liquid head and the volumetric
Sow:
[image:11.568.52.278.564.679.2]Figure 10 NTD distributor: (A) Photo courtesy of Norton Chemical Process Products Corp. (B) Photo courtesy of Koch}Glitsch Inc.
Figure 11 SNH distributor. (Courtesy of Norton Chemical Pro-cess Products Corp.)
where Q is the volumetric Sow rate, Co the oriRce
Sow coefRcient,nthe number of oriRces,a0the open
area of one oriRce, h the liquid head over the oriRce, and hd the vapour-pressure drop across
the distributor given in head of liquid. The value of Covaries between 0.5 to 0.8 and is near 0.6 for most
commercial distributors. Using this value, eqn [12] becomes:
Q"4.0nd2(h!h d)0.5
and:
n"0.25Q/d2(h!h
d)0.5 [13]
The minimum recommended oriRce diameter, to pre-vent plugging, is 3/8 inch for carbon steel and 1/8 inch for stainless steel. The minimum recommended liquid level at minimum Sow is 2 inches. If a 50% turndown is speciRed, the required liquid level at normal liquid load becomes 8 inches.
Uniformity of the Drip Point Layout
Density of liquid drip points is not enough to assure a good distributor quality. The distribution must be homogeneous; the same amount of liquid should irri-gate the packing at any fraction of the tower cross-sectional area. Areas near the tower wall should receive the same amount of liquid as areas near the centre.
Other Considerations
A number of factors need to be considered when selecting and designing packing and distributors. Ratio Tower to Packing Size
The minimum recommended ratio of the tower dia-meter to the packing size is 8. In the case of structured packings, this ratio applies to the ratio of the tower diameter to the crimp size.
Fouling
[image:12.568.64.264.571.682.2]Figure 12 Vapour distributor. (Courtesy of Sulzer Chemtech.)
Figure 13 Distributor testing facilities. (Photo courtesy of Koch}Glitsch Inc.)
some slurries. SNHs can also handle slurries but their application is limited to heat transfer.
Vapour Distribution Requirements
Vapours entering the tower have a kinetic energy proportional to their velocity, which is converted into pressure as the vapour turns to startSowing upward in the tower. The resulting radial pressure proRle is not uniform; areas of higher pressure would allow higher vapour up-Sow. This is especially critical for low-pressure drop packings such as structured pack-ings. Vapour radial velocity proRles are corrected by pressure drop and by diffusion devices. The following is the recommended practice for vapour distribution: E Low vapour inlet velocity (velocity head below 0.5 inches of water): no inlet distributor required, pro-vide as minimum 11
2 column diameters, or 36
inches between the top of the vapour inlet nozzle and the bottom of the bed.
E Intermediate vapour inlet velocity (velocity head between 0.5 and 1.5 inches of water): provide an inlet vapour diffuser directing vapourSow down the tower. This type of device can be a horizontal pipe with the bottom half cut as shown at the bottom of the column inFigure 2. Vertical bafSes can be provided for better vapour distribution. The purpose of these bafSes is to stop the horizontal velocity component of the vapour.
E High vapour velocity (velocity heads above 1.5 inches of water): provide an inlet vapour diffuser, as described above, plus a small riser chimney tray with a pressure drop of a minimum of 2 inches of water. The pressure drop can be created by oriRces at the bottom of the risers. A vapour distributor, as shown in Figure 12 is a good alternative to the vapour diffuser in critical systems.
Distributor Testing
Water test of assembled distributors at the manufac-turer’s workshop is always a good practice for all high-efRciency distributors. The test should deter-mine liquid rate gradients under the distributor, liquid level in the distributor itself at design and
turndown liquid rate, liquid level gradient in the trough and uniformity of the drip point layout. These parameters should be compared to the distributor design parameters and adjustments made to the dis-tributor if necessary. Figure 13 shows a distributor testing facility.
Packing Performance in Distillation
Factors to Consider in Determining the Column Design HETP
The height equivalent to a theoretical plate (HETP) is determined by the following main three factors: Intrinsic geometric shape and size of the packing This factor determines the surface per unit of volume, and the packing capacity of establishing effective va-pour liquid interfacial surface. It is a well-known fact that, for any packing, the smaller its particle size, the larger its surface : volume ratio, and the lower the HETP value. All the other factors being equal, numer-ous available data tend to indicate that the expected reference packing HETPo may be correlated as
fol-lows:
HETPo"Kp/Fpf [14]
whereFpis the packing factor. The constantsKpand
Table 7 HETP correlation factors for a reference system, re-gressed by the authors for eqn [14]
Packing Constant Kp Exponent f
Structured packings
Sulzer Mellapak威 126 0.73
Koch Flexipac威 100 0.69
Koch}Glitsch Gempak威 120 0.76
Average of above structured packings
106 0.70
Random metallic packings
Koch}Glitsch CMR威 73 0.43
Norton IMPT威 198 0.69
Pall Rings 250 0.69
[image:14.568.37.530.378.697.2]Average above random packings 110 0.50
Figure 14 HETP vs. loads. (Courtesy of Sulzer Chemtech.) System properties Numerous investigations have tried to correlate experimental HETP data with the distillation systemSuid physical properties. The best and most consistent correlations tend to conRrm that the HETP is proportional to reference HETPo
and a factor proportional to the system physical
properties:
HETP"HETPo(/Sg)n/(/Sg)n0 [15]
when the n exponent best Rt is between 0.15 and 0.21. Replacing HETPofrom eqn [14] into eqn [15],
and using the reference system we obtain:
HETP"(2.0Kp/Ffp) (/Sg)0.2 [16]
In addition, theoretical considerations suggest that the HETP is related to "m/(L/V), the ratio of the slopes of the equilibrium line and operating line, by the correlation:
HETP" ln( )/( !1)HTU
where HTU is the height of a transfer unit. Then: HETP"(2.0Kp/Ffp) (/Sg)0.2f( ) [17]
Figure 15 Effect of number of drip points and liquid irrigation rate on maldistribution. (Permission from Chemical Engineering Progress.)
isobutane}n-butane separation. Note that although only the vapour rate appears in the abscissa, actually both the vapour and the liquid rates increase in the same proportion since the chart was developed at total reSux. All packings present similar curves in small size experimental columns. The initial HETP is high (low efRciency) owing to the low loads that result in liquid maldistribution, poor packing wetting and little interaction between the vapour and the liquid (this left section of the curve is not shown in Figure 14). Nevertheless, the HETP continuously de-creases as the loads increase. At a point, correspond-ing to the loadcorrespond-ing point of the packcorrespond-ing, the HETP becomes constant over a range of loads. This range represents the operating range of the packing. As the loads continue to increase, the HETP shows a dip corresponding to high interaction between theSuids, followed by a rapid increase in the HETP caused by recirculation of liquid within the bed. This corres-ponds to the initialSooding of the bed.
Maldistribution
Liquid maldistribution has a very large effect on col-umn distillation performance. Liquid maldistribution is originated by uneven liquidSow from the distribu-tor to the top section of the packing. Some degree of maldistribution cannot be avoided and it is related to the following factors.
Drip points density (total drip points/column cross-section area) In principle, a smaller number of drip points equates to a higher initial maldistribution. This could be solved by constructing distributors with a high number of drip points. However, there are physical and mechanical limits that make it difRcult to build distributors with more than 20 drip points ft\2. It has also been demonstrated that if the
distributor deck is not levelled, the resulting maldis-tribution effect may increase as the number of drip points is increased above an optimal number. The optimal number of drip points is related to the liquid irrigationSow as follows (Figure 15):
Liquid irrigation g)m\1)ft\2
0.25 0.5 1.0 2.0 4.0 Optimum number drip
points per square foot
5 8 13 21 32
Furthermore, the drip points themselves may create additional maldistribution if they are not evenly dis-tributed across the entire column cross-sectional area. Poor construction making holes of variable diameters or unlevelled installation of the distributor will also
induce additional maldistribution. Operational prob-lems such as plugging of the distributor deck areas will cause large sectors to be dry, thus producing a macroscopic or sectorial maldistribution.
Maldistribution and spreading factor Initial maldis-tribution produces a condition of uneven liquid/
vapourSow ratio across the column cross-sectional area. Some areas or spots are underirrigated and some are overirrigated. The column packing does spread the liquid resulting in some correction or attenuation of the initial maldistribution. The overall weighted maldistribution is attenuated better in small diameter columns than in larger columns. This is determined by the nondimensional number (Zb/CD2c), whereZbis
the bed height in feet, Dc the column diameter in
inches, andCis the spreading factor in ft)in\2units
(seeFigure 16). The spreading factor is related to the packing particle size and the liquid irrigation.
The lost column efRciency is proportional to the liquid maldistribution, and this effect is ampliRed by the number of theoretical stages required to achieve the separation.Figure 17presents a useful correlation for the calculation of the column efRciency in packed distillation columns.
Liquid distributor quality The liquid distributor in-trinsic maldistribution,Md(related to its design and
Figure 16 M vs. Zb/CD2c. (Permission from Chemical Engin-eering Progress.)
Figure 17 Efficiency vs. NTS.
measurement. The mathematical expression of the maldistribution is:
Md"100[((Li/Lav!1)2)/n]0.5 [18]
for each point area subdivision from i"1 to i"n. The following is the correlation between distributor quality and its maldistribution:
Qd(%)"100/[1#(Md/100)2] [19]
If the distributor quality is 90%, the actual measured maldistribution should not exceed 33%. A 95% qual-ity implied a maximum measured maldistribution of 23%.
Total maldistribution Additional maldistribution can originate from operational factors related to levelness and obstructions. The total initial maldis-tribution,Mo, can be calculated by:
Mo"(M2)0.5 [20]
Assuming a maximum operational maldistribution Mop"15%, and using a 90% distributor quality
(Md"33%), the total effective operating
maldis-tribution at the top of the packing is Mo"(332#152)0.5"36.2.
The effective bed attenuated maldistribution is cal-culated by the following equation:
Mbz"Mo/[1#0.16Mo(Z/CD2c)] [21]
With this Mbz value, the bed efRciency Ez may be
obtained from Figure 17. The calculated bed efR cien-cy should be used to correct the packing HETP and obtain the bed operating HETPop:
HETPop"HETPEz/100 [22]
HETPop"[(2.0Kp/Ffp)(/Sg)0.2f( )]Ez/100.
[image:16.568.81.488.421.688.2]The bed effective number of theoretical stages can be calculated by:
NTS"Z/HETPop. [24]
For a column requiring more than 10 NTS, it is in general advantageous to subdivide the packing in two or more beds and limit the NTS per bed to around 10. The lower the NTS per bed, the higher the resulting bed efRciency. The limiting factor of subdividing the column into a large number of redistributed beds, is the extra column height (or the effective packed height loss for column revamps) necessary to accommodate each redistributor, and the resulting increased cost. For new columns, the optimal number of beds is the one that results in the required performance at minimum cost, for revamps, it is often the one that results in the maximum available overall NTS. The best choice in each case is determined by an optimization.
Future Developments
With the ability to accurately design and predict the performance of packings in distillation, it is expected that the use of packings in distillation will become better accepted, not only for plant revamps but also for grass roots applications. The design and evalu-ation of liquid distributors needs to be better under-stood by users and equipment manufacturers; stan-dard methods for distributor quality rating should be implemented based on the basic concepts presented in this contribution. Readers interested in further ex-ploring the column design methods outlined in this article may download a free demo of BDSIM at url http://www.geocities.com/&combusem/
BDSIM.HTM
Nomenclature
Ac Column cross-sectional
area
ft2
P Packing pressure drop in ft\1
C Packing spreading factor ft in\2
Co OriRceSow coefRcient
C1, C2, C3 Constants in pressure drop
correlations
d OriRce diameter in
Dc Column diameter in
Ez Bed efRciency %
Cs Vapour capacity factor,
deRned by
Cs"ug(g/(l!g))0.5
ft s\1
g Gas density lb f\3
l Liquid density lb f\3
ug Vapour velocity ft s\1
h Liquid head over
distributor oriRce
inches of liquid hd Vapour pressure drop
across
liquid distributor
inches of liquid G VapourSow mass velocity lb ft\2h\1
Gf VapourSow mass velocity
(in Robbins equation)
lb ft\2
V VapourSow lb h\1
L Liquid massSow lb ft\2h\1
Lf Liquid massSow lb ft\2h\1
Li Liquid mass Sow at point i gallons
min\1ft\2
Lav Liquid average massSow gallons
min\1ft\2
Fp Packing factor
Kp HETP correlation factor
n Number of measured points (in distributor testing) HETP Height equivalent of a
theoretical plate
in HTU High of a transfer unit in
l Liquid viscosity cP
Sg Liquid speciRc gravity
X Flow factor" (L/G) (g/l)0.5
Y VapourSow parameter. At
SoodingY"Yf
Yf,YHf Flooding parameters,
deRned by eqns [10] and [11]
a Packing surface area ft2ft\3
a0 Open area of one drip point
Relative volatility
Void fraction
Surface tension dynes cm\1
gc Gravitational constant 32.2 ft s\2
NTS Number of theoretical stages
R ReSux ratio
Rm Minimum reSux ratio
Md Maldistribution originated
by the distributor design % Mo Total initial maldistribution%
Mbz Effective bed
maldistribution
%
Q LiquidSow gallons
min\1
Qd Distributor quality %
Zb Bed height ft
Kinematic viscosity constant"l/Sg
See also: I/Distillation: Historical Development; Model-ling and Simulation; Theory of Distillation; Tray Columns: Performance; Tray Columns: Performance; Vapour-Liquid Equilibrium; Correlation and Prediction; Vapour-Liquid Equilibrium: Theory.
Further Reading
Bonilla J (1993) Don’t neglect liquid distributors.Chemical Engineering Progress83(3): 47.
Eckert JS (1961)Chemical Engineering Progress57(9): 54. Fair JR and Matthews RL (1958)Petroleum ReTner37(4):
153.
Klemas L and Bonilla J (1995) Accurately assess packed-column efRciency. Chemical Engineering Progress
91(7): 27.
Kister HZ (1992) Distillation Design. New York: McGraw-Hill.
Leva M (1954) Chemical Engineering Progress 50(10): 51.
Lobo WEet al. (1945)Transaction of the American Insti-tute of Chemical Engineers41: 693.
Robbins LA (1991)Chemical Engineering Progress, May, p. 87.
Sherwood TK, Shipley GH and Holloway FA (1938) Indus-trial and Engineering Chemistry30.
Strigle RF Jr (1994)Packed Tower Design and Applica-tions. Houston: Gulf Publishing.
Strigle RF Jr and Rukovena F (1979)Chemical Engineering Progress75(3): 86.
Zenz FA (1953)Chemical Engineering, August, p. 176.
Pilot Plant Batch Distillation
M. A. P. de Carvalho and
W. R. Curtis, The Pennsylvania State University, PA, USA
Introduction
Laboratory distillation encompasses an operating range from millilitres in bench-top devices to pilot units with the capacity for producing several hundred kilograms of product per day. While the design of bench-top assemblies is generally geared towards the achievement of a speciRed purity grade of the desired product, quantitative predictions are not usually feas-ible for such equipment and their construction relies a great deal on ingenuity and craftsmanship. For dedicated applications, glassware companies offer off-the-shelf equipment. This article will therefore focus on the pilot-scale units, where the analytical principles of mass and heat transfer can be applied to the operation, design and optimization of the equipment.
The section on theory presents analytical descrip-tions of batch distillation for three different ap-proaches in order of decreasing complexity. It starts with a comprehensive model for a nonadiabatic, non-zero hold-up, nonconstant molar overSow, nonideal multicomponent column. The second model present-ed neglects stage hold-ups and assumes adiabatic stages and constant molar overSows to arrive at a set of equations describing the transient behaviour of the equipment, which can be solved for a binary system using a simple spreadsheet. If constant relative vola-tility and operation at minimum reSux are further
assumed, the derivation of a third model is possible, where the transient states within the equipment are given by direct analytical expressions.
The design of a batch column can be a challenging task because batch distillation presents unique con-siderations that are not addressed in most of the available literature, which is concerned with continu-ous operation. The section on design is a collection of advice and criteria for the design of batch columns. SpeciRc information is given about equip-ment for batch distillation and accompanying instru-mentation and safety circuitry. Details are drawn from a pilot-scale column that is installed in Penn State University’s Department of Chemical Engineer-ing. The section on column operation extends the scope of the two preceding sections by providing information on establishing operating strategies and operating protocols for batch runs. Much of this information is based on hands-on experience ac-quired with the column described in the subsection on equipment.