Table 3 Dielectric constant of solvents at 253C
Solvent Dielectric constant
Water 78
Nitrobenzene 35
Methanol 33
Ethanol 24
Ammonia 17
Hydrogen sulfide 9 (at!853C)
Benzene 2
Carbon tetrachloride 2
Cyclohexane 2
and agglomerating before dissolving, then it is likely that the dissolution will be fast. This is an area which requires further investigation.
MAE extractions of polymers have not been re-ported as much as SFE and PFE extractions, but those that have indicate very rapid extractions. In some cases, the most time-consuming part is the cooling of the vessels before opening. The advantages over PFE are more rapid heating and no possibility of blocking the transfer lines. The disadvantages are a more lim-ited choice of solvents and longer cooling down times. SFE, PFE and MAE offer distinct advantages over conventional extraction methods, but at higher initial cost. The particular method chosen will depend on the exact requirements for extractions in the indi-vidual laboratory.
See also: II /Extraction: Microwave-Assisted Extraction; Supercritical Fluid Extraction. III /Microwave-Assisted
Extraction: Environmental Applications. Pressurised Fluid Extraction: Non-Environmental Applications.
Further Reading
Barton AFM (1983) Handbook of Solubility Parameters and Other Cohesion Parameters. Boca Raton: CRC Press.
Barton AFM (1990)Handbook of Polymer}Liquid Interac-tion Parameters and Solubility Parameters. Boca Raton: CRC Press.
Clifford AA (1999)Fundamentals of Supercritical Fluids. Oxford: OUP.
Dean JR (1993) Applications of Supercritical Fluids in Industrial Analysis. Boca Raton: Chapman and Hall.
McHugh MA and Krukonis VJ (1994)Supercritical Fluid Extraction,Principles and Practice, 2nd edn. Stoneham: Butterworth Heinmann.
Taylor LT (1996) Supercritical Fluid Extraction. New York: John Wiley and Sons.
Vandenburg HJ and Clifford AA (1999) Polymers and polymer additives. In: Handley AJ (ed.) Extraction Methods in Organic Analysis. ShefReld: ShefReld Aca-demic Press.
Vandenburg HJ, Clifford AA, Bartle KDet al. (1997) Ana-lytical extraction of additives from polymers.
Analyst122: R101}R115.
Wenclawiak B (1992)Analysis with Supercritical Fluids:
Extraction and Chromatography. Berlin: Springer-Verlag.
Westwood SA (1993)Supercritical Fluid Extraction and its use in Chromatographic Sample Preparation. Boca Raton: Chapman and Hall.
POLYSACCHARIDES
Centrifugation
S. E. Harding, University of Nottingham,
Leicestershire, UK
Copyright^ 2000 Academic Press
Polysaccharides are, as their name implies, polymers of saccharide residues. The general formula of saccharide or carbohydrate residues is often quoted as (CH2O)n, although this is an oversimpliRcation
which needs to be modiRed in many cases to take into account, e.g. amino, sulfate and phosphate groups. Most saccharide residues are Rve or six membered
ring structures with one member of the ring being oxygen.
pro-teins. Analytical centrifugation is also being used as an alternative to rheological methods for investigat-ing the structure of polysaccharide gels. Analytical centrifugation is well suited for the analysis of poly-disperse materials and (apart from density gradient methods) does not involve another separation medium.
The aim of this article is threefold:
1. to survey brieSy the types of information that can be obtained about polysaccharide systems by ana-lytical centrifugation;
2. to describe those aspects of the equipment that are of particular relevance for obtaining this informa-tion;
3. to describe the types of experiments used to obtain this information.
The centrifugation methods applied to macro-molecules are termedultracentrifugation, because of the high rotor speeds (up to 60 000 rpm) required to produce sedimentation or a measurable concentra-tion redistribuconcentra-tion. At these high speeds the rotor needs to be in a vacuum chamber to avoid friction-heating effects. An analytical ultracentrifuge is an ultracentrifuge equipped with a special optical system for monitoring the sedimentation process.
Despite the fact that Svedberg, who won the Nobel Prize in 1926 for inventing the analytical ultracen-trifuge, and his PhD student Gralen both conducted extensive work on the ultracentrifugation of polysac-charides, it is only relatively recently that the tech-nique has been more widely utilized for the study of these substances.
Measurable Parameters
Molecular Weights and Heterogeneity
One of the most fundamental pieces of information describing a macromolecule is its molecular weight, M.M values for polypeptides can usually be evalu-ated without difRculty from chemical sequence in-formation. For polysaccharides this is not the case, primarily because of their heterogeneity due to poly-dispersity and also, in some cases, self-association phenomena. An average molecular weight, usually the weight average,Mw, is normally speciRed.Mw is
usually available to better than $10% from sedi-mentation equilibrium in the ultracentrifuge, and Mz to somewhat less precision depending on the
optical detection system employed. In some circum-stancesMn can also be measured, although osmotic
pressure is a more appropriate technique. The ratios of thezaverage molecular weight,MztoMworMwto
the number-average,Mnare used as indices for
poly-dispersity, popular with commercial manufacturers of polysaccharides as a measure of the narrowness of a molecular weight distribution.
Direct molecular weight distributions are more dif-Rcult to obtain with centrifugation procedures and depend on assumed models (Gaussian, log-normal etc.): nowadays size exclusion chromatography sys-tems coupled online to multi-angle light-scattering systems, or SEC-MALLS are much more common, but the ultracentrifuge still provides a valuable check on theMworMz.
A good indication of chemical heterogeneity (e.g. purity) of a saccharide system can be provided by ana-lytical isopycnic density gradient ultracentrifugation.
Molecular Shape or Gross Conformation
In general two levels of information are sought:
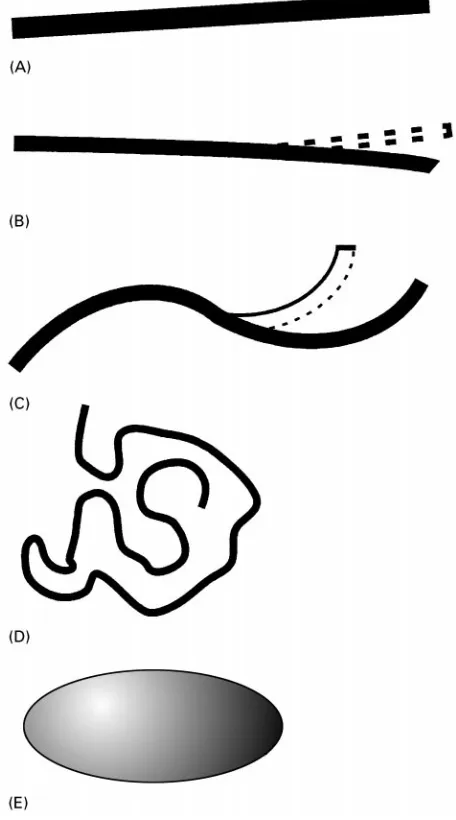
1. Delineation between the conformation type or zone of a polysaccharide, as represented by the Zonal diagram of Figure 1: extra rigid rod, rigid rod, semi-Sexible coil, random coil and globu-lar/highly branched.
2. Having established the conformation type, more quantitative information can be sought. For example, for approximately rigid structures this can be given in terms of the triaxial dimensions or shape of the molecule: for moreSexible chain-like structures the chain diameter, d, contour length L and theSexibility can be described in terms of the persistence length,Lp(Figure 2).
Water Binding or Hydration
The sedimentation coefRcient from sedimentation ve-locity experiments in the ultracentrifuge depends not only on molecular conformation but also the extent of solvent binding (chemical interactions via, for example, hydrogen bonds or just physical entrain-ment). Water binding is an important functional property of polysaccharides (for example, in foods, or as hydrogel drug delivery forms). Unfortunately, the conformation has to be known or assumed to obtain the extent of swelling through water binding: con-versely, assumptions of water binding extent are of-ten required to obtain quantitative conformation information.
Analytical Ultracentrifuges and
Polysaccharides
Figure 1 Conformation zoning of polysaccharides: (A) extra rigid rod; (B) rigid rod; (C) semi-flexible coil; (D) random coil; (E) globular or highly branched. (Reproduced from Pavlov GM, Rowe AJ and Harding SE (1997) Conformation zoning of large molecules using the analytical ultracentrifuge.Trends in Analyti-cal Chemistry 16: 401, with permission from Elsevier Science.)
Figure 2 More detailed conformation representations of poly-saccharides in solution: length and flexibility parameters for a lin-ear polysaccharide:L, Contour length; Lp, persistence length, defined as the projection length along the initial direction of chain of length L and in the limit of LPinfinity. (Reproduced with permission from Tombs and Harding 1998.)
Instruments (Palo Alto, USA), have now largely been replaced by the new generation Optima XL-A and XL-I, also from Beckman. Both have full online com-puter data capture and analysis facilities.
Optima XL-A Ultracentrifuge
This model appeared inc. 1990 and is equipped with a UV/visible absorption optical detection system. Un-fortunately, polysaccharides are generally transpar-ent in the visible and also, unlike proteins and nucleic acids, in the near UV (wavelength'240 nm). In the far UV (200}220 nm), they absorb and can therefore
in principle be detected. Unfortunately other mate-rials such as buffer salts also absorb strongly in this region and hence for many applications an absorbing chromophore must be attached to the polysaccharide. Some success has been achieved with this latter ap-proach, although possible alterations to the structure and molecular weight (e.g. a state of self-association) caused by the incorporation of the chromophore can result in measurement errors. Other polysaccharides, such as xylans and pectins, have some inherent ab-sorbance at &240}260 nm and this can be taken advantage of.
Optima XL-I Ultracentrifuge
This model appeared inc. 1996 and, in addition to the UV/visible absorption optics of the XL-A, has a refractometric optical system known as Rayleigh interference optics. This optical system can be applied to proteins, nucleic acids and polysaccharides. One drawback for sedimentation equilibrium (molecular weight) work is that, because of the upper limit of &12 mm of the optical path length of the centrifuge cell, the lower limit for the concentration of the polysaccharide solution loaded into the cell is &0.8 mg mL\1. This is a major limitation for
poly-saccharides since low concentrations are necessary to minimize the effects of the large thermodynamic nonideality of these substances, compared to proteins.
Model E Ultracentrifuge
[image:3.568.295.515.516.644.2]current-ly available on the Optima machines, the Schlieren or refractive index gradient system, permitting high con-centrations and facilitating gel work. For molecular weight analysis, Rayleigh optics give primarily Mw,
whereas Schlieren optics yield Mz. Thus the model
E is ideal for obtaining polydispersity indices (Mz/Mw,
see above). However, because of the lack of availabil-ity of this instrument, people requiring this type of measurement need to consult the handful of labora-tories still running these instruments.
Types of Ultracentrifuge Experiment
for Polysaccharide Analysis
The principal types of measurement using the analyti-cal ultracentrifuge on solutions of polysaccharide are:
E Sedimentation equilibrium: for obtaining the weight average molecular weight, Mw, and the
zaverage molecular weight,Mz. Molecular weights
are conventionally expressed in daltons or in molar mass units (g mol\1). The thermodynamic
second virial coefRcient, B (mL mol\1g\2) can
also be measured.
E Sedimentation velocity: for obtaining the sedi-mentation coefRcient,s(measured in seconds (s) or svedbergs (S), where 1 S"10\13s) and the
con-centration dependence or Gralen parameter ks(mL g\1) of the sedimentation coefRcient. Both
sandkscan be used to obtain conformation, water
binding and molecular weight information.
E Boundary spreading experiments: for obtaining the translational diffusion coefRcient,D(cm2s\1) and
its concentration dependence parameter, kD(mL g\1). The polydispersity of polysaccharides
is however a major complicating factor.
E Analytical isopycnic density gradient ultracentrifu-gation: primarily used for assaying the purity of a polysaccharide preparation on the basis of density.
In addition, sedimentation velocity and equilibrium can be used to probe the structure of gels, primarily through measurement of the swelling pressure of the gel, and also the mobility/diffusion of molecules through gels or incompatible mixed-phase systems.
Sedimentation Equilibrium of
Polysaccharide Solutions
In this method the ultracentrifuge is spun at a speed sufRciently low (for example, &10 000 rpm for a pectin polysaccharide ofMw&200 kDa) that the
cen-trifugal force is comparable to the back-force due to diffusion. The distribution of the polysaccharide in the centrifuge cell is recorded using Rayleigh optics
and equilibrium is typically established between 24 and 48 h. Attainment of equilibrium is assessed by comparing optical records taken at 4}8 h intervals. The time required to attain equilibrium depends on the polysaccharide and the length of solution column in the centrifuge cell: a 3 mm column requires &0.1 mL for a 12 mm optical path length cell (XL-I or Model E) or&0.25 mL for a 30 mm cell (Model E only). Shorter columns take less time but yield less precise information. The length of time of an experi-ment can be compensated for by running samples in multiples using multi-hole centrifuge rotors and/or multi-channel centrifuge cells.
Molecular Weight Determination
The simplest interpretation of the optical records from a sedimentation equilibrium experiment is ob-tained from the average slope of a plot of the log of the concentration,C(r) in the cell versus the square of the radial displacement,r, from the rotor centre: such a slope yields the apparent weight}average molecular weight,Mw,app. In evaluating the average slope, care
must be taken to include as much of the distribution in the centrifuge cell as possible (from meniscus to cell base). Fortunately, software (MSTAR) is available to assist with this task. Rayleigh optics only record con-centration of solute relative to the meniscus, thus requiring the concentration at the meniscus to be determined in order to convert relative concentra-tions toC(r). After these factors have been taken into account, extrapolation of 1/Mw,app to C"0 (where
Cis the cell loading concentration) yields the recipro-cal of the weight averageMw from the intercept and,
also the second thermodynamic virial coefRcient,B, or as an alternative notationA2 from the limiting slope.
(This term also appears in osmotic pressure or static light-scattering measurements.) Correct toRrst order in concentration, this extrapolation is described by:
1/Mw,app"(1/Mw))(1#2BMwC) [1]
Herein lies a difference between proteins and polysac-charides. The nonideality term 2BMwC, which can
often be neglected at low concentration for proteins, is usually signiRcant even at low concentration for polysaccharides because of their much greater nonideality: indeed, the term 1#2BMwCrepresents
the factor by which measurement ofMw,appat aRnite
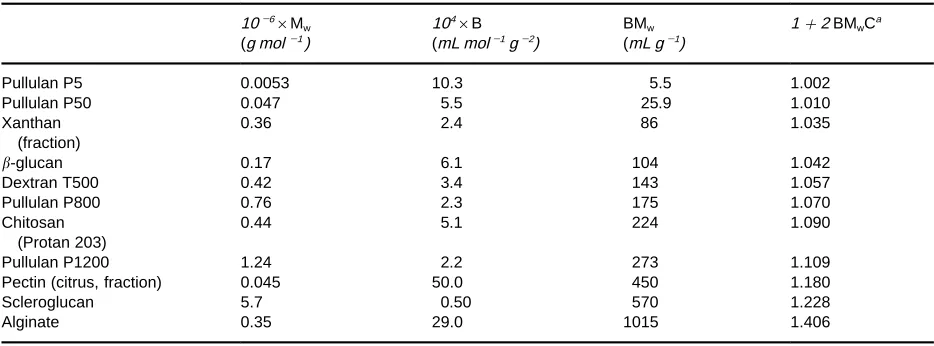
Table 1 Comparative molecular weights and nonidealities of polysaccharides from sedimentation equilibrium measurements 10\6;M
w 104;B BMw 1#2 BMwCa
(g mol\1) (mL mol\1g\2) (mL g\1)
Pullulan P5 0.0053 10.3 5.5 1.002
Pullulan P50 0.047 5.5 25.9 1.010
Xanthan 0.36 2.4 86 1.035
(fraction)
-glucan 0.17 6.1 104 1.042
Dextran T500 0.42 3.4 143 1.057
Pullulan P800 0.76 2.3 175 1.070
Chitosan 0.44 5.1 224 1.090
(Protan 203)
Pullulan P1200 1.24 2.2 273 1.109
Pectin (citrus, fraction) 0.045 50.0 450 1.180
Scleroglucan 5.7 0.50 570 1.228
Alginate 0.35 29.0 1015 1.406
aBased on the lowest possible loading concentration (&0.2 mg mL\1in a cell with a 30 mm path length centrepiece).
effects can be largely suppressed by the inclusion of a low molecular weight electrolyte to increase the ionic strength of the solution, eqn [1] is usually only valid for dilute solutions of polysaccharides and at higher concentrations, extra terms (inC2 orC3) are
necessary. In such cases direct nonlinear, extrapola-tion ofMw,apptoC"0 usually gives a better estimate
of Mw than the reciprocal (1/Mw,app) extrapolation
procedures. The other big difference between pro-teins and polysaccharides is that the latter are usually very polydisperse.
It is also possible from a single experiment to ob-tain local or point averageMw,app(r) at radial positions
r, as a function ofC(r). Extrapolation ofMw,app(r) to
C(r)"0 provides a further estimate forMw, although
because of redistribution of solute in the centrifuge cell this can yield and underestimate for Mw. From
further manipulations, including concentration extra-polations to the radial positions of the solution menis-cus and bottom of the centrifuge cell, the (apparent) z average molecular weigh Mz,app can be
ob-tained. Similar corrections to C"0 are required to obtainMz(although the factor in eqn [1] is 4, not 2).
A more precise estimate forMz,appcan be obtained if
Schlieren optics are used instead of Rayleigh optics: this is because Schlieren optics record the concentra-tion gradient, dC(r)/dr (as opposed to C(r)) versus radial displacement,r.
In cases where there may be reversible self-associ-ation phenomena, the B term in eqn [1] must be modiRed to incorporate an association term.
Sedimentation Velocity of
Polysaccharide Solutions
At higher speeds than used for sedimentation equilib-rium, sedimentation forces become well in excess
of diffusion forces and a macromolecular species will sediment. The sedimentation coefRcient,s, of a mac-romolecular component is its sedimentation rate per unit centrifugalReld. It will be a function of the size, shape and degree of water association or hydration of the biopolymer. Like the apparent molecular weight, Mw,app, it will be affected by the nonideality of the
system, and will need correcting for these effects by measuring at a series of concentrations and extrapo-lating to zero concentration to yield the ideal or inRnite dilution valueso. For polysaccharides this is
best accomplished with a reciprocal plot:
1/s20,w"(1/s20,wo ))(1#ksC) [2]
whereCis the sedimenting concentration andksis the
concentration dependence or Gralen parameter. The subscripts 20,w mean that, by convention, sedimenta-tion coefRcients measured at a given temperature are corrected using simple formulae to standard condi-tions of solvent viscosity and density: that of water at 203C.
As with eqn [1] forMw, eqn [2] forso20,wis generally
only applicable for dilute solutions of polysacchar-ides: for higher concentrations, and even for dilute solutions of certain extremely nonideal polysacchar-ides like alginate and xanthan, higher order terms in Care needed to describe adequately the concentra-tion dependence. As with Mw, where such higher
terms are necessary, direct extrapolation of s20,w to
C"0 rather than 1/s20,wis generally a more reliable
procedure for estimatingso
20,w. Bothso20,wandkscan be
used for conformation and hydration analysis, and also as a less direct alternative to sedimentation equi-librium for molecular weight estimation.
Besides the use of higher rotor speeds (for example, &50 000 rpm for a pectin polysaccharide of
so
gener-Table 2 Values of the Wales}van Holde ratioks/[] and the Mark}Houwink}Kuhn}Sakuradab coefficient for some polysac-charides
ks/[] b Conformation
Dextran fractions 0.44 Random coil
DIT-dextrans 0.56 Semi-flexible coil
Pullulans 1.4 0.45 Random coil
Yeast mannan 1.3 0.43 Random coil
-glucans 0.4 Extended
Alginates 0.6 Extended
Pectins (low methoxy) 0.2 0.17 Rigid rod
Xanthan (keltrol) 0.28 Rigid rod
AmylopectinH 1.45 Spheroidal/heavily
branched DIT, di-iodotyrosine dextran. All in aqueous solvent exceptH (90%dimethyl sulfoxide).
ally used (&1 cm corresponding to&0.4 mL of solu-tion in a 12 mm path length Optima XL-I centrifuge cell), compared with sedimentation equilibrium ex-periments.
General Conformation Analysis of Polysaccharides
The Wales}van Holde ratio A useful guide to the gross conformation is the Wales}van Holde ratio. The Wales}van Holde ratio is deRned as the ratio of the Gralen parameterksto the intrinsic viscosity [].
The intrinsic viscosity can be measured relatively sim-ply by viscometric or rheological methods, and both parameters are expressed in units of mL g\1. It is
known that this ratio has values of about 1.6 for random coils and spherical conformations and reduc-es to a limiting value of approximately 0.2 for rigid rod-shaped molecules. A proviso for the use ofksin
this way is that, for highly charged macromolecules, charge effects must be suppressed by using (aqueous) solvents of sufRcient ionic strength (Table 2).
The Mark}Houwink+Kuhn+Sakurada Representa-tion The Wales}van Holde ratio can be used to distinguish rods from either spheroidal or random coil conformations but cannot be used to distinguish between the latter two. However, advantage can be taken of the polydispersity of polysaccharides in that if the sedimentation coefRcient and molecular weights are measured for a series of fractions (separ-ated by column chromatographic procedures) of a polysaccharide preparation, then the exponent in the relation betweenso
20,w andM weight or
volume-average can be used to distinguish random coils from rods and spheroidal conformation types:
so
20,w"KMb [3]
Eqn [3] is known as a Mark}Houwink}Kuhn} Sakurada (MHKS) or just Mark}Houwink relation. Other MHKS relations exist between intrinsic viscos-ity andM(exponentaor), radius of gyration and M(exponentcor) and the diffusion coefRcient and M(exponent-). The exponentb(sometimes given as 1-b), measured from double logarithmic plots of so
20,wversusM, has characteristic values depending on
the conformation type: these are 0.67, 0.4}0.5 and 0.15 for spheres, random coils and rigid/extra rigid rods respectively (Table 2).
If K and b have been measured for a series of polysaccharide fractions, the molecular weights of subsequent preparations of that polysaccharide can then be estimated from measurement ofso
20,w.
Conformation zoning from combination of so 20,w,ks and the mass per unit length An even better guide to the overall conformation type or zone (Figure 1) can be obtained by combiningso
20,w,ksand the mass per
unit length,ML. The latter parameter must be
mea-sured using a separate technique, but a number of MLvalues for polysaccharides have been published on
the basis of electron microscopy or X-ray diffraction studies. The concept of zoning in this manner was conceived in terms of empirical data of polysacchar-ides of known conformation (Figure 3A), supported by the theoretically known limits for spheres and extra-rigid rods, to produce the characteristic diag-nostic plot ofFigure 3B.
For a polysaccharide whose conformation type or zone is unknown, from measurement of so
20,w and
ks from a sedimentation velocity experiment and
knowledge of, or an assumption concerning, ML,
the conformation zone can be read directly from Figure 3B.
More Detailed Conformation Analysis of Polysaccharides
Once the conformation type or zone has been estab-lished, more detailed information about conforma-tion can be sought. It is worth stressing that, because of the inherent polydispersity of polysaccharides, much of the information obtained can only represent average properties: claims of parameter measure-ments to a high precision should be treated with some caution.
so20,w-M relations: worm-like coil modelling The simple MHKS dependence of so
20,w on M described
[image:6.568.50.279.558.688.2]Figure 3 Sedimentation conformation zoning of polysaccharides. (A) Dependence of log (ksML) versus log [s]/MLfor 82 macro-molecules of known conformation type. (B) Corresponding diagnostic plot: for a measured [s], ksandML, the conformation of a given polysaccharide can be zoned. [s]"s320,w0/(1!vN0) where0and0are the viscosity of water at 203C and v$the partial specific volume. [s] can also be defined for other solvents, although ksmust then correspond to that solvent. (Reproduced from Pavlov GM, Rowe AJ and Harding SE (1997) Conformation zoning of large molecules using the analytical ultracentrifuge.Trends in Analytical Chemistry 16: 401, with permission from Elsevier Science.)
contour length, L), the chain diameter, d, and the persistence length,LP. As with MHKS, worm-like coil
modelling has not only been worked out for the sedi-mentation coefRcient, but also for other hydro-dynamic parameters.
The Wales}van Holde ratio, ks/[], for rigid struc-tures It has already been noted how this ratio can help to distinguish rod-shape polysaccharides from the more randomly coiled and spheroidal materials.
For approximately rigid structures, more precise in-formation about the molecular conin-formation, in terms or average ellipsoidal axial ratios, can be ob-tained without the complication of having to take into account molecular hydration, since this is essen-tially eliminated in the ratio. Detailed relations are available betweenks/[] (referred to for simplicity by
structures. For polysaccharides this procedure would not be applicable toSexible coils, but may be applic-able to rod-shaped or highly branched structures (zones A, B or E molecules of Figure 1):kshas
how-ever been mainly applied in this way to protein sys-tems, and not polysaccharides.
so
20,w and the frictional ratio In addition to ks/[],
the sedimentation coefRcientso
20,w, can also be used
directly to extract the axial ratios of a quasi-rigid structure. Knowledge ofso
20,w, together with the
mo-lecular weight and other parameters (density0 and
viscosity 0 of water at 20.03C) yields the particle
frictional parameter known as the translational fric-tional ratiof/f0. This in turn can be related to a shape
parameter known as the Perrin function,P, and swell-ing ratio, Sw, deRned as the ratio of the volume of
a macromolecule swollen through hydration to that of the anhydrous macromolecule:
f/f0"P)S1w/3 [4]
Thus, ifSwis known or assumed, the shape parameter
P can be found and from this the axial ratios from rigorous hydrodynamic relations. Besides complica-tions through molecular Sexibility, the stumbling block isSw. Whereas for proteins,Swwill be moderate
(&1}2) and predictable to a certain degree, for poly-saccharides this will not be so. In fact, eqn [4] is more useful from a polysaccharide context for predicting Sw, since, despite the presence of the cube root term,
f/f0 is still essentially a more sensitive function of
swelling than shape.
Measurement of Water Binding or Swelling RatiosSw
It has been shown how measurement of the frictional ratio (viaso
20,w) can be used to estimateSw, the
swell-ing ratio. For a rigid structure, if the shape is estab-lished from measurement of ks/[], then P can be
deRned and henceSw found from eqn [4].
For more general structures, another route that has been suggested, applicable to both rigid andSexible structures, is to use the ratio of the concentration dependence term for viscosity (kE) toks:
Sw&kE/ks [5]
k
E (mL g\1) comes from the analogous relation of
eqn [2] for viscosity:
red"[](1#kE)C)
wherered(mL g\1) is the reduced viscosity at
concen-trationC.
Diffusion Measurements
One of the classical ways of measuring translational diffusion coefRcients,D, is to use the optical system on the ultracentrifuge to follow the time-dependent spreading of a layered boundary between a macro-molecular solution and its solvent: if a rotor speed is employed, large enough to stabilize the system but low enough so as to minimize appreciable sedimenta-tion, measurement of boundary height and width changes with time can be used to measure D. The diffusion coefRcient itself can be corrected to stan-dard conditions of temperature and solvent viscosity (water at 20.03C) to giveD20,w, and extrapolated to
zero concentration to giveDo
20,w and the
concentra-tion dependence parameter kd (mL g\1). Do20,w
com-bined withso
20,win the Svedberg equation can be used
to estimate the molecular weight. Alternatively Do
20,wprovides a different route toso20,wfor obtaining
the frictional ratiof/f0.
Although measurement of Do
20,w in this way is
highly reliable for many protein systems, there are problems with polysaccharides, again deriving from polydispersity: indeed, this application of the ultra-centrifuge has now largely been superseded by dy-namic light-scattering methodology.
Analytical Density Gradient
Centrifugation
Density Gradient Sedimentation Equilibrium
By dispersing the polysaccharides in a dense salt solu-tion, a density gradient can be created in an ultracen-trifuge cell. For a mixed macromolecular solute a particular macromolecular species will move or band at that region in the density gradient which corresponds to it own density: this procedure is known as density gradient or isopycnic (isodensity) sedimentation equilibrium. Normally, caesium salts are used to provide this gradient for polysaccharides. Since most polysaccharides have similar densities (or partial speciRc volumes), this is not very good for separating mixed polysaccharide systems, but is, however, useful for separating polysaccharides from glycoproteins or proteins. It has, for example, been recently used to assay the purity of xylans from other molecular contaminants. The method assumes no sig-niRcant interaction between the caesium salts and the polysaccharide.
Density Gradient Sedimentation Velocity
assumes no interaction between the solute and the macromolecule. However, since the sedimentation coefRcients are usually very small (often between 1 and 2 S) }because of their large frictional ratios }and because of potential interactions with the separ-ating medium, this method has not found major use for polysaccharide analysis or separation.
Polysaccharide Gels: Swelling
Pressure
Sedimentation Equilibrium
If a gel is subjected to a centrifugalReld, low enough to avoid sedimentation of the gel itself (typically( 10 000 rpm), a concentration gradient will be estab-lished as in a conventional sedimentation equilibrium experiment on a solution. The gradient indicates the locally dependent de-swelling of the gel, which is caused by the swelling pressure generated by the centrifugalReld. The concentration gradient will de-pend on the structure of the gel (number and strength of the cross-links) and whether the gel is reversible or not.
Sedimentation Velocity
At sufRciently high rotor speed ('10 000 rpm), the polymer concentration may drop to a sufRciently low level near the meniscus that a sol phase will appear: a conventional sedimentation velocity experiment can be performed, monitoring the movement of the boundary between gel and sol.
Data from sedimentation equilibrium and sedi-mentation velocity can be used to obtain the thermo-dynamic, elastic and structural parameters of the gel, complementing data from classical rheological ap-proaches. Although gelatin has been the main focus of attention with this technique, several
polysacchar-ide gels have been successfully characterized, such as carrageenan, pectin and alginate.
See also: II / Particle Size Separation: Theory and Instrumentation of Field Flow Fractionation. III /
Polysac-charides: Liquid Chromatography.
Further Reading
CoKlfen H (1998) Analytical ultracentrifuge technologies for the characterization of biopolymer gels and microgels.
Biotechnology and Genetic Engineering Reviews 16: 87}140.
Harding SE (1995) Some recent developments in the size and shape analysis of industrial polysaccharides in solution using sedimentation analysis in the analy-tical ultracentrifuge. Carbohydrate Polymers 28: 227}237.
Harding SE, Rowe AJ and Horton JC (eds) (1992) Analyti-cal Ultracentrifugation in Biochemistry and Polymer Science. Cambridge: Royal Society of Chemistry. Lavrenko PN, Linow KJ and GoKrnitz E (1992) The
concen-tration dependence of the sedimentation coefRcient of some polysaccharides in very dilute solution. In: Hardi-ng SE, Rowe AJ and Horton JC (eds)Analytical Ultra-centrifugation in Biochemistry and Polymer Science, pp. 517}548. Royal Society of Chemistry. Cambridge. Pavlov GM (1997) The concentration dependence of
sedi-mentation for polysaccharides. European Biophysical Journal25: 385}397.
Rowe AJ (1992) The concentration dependence of sedi-mentation. In: Harding SE, Rowe AJ and Horton JC (eds)Analytical Ultracentrifugation in Biochemistry and Polymer Science, pp. 394}406. Cambridge: Royal Society of Chemistry.
Schachman HK (1959)Ultracentrifugation in Biochemis-try. New York: Academic Press.
Svedberg T and Pederson O (1940)The Ultracentrifuge. Oxford: Oxford University Press.
Tombs MP and Harding SE (1998)Introduction to Poly-saccharide Biotechnology. London: Taylor and Francis.
Liquid Chromatography
J. M. MateHs and C. PeHrez-GoHmez, University of
Ma&laga, Ma&laga, Spain
Copyright^ 2000 Academic Press
Introduction
Separation, analysis and molecular weight distribu-tion are very important for the characterizadistribu-tion of polysaccharides in biochemistry, microbiology, agri-culture and the food industry. During biosynthesis, a large range of components of different molecular
weight are formed. Gas chromatography (GC) can be used for the analysis of very complex polysaccharide mixtures whereas high performance liquid chromato-graphy (HPLC) is preferred for simple polysaccharide mixtures and for puriRcation.

![Table 2Values of the Wales}van Holde ratio ks/[�] and theMark}Houwink}Kuhn}Sakurada b coefficient for some polysac-charides](https://thumb-us.123doks.com/thumbv2/123dok_us/944259.607455/6.568.50.279.558.688/table-values-themark-houwink-sakurada-coefficient-polysac-charides.webp)

