TECHNICAL SERIES No.3 August 1987
Consistent Trade Data for Ireland
by
John D. FitzGerald
The Economic and Social Research Institute
4 Burlington Road Dublin 4 Ireland1. Introduction
This paper describes the sources for the data used in the paper The Determinants
of Irish Imports, FitzGerald, 1987. The two major sources used were the National
Accounts data for Ireland, taken from the Department of Finance Databank, and the
CSO Trade Stati.stics. The transformations needed to produce consistent series
are described in this paper and all the data are given in 20 tables at the back of the
paper. Each table gives the data together with a mnemonic (generally the mnemonic
used in the Department of Finance Databank) for each series. In footnotes it gives
the source of the series and the formula used to generate it from other series. (The
description of the way in which the generated series were derived uses the mnemonic
for each series rather than the full name.)
2. Data Sources and Generation
As described in Chapter 3 of FitzGerald, 1987, the national accounts data
for Ireland needed a certain amount of transformation to provide consistent time
series for the required period. The data prior to 1970 had to be converted to
constant 1975 prices~ This was done by multiplying the pre-1970 data, derived
from the latest issue of NIE in which they appeared (NIE75), by the ratio for 1970
of the NIE 1970-1982 value of the series to the NIE75 value. In each case the
linking of the series was carried out at the most disaggregated level published in
NIE82 and the resulting series have been summed to produce the relevant subtotals
and totals. For example, the personal consumer expenditure· figure in Table A. 5
of NIE82 is the total of the linked series for the components of consumption shown
by setting Yt
=
o.
75 Xt + 0. 25 Xt_1 where Yt is the new observation for year t and
X is the financial year ser'ies. Details of these and other adjustments are given in
FitzGerald and McQuaid, 1983, and in successive editions of the Department of
Finance databank document.
The methodology for deriving the capital stock series involved taking a
starting value for 1952 from Vaughan, 1980. Using the investment data, and an 8 per
cent depreciation rate, the capital stock was derived according to the formula
K
=
(1-d) K +I where Kt is the capital stock in year t. The depreciation ratet t-1 t
was chosen on the basis of an average 10 per cent depreciation rate for machinery
and equipment and 5 per cent for buildings, using the weights of these two capital
g>ods in the capital stock. The cost of capital in manufacturing industry was derived
according to the methodology set out in FitzGerald 1983. It assumed a weighted average
of the export and other industries rates of corporation tax. It assumed a constant
geometric rate of depreciation of 8 per cent (consistent with the generation of the
capital stock data) and it used actual interest rates. (Honohen and Flynn, 1984, used
a fixed real rate of interest of 2 per cent.) It did not take account of the effects of
leasing or of the tax shield due to depreciation allowances or allowances for interest paid.
The trade data produced by the CSO needed substantial adjustment to produce
consistent series suitable for use in this study. For the years 1960-1964, to arrive
at consistent data on a gross flow basis, an estimate of imports by the Shannon Free
Airport zone (which were always less than exports by the zone) and imports of other
transport receipts, must be added to the unadjusted total export and total import figures
3
Estimates of Shannon trade on a gross flows basis were used for the years 1961 to 1964.
For years prior to 1961 i"!O such data were available. Instead a constant compound
growth rate in both imports and exports was assumed between 1947 and 1961, assuming
a base figure for both imports and exports in 1947 of £0.1 million. The arbitrary nature
of this assumption is particularly serious for the 1950s data. However, as the data used
in this study begin in 1960, only one year's interpolated data is involved and the crude
..
nature of the assumptions should not be too serious. In any even~ the estimated Shannon.
adjustment in 1960 only amounts to about 0. 35 per cent of total exports and . 3 per cent
of imports.
In the case of the transportation receipts imports, they are assumed to grow
at the same rate as did the values of net transportation receipts exports for the years
prior to 1965. In this case the adjustment represents a considerably greater proportion
of total imports and exports .fn 1960 than does the Shannon adjustment for that year:
about 2 per cent of total exports and about 1. 7 per cent of total imports.
For the years after 1964 the breakdown of the current price imports and exports
figures, on a balance of payments basis, into merchandise and services trade is available
in the National Accounts. For years up to and including 1964 the merchandise trade
figures were derived by taking.the trade statistics data on merchandise trade and making
certain adjustments, which are set .out below. From the trade statistics imports figures
must be deducted figures for impo~ts into the rest of the State from Shannon, imports
of cinema films and temporary transactions. To the resulting figure must be added
imports of coins and bullion and the estimate, described above, of imports from abroad
into Shannon. The trade statistics merchandise export figure is adjusted to a balance
of payments basis by deducting exports from the rest of the State to Shannon and temporary
· exports and adding exports of coin and bullion and exports from Shannon to the rest of
the world. With the exception of the f!gures for Shannon trade (with the rest of the world)
from the adjusted figures for total imports and exports. The resulting estimate fcir
invisible trade in the early 1960s is likely to be more unreliable than that for merchandise
as all of the errors, due to the estimation of the relatively large transport receipts item,
will be concentrated in it.
The constant price data in the National Accounts for total imports. and exports
suffer from the same discontinuity, due to netting of trade from Shannon and of transport
receipts, as do the current price data. The. CSO supplied series, for years prior to 1965,
on a similar discontinuous basis for merchandise trade at constant prices. Similar data
for total trade were available in the National Accounts. These series were linked to give
one series at constant 1975 prices.
As the same discontinuity due to netting of certain items pre-1965 applied to the
unadjusted volume and value series it was possible to use them to give an index of the
price deflators for total and merchandise trade. These same deflators were then applied
to the adjusted trade figures to give adjusted total and merchandise trade at constant 1975
prices. Services imports and exports at constant prices were then derived as a residual
and they were themselves used to derive the price 4eflator for adjusted services imports
and exports. These adjusted figures are so constructed that they do not significantly affect
either the balance of payments figures or the growth rates for years prior to 1965. They
can, therefore, be used in conjunction with other national accounts figures. Further details
of this exercise are given in FitzGerald, 1979 •.
For the purpose of the study of the determinants of imports, it is important to
dis aggregate the merchandise trade statistics into a number of components. There are
two problems with doing this: first the only data available are on a trade statistics basis
and, second, there are considerable problems with deflators. In the case of imports the
5
SITC categories. This has obvious attractions, giving a clearcut distinction between
imports which should be modelled according to the theory of the firm, and imports, entering
directly into final demand, which should be modelled according to consumer theory;
However, appropriate price deflators are not available on a similar basis. The old
wholesale p:r;ice indices which covered this breakdown of imports were discontinued
because of their totally unsatisfactory nature. (Their·weights were based on trade
in 1952). In addition, while data have been published over the relevant period breaking
down the value of imports by use, these data do not provide a continuous consistent
series. There have been frequent changes in the categories of goods treated as consumer
goods, materials for further production or producers' capital goods. These changes ha.ve
not been signalled by the CSO and it is not possible, on the basis of available data, to
create a consistent set of series for the period 1960-82. -·---·-·---·.···· "··-···· ·-'"'"·~··---···-... .
The first change, at 1962, involved a reclassification fro!:h SITC 9 to SITC
0 of temporary livestock imports. From 1973 onwards these imports were totally
excluded from the trade statistics. Fortunately, the data are available to allow this
item to be excluded from SITC items
p
or" 9 for the full period 1960 to 1972. Adiscontinuity between 1965 and 1966 arises from the inc lt1s ion of Shannon imports on a
'
gross flow basis. This affected SITC categqry 9. The· discontinuity in 1'972 arose from
the reclassification of temporary irhports (excluding livestock) from SITC 9 to the
relevant category used for total imports. There are also some additional minor changes
in the classification system. In 1977 there was a further change in the classification
system and no data are available to allow the series to be linked at that year. The
combined effects of these problems have their greatest impact in percentage terms on
categories SITC 2 and 4 combined. They have little or no effect on SITC 3. In using
the data for estimation. the vaiue of imports in categories 5 to 9 is derived residually
as the value of adjusted merchandise imports, taken from the National Accounts, less
I
·'··,···
• ' ' .. ~ .. ! i .,
The value series for agricultural exports in the trade statistics is only
available on
a:
consistent basis from 1962 onwards. Due to definitional changes, acontinuous series covering the years 1960-1982 d to be generated by linking the old
basis SITC zero figures for 1960-62 to the new b~sis agricultural exports from 1962
onwards. The resulting series for agriculturalexports on a trade statistics basis had
to be adjusted for intervention transactions and smuggling from 1973 onwards to bring
them to a balance of payments basis. This involved subtracting from the trade
statistics figures exports of agricultural produce which are sent into intervention storage
abroad and adding back sales from intervention storage abroad of goods stored there by
the Irish intervention agency. The resulting balance of payments adjusted figure for
agricultural exports is deflated by the price index for agricultural exports (SITC 0 and 1)
to give a series at constant 1975 prices. These value and volume series for agricultural
exports are subtracted from the relevant merchandise exports figures to derive
residually current and constant price figures for non-agricultural exports on a balance
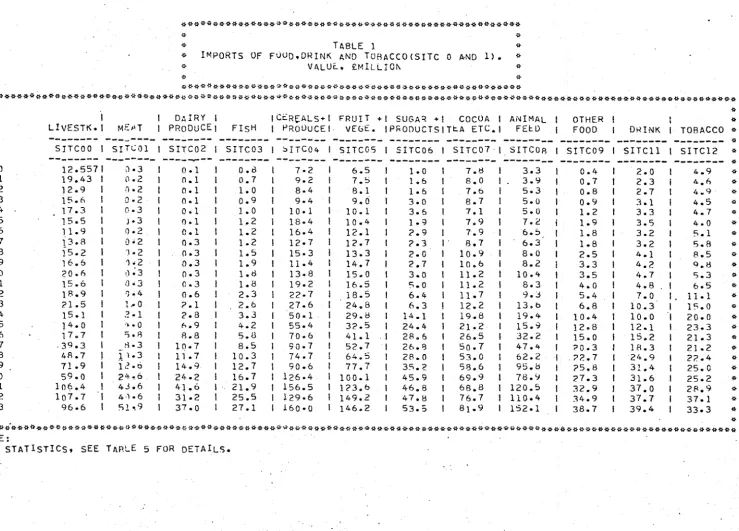
******************************~***********************
*
*
* TABLE 1 *
* IMPORTS OF F000.DRINK AND TORACCO<SITC 0 ~NO 1) • *
* VALUC.. £MILLI0t\ *
*
*
******************************************************
**************************************************************************************************************************
* *
* I I DAIRY I ICi::R~ALS+I FRUIT +I SUGA=! +! COCOA I ANIMAL I OTHER I I *
* LIVESTK. I ME~-'T I PRoDuCE! FisH I 1-'RQUUCE f. VEGE. IPRODUCTSIT~A ETC.! F El:l) I FOOD I DRINK I TOBACCO o
* --- --- --- --- --- --- --- --- --- --- --- --- * *
s ncoo
Is rrc o
1 I SITC02 I SITC03 I ::.rrco4 I SITC05 I S ITC06 I SITC07 ·I SITCOR I SITC09 I SITCll I SITC12 *-~
---~-- --- --- --- --- --- --- --- --- --- *
* 1Q60 12.5571 \l•3 I
o.l
Io.a
I 1·2 I 6.5 I leO I 7.!3 I 3.3 I 0.4 I 2.0 I 4.9 ** 1961 19.43 I
o.z
I n.l I 0.7 I 9.2 I 7.S I 1.6 I 8.0 I 3.9 I 0.7 I 2.3 I 4.f. **
1962 12.9 I 0·2 l o.l I 1.0 I 8·4 I 8.1 I 1·6 I 7.6 I 5.3 Io.s
I 2.7 I 4w9 ** 1963 15.6 I 0·2 I 0·1 I 0.9 I 9·4 I 9.0 I 3.0 I 8.7 I 5.o I 0.9 3.1 I 4.5 *
* lQ64 17.3 1 0·3 I o.1 I 1.0 I 10 ol I 10.1 I 3.6 I 7.1 I s.o I 1. 2 3.3 I 4.7 *
*
1%5 15.5 I J. 3 I Ool I 1.2 I 18·4 1 10.4 I 1·:) I 7.9 I 7.2 i 1.9 3.5 I 4.0 ** 1966 11.9 I 0·2 I o.1 I 1.2 I 16.4 I 12.1 I ?.9 I 7.9 I 6.:) I 1.8 3.2 I ~.1 *
* 1967 13.8 I 0•2 I o.3 I 1.2 I 12·7 I 12.7 I ?.3 I. 8.7 I 6.3 I 1.8 3.2 I 5.8
*
*
1968 }5.2 I .) • 2 I 0·3 I l. 5 I 15·3 I 13.3 I 2-0 I 10.9 Is.o
I 2.5 4.1 I 8.5*
*
1969 16.6 I ') ·2 I 0.3 I 1.9 I llo4 I 14.7 I 2.7 I 10.6 I 8.2 l 3.3 4.2 I 9.8 ** 1C7() 20.6 I t); 3 I o.3 I 1. d I 13·8 I 15.0 I 3.0 I 11.2 I 10.4 I 3.5 4.7 I 5.3
*
* 1971 15.6 I 0•3 I ().3 I 1. 8 I 19·2 I 16.5 I ~. 0 I 11.2 I 8.3 I 4.0 4.8 I 6.5 *
*
1972 18.9 I 1)~4 I 0.6 I 2.3 I 22·7 I 18.5 I 6.4 I llo 7 I 9.J I 5.4 7.0 I. 11. 1*
* 1973 21.5 I 1 .. 0 l ?.1 I 2.6 I 27.6 I 24.8 I 6.3 ! 12.2 I l3.o I 6.8 10.3 I 15.0
*
* 1974 15ol I :~ -1 I ?.8 I 3.3 I 50-1 I 29.8 I l4. 1 I 19.8 I 19.4 I 10.4 10.0 I 20.0 *
* 1975 14oO I .... 0 I A.9 I 4.2 I 55.4 I 3?.5 I 24.4 I 2!.2 I 15.9 I 12o8 1 12.1 I 23.3
*
* 1976 17.7 I
s.B
I 8.8 I 5.<3 I 70·6 I 41.1 . I 28.6 I 26.5 I 32.2 I 15.0 I 15.2 I 21.3*
* 1977 .39.3 I ,'{. 3 I lel-7 I 8.5 I 9Qo7 I 52.7 I 26.~ I 5o.7 I 47.4 I ?0.3 I 18.3
I 21.2
*
I
*
lQ78 4R.7 Il
lo 3 I 11.7 I 10.3 I 74.7 I 64.5 I 28.0 I 53.0 I 62.2 I .??..7 I 24.9 I ??..4 ** 1979 71.9 I
1,:.
6 I 14.9 I 12.7 I 90.6 I 77.7 I 3S.? I 58.6 I 95.tl I ?5.8 I 31.4 I 25.0 ** 1980 59.o I 24·6 I 24·2 I 16.7 I 126·4 I 100.1 I 45.9 I 69.9 I 71:3.<J I :?1 .3 I 31.6 I 25.2
*
* 1981 lo6.4 I 4J.6 I 41.6 I 21.9 I 156.5 I 1?3.6 I 46.8 I 68.8 I 120.5 I 32.9 ! 37.0 I 28.9 *
* 1982 1o7.7 I 4·1. 6 I
31·2 I 25.5 I 129·6 I 149.2 I 47.8 I 76.7 I 1l0o4 I 34.9 I 37.7 I 37.1 *
I
* 1983 96.6 I Sh9 I 37.Q I 27.1 I 160·0 I 146.2 I 53.5 I 81.9 I 1S2ol I 38.7 I 39.4 I 33.3
*
* *
*************************!'**************************~*********************************************************************
SOuRCE:
TRADE STATISTICs, SEE tARLE 5 FOR DETAILS·
[image:8.859.78.818.18.549.2]-- -· -- ** {} **
**i~-~~*'!1'-ll:**
*
_.:t*
~*
*-~~-~!31-** *
-lt:Jl'** ** * * * * **
#'*
*
*
*
*
*
*
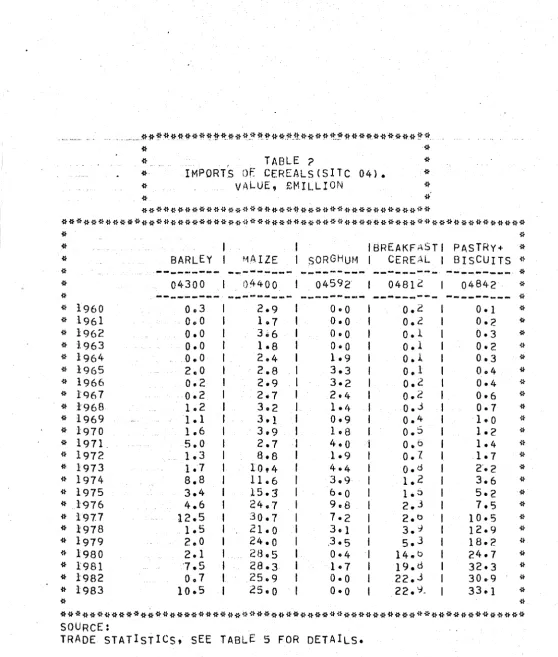
. TABLE ?
IMPORTS
Of CEREALS(SITC 04). VALUE,£MILLION
****************************************
****************************************************************
*
*
*
IBREAKFAST
IPASTRY+
*
*
BARLEY
~~AI ZE
SORGHUH
ICEREAL
IBISCUITS
-!}*
---
--·---
---
---
---
*
*
04300 04400 04592 04812 04842*
*
--- ---
--- ---
---
it*
1960 Oo3 2.9 0·0o.z
0·1*
~l- 1961
o .. o
lo7o.o
0.2 0.2*
*
1962o.o
3~6 0·0o.l
0·3*
*
1963o.o
1· 8 0·0o.l
0·2*
*
1964 o.o 2.4 1. 9o.l
0.3*
*
1965 2.,0 2.8 3.3 o.l Oo4*
*
1966o ..
2 2.9 3·2 o.2 0·4*
*
lg67 o.z 2•7 2.'+
o.2 0·6*
*
1968 1.2 3o2 1 •'+
o.J
0·7*
*
1969 1 • 1 3 •1 0·9o.4
1·0*
*
1970 1.6 3.9loB
o.s
1o2*
*
1971. 5.0 2.7 4.oo.o
1 • l~*
{} 1972 1e3
a.a
1· 9 0. 7. 1·7*
*
1973 1.7 10t4 4·4o.d
2'• 2*
*
1974 8.8 11.6 3.9 1. 2 3.6*
{} 1975 3.4 15·3" 6·0 1·0 5.2
*
*
1976 4.6 24.7 9o8 2.3 7.5*
*
1977 12.5 30.7 1·2 2.0 10·5*
*
1978 . 1. 5 21.o 3.} 3.-1 12·9*
*
1979 2.0 24.o .3. 5 5.3 18·2 ~~*
1980 2.1 (~ 8. 5 0·4 14 .. 0 24·7*
*
1'981 '1 .5 28.3 1· 7 19.d 32·3*
*
1982 Oo7 25.9 o.o 22.3 30.9*
*
1983 10.5 25.o 0·0 22.\j- 33.}*
*
*
****************************************************************
SOURCE:
[image:9.590.9.568.18.676.2]***~***********~**************************************
* *
* TARLE 3 *
* IMPORTS UF RA~ ~ATEPAILS<SITC 2 AND 4). *
* VALUE. £1-liLLIOI\
*
,,
****************~**************************************
**************************************************************************************************************************
* *
* I I CRUDE I Jt-1ULP A\101 TEXTILEIFERTILISI METAL I IPROCESSE
*
* HIDES IOIL .::iEEDI RUBBEr< I \V000 I PAPE~ I FIBRES I :-E~ I ORE: I CRUDE I 0 OILS *
* --- --- --- --- --- --- --- --- --- --- *
* I I I I I I I IVEG.NAT.IANIM.OILIVEG.OILSI *
* SITC21 I SITC22 I SITC23 I SITC24 I SITC25 I SITC2f, I SITC~7 I SITC2d
1--- --- ---
SITC43 ** I I I I I I I I SITC29 I S ITC4l I SITC42 I
*
* --- --- --- --- --- --- --- --- --- --- --- --- *
* 1960 0.3 I 0·58 I 1.56 I 4.54 I 2-12 I 8.66 I ?.?.7 I o.o2 I 1.4 I 0.3'} I 1.1 I
o.n
** 1961 0.51 I '). 6·) I j • 4d I 4.6 I loR.7 I 7.97 I 2.64 I o. 02 ·I 1-65 I 0.44 I 0.97 I o.lR *
* 1962 0.65 I 0·54 I J.3':J I 4.63 I 1·54 I 8.38 I ?.79 I o.oz I 1-~ I 0.36 I 0.97 I Oo2 *
* 1963
o.1
I 0·63 I 1-44 I 5.85 I 2·03 I R.59 I 3.33 I o.o3 I 1·41 I o.l9 I 0.93 I Oo43 ** 1964 Q.74 I 0~72. I j.43 f. 6.d2 I 2·09 I 10.33 I 3.64 I o.14 I 1.3 I. 0.34 I 1.3 I 0.46 *
*
1965· o.71 ! 0•74 I 1·6 I 7.54 I 1·67 I 8.32 I 3.69 I o.o9 I 1-:n.
,.
o.32 I 1.27 I 0·62 ** 1966 0.83 I 1•02 I 1.38 I 6.16 I lo37 I 9.46 I 4.87 I o.11 I 1.17 0.29 I 1.35 I n.ol *
*
1967 0.55 I .) • 84 I }.36 I 7. "39 I 1·83 I 9.2A I 5.77 I o.l3 I 1·28 0.16 I 1.21 I Oo55 ** ·l 1168 o.a1 I o.93 I i.72 l 10.52 I 2-6 I 11.13 I 7.16 I o.23 I 1-41 0.27 I 1.68 I 0.62 *
* 1969 1.4 I 1.oa I 1.58 I 11.12 I 2-72 I 11.45 I 7.'26 I 0.24 I 1.o 0.3B I 1.81 I o.sc; *
* 1970 l-11 I 1·02 I ?.38 I 10.78 I 3o35 I llo 79 I 7.13 I 0.17 I lobS 0.7 I 2.45 I o.91 *
* 1971 0.91 I o.Scl I ?.23 I 13.55 I 2·61 I 10.78 I 7.?.4 I 0~21 I 1.93 0.77 I ?.73 I ().HS *
* 1972 2.06 I l·Od I ?·14 I 14.65 I 3ol6 I 12.72 I 5.68 I Q."J4 I 2-51 0.92 l 3.0 I o.sz *
* 1973 3.15 I 6.53 I ::l.4b I 23.35 I 4o34 I ?2.45 I A.68 I 1.4:> I 3.b 1.49 I 4.36 I 0.41
*
* l'l74 2-41 I 2-19 I f-,.37 I 38.83 I 5 ·'~ 1 I 27.51 I 18.57 I -2.35 I 4.b 1.56 I 6.91 I 2.57 *
* 1Cl75 1-61 I !l•o I 4.9"+ I 21.89 I 4·93 I }8.56 I 1?.. 75 I lo37 I
J.ss
1· 24 I 6.84 I ].33 ** 1976 2.99 I 1·69 I P.86 I 34.35 I 6·22 I 35.8 I 14.1 I 1.0d I 5.47 1.2 I 9.12 I 2.3 *
* lC/77 4 o35 I 3~38 I 1io27 I 39.03 I 6·2 I 40.2 I 14.75 I 2·4 I 6ob9 3.33 I 12.18 I 3.26 *
*
1978 3.92 l '•. 0 J l q.51 I 44.'18 I 5o67 I 33.23 I lf>.?4 I 2.67 I 8.74 j 2.39 I 11.88 I 3.46..
* 1979 6.14 I !~. 4 tl I 1?.24 I 61.54 I 7 ol6 -1 40.15 I 18.47 I 3.3ti I 12.27 I 2.92 I 16.45 I 5.56
*
* 1980. 3.97 I !•77 I 13. 6tl
.
I 58.67.
I 8·44 I 44.54 I 21.3 l 3.38 I 13-5 I 2.47 I 16.35 I r..o ~* 1981 4.51 I 2•62 I 13.82 I 69.38 I 11·23 I 55.45 I 2?.14 I 4.76 I 20.o7 I 3.57 I 20.55 I f>.l *
*
1982 2-23 I 2·98 I n.r,9 I 57.19 I 3·46 I 50.03 I 25.04 I 7.1:lb I 23ob5 ! 3.22 I 20.52 I 7.27 ·**
1983 1ol9 I 2·58 I 13o97 I 57.9-5 I 3·54 I 54.5fl I 33.58 I 27.'J':J I 25.79 I 3ol3 I 22.73 I 7.7Fl ** *
*********************************************************************************************~******************~*********
SOURCE":
TRADE STATISTICs, SEE TABLE 5 FOR DETAILS•
******~***************0***********
*
•.
*
*
*
*
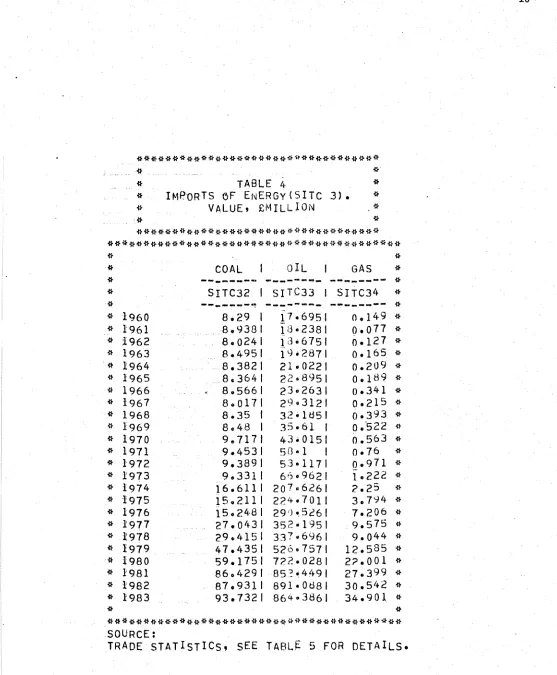
TABLE
i+
IMPORTS OF ENERGy(SITC 3).
VALUE' £MILLION
*
*
*
*
**********************************
*****************************************
*
*
*
COAL
OIL
GAS
*
*
--- --- ---
*
*
*
*
*
*
*
*
*
*
*
*
*
*
*
*
*
*
*
*
*
*
*
*
*
*
*
*
1960 1961 i962 1963 1964 1965 1966 1967 1968 1969 1970 1971 1972 1973 1974 1975 1976 1'977 r978 1979 1980 1981 1982 1983
SITC32 I SITC33 I SITC34
*
---~-~
---
-~---*
8.29 I 17·6951 0 .}49*
8.'J381 li3·2381 o.o77*
8.o241 id•675J o.121*
8.4951 i9•2871 Oe165*
8.3821 21·0221 o.209*
8c364J 2(;.8951o.IB9
*
8 .. 5661 23e2631
o.34l
*
8 .. 0171 29.;3121 0·215
*
8.35 I 3;?. e ltj5l 0·393
*
8 .. 48 I 35·61 I o."522 {}
9 .. 7171 43•0151 o.563
*
9.4531 sn-1 I o.76*
9.3891 53•1171 o.971
*
9.3311 6•)o9621 1.222*
16.6111 207·6261 ?.25 {}l5o2111 224•7011 3.794
*
l5o24·81 29 ') ~ 5c6 1 7e206*
27.01•31 352-1951 9.575*
29 .. 4151 33?'v6()6J 9.044*
47.1+351 52•). 7571 12.585*
59.1751 7?2·0281 2?.001*
86 .. 4291 85?•4'•91 27·399*
87.9311 89lo0U8J 30.51+2
*
93.7321 864·3861 34.901*
*
*****************************************
SOURCE:
[image:11.576.4.561.13.688.2]lf•lf 1!-11 ***If If II If*** If*** II II lf*** If** II U*.**** *** i1 *** **** *** *** il **
* *
T4BLE 5
MEHCHANDISt IMPURTSo0NADJLSTEO. VALUE, L~.ILLlON
*
*
* *· *********************************************lf*******lf11
•
I ORII-JK. +I CRUDE I I AN!I~AL+I IM~NUFAC.I I OHitR I *
FOOD I TO.itsACOII~AHRHLI ENEPGY IVtG.FATsiCHEMICALit~~TEHIALir~ACHINEsiMANUfAC,I OTHER *
--- --- --- ---
--- --- --- --- --- ---
.
S!TC 0 I SITC 1 I SITC 2 I SITC 3 I SITC 4 I SITC 5 I SITC 6 I SITC 7 I SITC R I S!TC 9 *
---.-- --- --- --- --- --- --- --- --- --- * 1%0. 1961 1962 1963 1964 1965 1966 1967 1968 1969 1q70 1971 1972 A
MOUNAOVI
---35.8711 47.21 I 46oQ341 52.8621 <;5.9021 64.8361 61oOS31 59.9131 n9,2191 &9.H271 7<J.96 I
fl?o2641 96o36 I
11 v M2V
---6·'3761 21.4S"I •).8731 2}.4241 7•5691 21.7:;31 7. 6'• I 24.?::l11
7.9831 27.2611
7.1t991 2S,73li
.3 • 2 7 '• I 21>o37!.il ,Jd511 2floi;Jll
}.~.6341 3A,5121 il·92 I 3H, it J':i I
•lo93() I Jq. 4l:i I
ild121 4Qo34ll
}:lo5241 44·'•2tll
M3V IHV M5V
---26.1371 1oo'S91 17.7341
27.2531 1·5911 19.3"i11 26.<l2ol 1·5261 21·07 I
27.9471 1o5491 24,6431
29.6131 2·0961 ?8.2'j I
31,4481 2·2041 32.4041
32.1691 2·24SI 33 ·'•tl?.l
37.!j4')1 1•91RI 35.7991
40,9291 2.56fll 47.9?')1
44,6131 2·75 I ')2.9'121
53,2951 4.0331 61.32 I
6fl.3131 4·3541 70.4[)31
63,S731 4o43?1 87.75)1
M6V 1{7V M8V I M9UNADV *
---
--- --- ---
*4'•. 77h I 47,2U41 10. 'f311 13,"182 *
51·0'141 S7,3'i91 12·7191 }6.538 *
53.7171 64.7'i5 14·6191 15.816 *
59.7641 73.271 l7o4241 18.382 *
73.0661 tJs.s:n 21o54RI )8.066
*
73.4181 Y3,1tl7 23.0?SI ltl.095 *
78.2231 89.171 24ol071 17.t;67 *
ll0·3DI 92.282 27ol941 42.259 *
103,791 I 119.6tl 37. 3?91 45,536 *
!27.02nl 17l.O'J6 46·67 I 46.307 *
143,63 I 180,419 54.55 I S0,072 *
158.;>681 203·7'(4 b5o27CJI so.&o5 * !79o}9hl 2!8.2':56 77o4931 <;J,04 *
---
----·-~--- *r 1972 B 1973 1974 1975 1976 1977 A
96.2 I 118,6731 ln7.?4SI 191.3171 2sz.ona1 35L;, 9551
i tl. 1 ;>i.2tl81 3•1. 0561 35o1+•H31
3'1•'>271
J.l·4J~;I
4l;. 4
77.0021 10fl.?.1tll 70. ,,,, I 11o.5641
13~1.8.3. I
63,6 I 4·4 I
77.S151 6.27?1
226,4B71 11·04 I
243,7061 9.4131
31?..9791 12•'>271 3&H •. HBI 1Bo7671
llfl.6 I }8 1. 9 I 22?.7 I 81o5 I 36.7 * 123,2t'91 253.3961 .307,3051 105.5771 42.919 * 187,9!81 250.}651 356.4091 139.4541 ,,9.291 'J
191.'1151 :!3?.99?1 419.cll11 157.7431 51,S39 * 2'16.7461 46?.'1011 594.~331 222.9781 76.091 * 3'· 8, 1 o 2 I 5il4.7911 t\2"{. tl'i21 298oOC:,"il R9o34fl
...
. --- --- *i 19'{7 B '• 1978 '• 1979'
I lCJRO
,t 1981 t 1982
*
19833<;5.3171
38~;.95 I
ltq~;. 7731 57?..9591 762.6821 7S3.3tl I 845.1981
3J·4171 1213.·):,;; I 3tltl.bl31 47•3181 12P..9t>'il 376.15td '1t>•'tJU I }t,S,FH<tl 58a. 7771
~i<:Jo7:3<)1 l64o;?'l1tl bQJ,2041 6'-J.n11 2o4.7il 1 966,2701
7~·8091 1BA,5<t211009,5621
7~·7261 221.1771 993,0191
18.76-tl J4J,'i571 59?.5921 t~3o.Sl91 2%.3531 17•7271 443.1391 714.91411110.47 I Jtl9.44 I 24•9321 564.39 I S29o4~ l13d6.1D I ~16.54~1
24•8?.71 5n0.2131 S9).04611471.2741 633·91?.1
30·2171 690.~9Bill2A.6111180S,'il21 767.~4RI
31•0111 737o21611153.S051187?,4ti51 d32.U?61
33o66 I 843.4A41ll7?.66812119,tl071 892.4~81
96.201 * 99.018 *
101.574 * 135.231 *
1 o:; 7. 65'• * 1;;4.82 * 172.538 *
~*********************i'**~***********************~******************************************************
:JOUHCES:
~9t>Q:TRADE AND SHIPPING ST~TlSTICS,1961,
1961:TRADE A~D SHIPPING sT~TlSTICS,19o2,
~96?-3:TRA0E AND SHIPPI~G ~TATISTICS,l~65-6
l964:EXTffii~AL TPADE STATI~TICS,l%7-8
!}965: EXTERf<AL TRADE STAT! :i TICS .1 969
1966:EXTER~AL TRADE STATISfiC$,1970
1967-7I:EXTfRNAL T~AOE STITISTICS,]971
1972 A:STATisTICAL Ar3STRt,·,:T
197? R:HEVIEW OF 1973 A~D 0UTL00K FOR 1974
l973:TRADE STAT!STICS,DEC~Md[R 1974
1974:TRADE STATISTICS,UEC~MBLR 197<:; 1 9 7 s : T n AD E s r A 11 s TIcs , o E c i: 1 ~~ t: q 1 916 1976:TRADE STATISTICS,[JECC·i3te;l 1977
1977 A:TRAUE STAT1STICS,O~~[M8E~ 1Q77
1977 B:TRADE STATISTICS,D~CENBER 1978
I97B:THADE STATISTICS,OEC:C'HJLR 197Q 1979:TPAOE STAT!STICS,DECC:·'rlLR 1980
l9dn:TRAOE ~TATISTICS,OEcC~YlR 198j
1981 :TP/I.DE STATISTICS,D~c: ;dLR 198? 19':l?:TFIADE STATIST!CS,o::c .. ttlt:R 193:>
19~3:TRADL SPTISTICS,DEC':: ·tlLR 1984
l9d4:TRAOE STAT!ST!CSoD~C£·•8lP 1994
1~10iJNADV fti~J ''9U~Ii~Ov:FOK I l:.)Q AtJ..J 1%1 TEni"OKARY I ir'QRTS OF -'ACEHORSES
ETC. \·:ERE TP:, .. 6FF.:>~r<D nw 1 SITe 9 TO Slic Q,THE 'A'lV;JNTS I"lVOLVED WErlE i4o0S7 AND <t,nJ !N 1960 4N·I 1Y61 ~E~PECTIVELY.THIS ADJUSTMENT WAS ·NECESSA-qY To ~iA""E TdE 01-iT·' FUR THOSE Yt.ARS CONS!Sft.NT AITrl THOSt FOR il9b2 TO 1972.
********************************************
*
*
. *
*
*
*
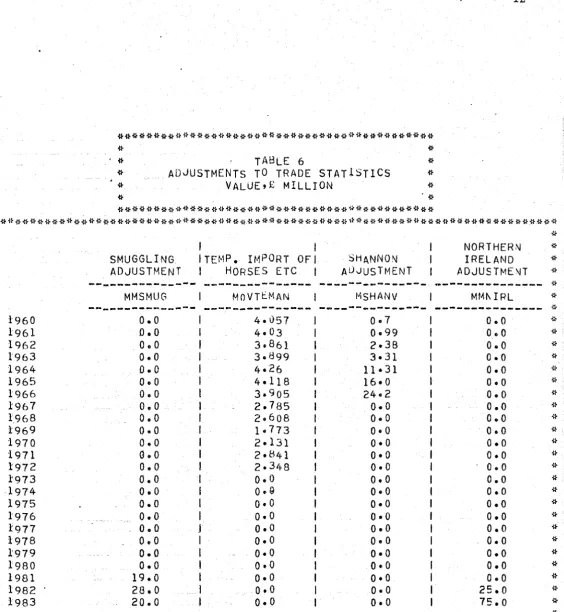
TABLE 6
ADJUSTMENTS TO TRADE STATISTICS VALUE,£ MILLION
*
*
*
*
********************************************
'***********~*****************************************************************
SMUGGLING ADJUSTMENT
I
ITEMP. IMPORT OFI
I HORSES ETC
SHANNON
AUJUSH~ENT
NORTHERN IRELAND ADJUSTME\JT
*
*
*
{~
-~---
--- --- --- *
*
MMSMUG MOVTtMAN t"lSHANV Mf-lf\ I RL*
iJ.
__________
,._____
--- ---
______
..
________
{',t 1960
o.o
4·057 0·7o.o
JJ-:} 1961
o.o
4e03 0·99o ..
o
~~:l- 1962
o.o
3·861 2·38o.o
..
*
1963o.o
3·899 3·31o.o
*
;} 1964
o.o
4•26 11• 31o.o
{l-:r 1965
o.o
4·118 16•0o.o
*
.l}
1966
o.o
3·905 24·2o.o
*
l} 1967
o.o
2·785o.o
o.o
-~~I} 1968
o.o
2·608o.o
o.o
{~~ 1969
o .. o
1•773 0•0 OeO*
,D 1970
o.o
2·131 0•0o.o
*
*
1971G.o
2•841 0•0o.o
-~~I* 1972
o.o
2·348 0·0o.o
*
*
1'973o.o
Io.o
o.o
o.o
*
*
1974o.o
IO•G
0•0o.o
*
*
1975o.o
I 0•0 0·0o.o
*
*
1976o.o
Io.o
0·0o.o
*
*
1977o.o
r
o.o
o.o
o.o
*
*
1978o.o
Io.o
o.o
o.o
*
*
1979o.o
Io.o
0•0o.o
*
*
1980o.o
I 0·0 0·0o.o
*
*
1981 19.0 I 0·0 0•0o.o
*
*
1982 28.0 Io.o
o.o
25.0*
*
1983 20.0 Io.o
o.o
75.0*
*
*
******************************************************************************
SOURCES:
MMS~UG:SMUGGLING ADJUSTMENT AS IN THE BoP,DEPT. oF FIN. DATABANK.
MOVTEMAN:TE~pORARY IMPORTS OF RACEHORSES ETC.(AFTE~ 1972 THEY AHE EXCLUDED FHOM THE TRADE STi~TS.) SOURCE AS IN TABLE 5.
<THE NATIONAL ACCOUNTS DO ~OT CARRY OUT THIS ADJUjTMENT AND tAS A RESULT.ARE NOT CONSI~TENT.)
~SHANV:ADJUSTMENT FOR SHA~NON TRADE.PRE 1965 SEE CHAPTER 3.FROM 1965
~HE ADJUSTMENT IS GIVEN I~ THE EXTERNAL TRADE STATS.THE SERIES USED HERE Is TAKEN n<OM THE DEPT• OF FINANCE DATA~:iANK•
MMNIRL:ADJUSTMENT FOR ADDITIONAL IMPORTS FHOM NORTHERN IRELAND AS
·IN
[image:13.579.12.576.16.628.2]'}*****************~***********************************
*
*
*
*
*
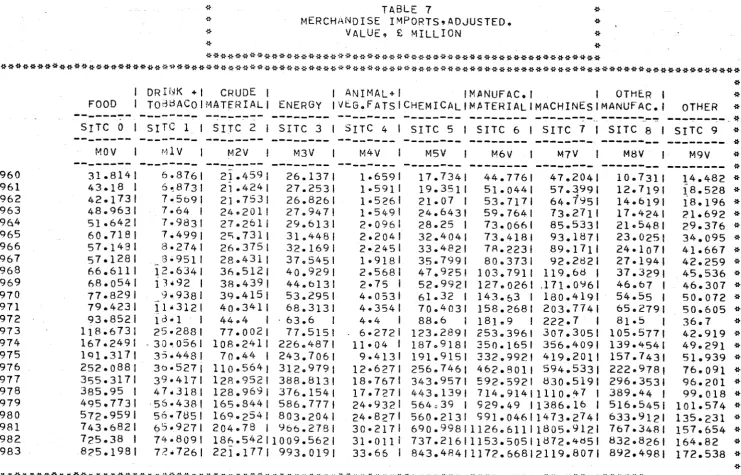
TABLE 7
MERCHANDISE IMPORTS,ADJUSTED. VALUE, £ MILLION
*
*
*
*
*
******************************************************
********************************************************************************************************
*
*
*
*
*
*
*
*
*
*
1960*
1961*
1962*
1963*
196.4*
1965*
1966*
1967*
1968*
1969*
1970*
1971*
1972*
1973*
1974*
1975*
1976*
1977*
1978*
1979*
1980*
1981*
1982*
1983*
I DRINK +I CRUDE I I ANIMAL+! iMANUFAC.I I OTHER I
*
FOOD I TOddACOIMATERIALI ENERGY JVtG.FATSICHEMICALIMATERIALIMACHINESIMANUFAC.I OTHER
*
--- --- --- --- --- --- ---
---~---~-~ ---~-*
SrTC 0 I SITC 1 I SITC 2 I SITC 3 I S!TC 4 I SITC 5 I SITC 6 I SITC 1 I SITC 8 I SITC 9
*
--- --- --- --- --- --- ---
---~----- --- *
t~O V r>ll V M2V tv13V M4V M5V t-16V M7V M8V M9V
*
---
---
--- --- --- --- ---
---
--- ---
~31.8141 43.18 I 42·1731 48.9631 51.6421 60.7181 57-1481 57.1281 66.6111 68.0541 77e8291 79.4231 93.8521 118.6731 167.2491 191.3171 252.Q88J 31:)5.3171 385.95 I 495.7731 572.9591 743.6821 725.38 I 8?5.1981
6~8761 6~8731
7•5691 7.64
i
7·9831 7.;4991 0•2741 3•9511 12.6341 iJ-'92 I 9·9381 11•3121 id•1 I 25·2881 -30•0561 3:3•4481 3b•527! 39·4171 47.dl81 56·4381 56·7851 61J ·9271 74·8091 72•7261
2}.459! 26.1371 21.4241 27.2531 21.7531 26.8261 24·2011 27.9471 27o261! 29.6131 2t;.731 31.4481 26o375 32.1691 28 .. 431 37 .. 5451 36.512 40.9291 38.439 44.6131 39.415 53.2951 4Qo341 68.3131 44 .. 4 - 63.6 I 77.002 77.5151 108·241 226 .. 4871 7o.44 243.7061 11o.564 312.9791 128o952 388.8131 128.969 376.1541 165.8441 586.7771 169-2541 803.2041 204o7B I ~66.2781
186.54211009.5621 221.1771 993.0191
1·659 1·591 1•526 1·549 2•096 2·204 2·245 1·918 2.568 2·75 4o053 4·354 4•4 I 6·2721 11•04 I 9.4131 12·6271 18e7671 17.7271 24·9321 24•8271 30•2171 31·0111 33·66 I
17.7341 44.7761 47.2041 19.3511 5}.0441 57.3991 21.01 I 53.7171 64.1951 24.6431 59.7641 73 .. 2711 28.25 I 73.0661 85 .. 5331 32.4041 73.4181 93.1871 33.4821 78.2231 89.1711 35.7991 80.3731 92.2ij2f 47.925! 103.7911 119.6d I
52.9921 127 .. 0261 .l71.0\j61 61.32 I 143.&3 I 180.4191 70.4031 158.2681 203.7741 88.6 I 181.9 I 222.1 I
123.2891 253.3961 307.3051 187 .. 9181 350.}651 356.4091 191.9151 332 .. 9921 419.2011 256.7461 462.8011 594.5331 343.9571 592.5921 830.5191 443.1391 714.91411110.47 I
564~39 I 929.49 11386.16 I 560.2131 991.04611473.2741 690.99811126.61111805.9121 737.21611153.50511872.4d51 843.4A411172.66812119.8071 10.7311 12.7191 14.6191 17.4241 21e5481 23.0251 24·1071 27.1941 37.3291 46.,67 I 54.55 I 65.2791 81.5 I 105 .. 5771 139.4541 157.7431 222.9781 296.3531 389.44 I 516.5451 633.9121 767.3481 832.8261 892.4981
14.482
*
1_8.528*
}8.}96*
21.692*
29.376*
34.095*
41.667*
42.259*
45.536*
46.307*
50.072*
50.605*
36.7*
42.919*
49.291*
51.939*
76.091*
96.201*
99.,018*
101.574*
135.231*
157.654*
164.82*
172.538*
*
********************************************************************************************************
SOURCES:
. WITH THE FOLLOWING EXCEPTIONS,THE DATA ARE TAKEN FROM TABLE 5:
M 0 V=M 0 UNA DV +MivlSMUG-M 0 VTE~1 ,;;~,
M9V=M9UNADV+M5HANV
[image:14.848.62.804.37.512.2]*
* *
*******************~**************
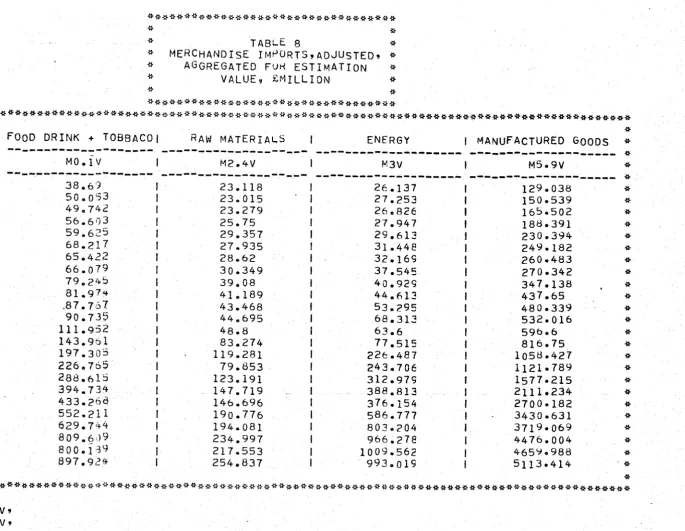
************************************************************************************************** *
*
* FOOD DRINK + TOBBACOI RA~oJ MATERIAL.S I ENERGY I MANUFACTURED GOODS *
*
--- --- ---
~---*
* M0.1V I M2.4V I M3V I M5o9V *
*
--- --- --- --- *
* 1960 38.69 I 23.118 I 26.137 I 129.038 *
* 1961 5o.o53 I 23.015 I 27.253 I 150o539 *
* 1962 49.,742 I 23.279 I 26.826 I 16=>·502 *
* 1963 56.61i3 I 25.75 I 27.947 I 188.391 *
* 1964 59.625 I 29.357 I 29.613 I 230.394 *
* 1965 68.217 I 27.935 ! 31.448 I 249.182 *
* 1966 65.422 I 28.62 I 32.169 I 260.483 *
* 1967 66.o79 I 30.349 I 37.545 I 270o342 *
* 1968 79. 2'+S I 39.08 I 40.929 I 347.}38
.
** 1969 81.97<+ I 41.189 I 44.613 I 437.65 *
* 1970 .87. 76 7 I 43.468 I 53.295 I 480.339 *
* 1971 90.73~ I 44.695 I 68.313 I 532·016 *
* 1972 111.952 I 48.8 I 63.6 I 596.6 *
* 1973 143.961 I 83.274 I 77.515 I 816.75 *
* 1974 197.305 I 119.281 I 226.487 I lo58.427 *
* 1975 226 .. 765 I 79.853 I 243.706 I 1121·789 *
* 1976 288.61S I 123.191 I 312.979 I 1577.215 *
* 1977 394.734 I 147.719 I 388.813 I 2111.234 *
* 1978 433.268 I 146 .. 696 I 376.154 I 2700·182 *
* 1979 552.211 I 19o.776 I 586.777 I 3430·631 *
* 1980 629.744 I 194.081 I 803.;?04 1. 3719•069 *
* 1981 809.6J9 I 234.997 I 966.278 I 4476.004 *
* 1982
aoo.i:39
I 217.553 I 1009.562 I 4659.988 ** 1983 897.92!+ I 254.837 I 993.019 I 5113·414 ·o
* *
**************************************************************************************************
SOURCES:
MO•JV=MOV+MIV' M2·4V=M2V+M4V' M3V=M3V,
M5~9V=MMVA-MoUNADV-MMSMuG-MlV-M2.4V-M3V-MMNIRL
t-4
[image:15.848.146.831.15.546.2]**********************************
*
*
*
TABLE 9*
*
MERCHANDISE IMPURTS,ADJUSTED~*
*
AGGREGATED FUK ESTIMATION*
*
VOLUME,£MILLIUN,
1975 PRICES*
*
*
**********************************
**************************************************************************************************
*
*
* FOOD DRINK + T08BAC01 RAW MATERIALS I ENERGY I MANUFACTURED GOODS *
*
--- --- --- ·--- *
* MO.! I M2 .. 4 I M3F I MSe9 *
*
--- --- ---
-~----~---*
* 1960 95.57l I 56.514 I 123.667 I 342·25 *
* 1961 125.617 I 57.509 I 130.092
'
395.595 ** 1962 122.5·~6 I 60 .. 868 I 128.213 I 436.814 *
* 1963 137.o41 I 66.472 I 131.077 I 493.74~ *
* 1964 143.o9"} I 72 .. 112 I 135.69 I 6Qtl.415 *
* 1965 163.ool i 68.87 I 147.685 I 632.068 *
* 1966 157.oll I 70.302 I 155.52€ I 655.418 *
* 1967 156.oJ1 I ' 75 .. 371 I 185.802 I 6 75-17 *
* 1968 174 .. i95 I 91.458 I 182 .. 442 I 814.282 *
* 1969 173.o9l' I 93.272 I 198.157 986.207 *
* 1970 176.363
'
95.417 I 231.94<; 987e489 ** 1971 173.45:3 I 98.009 I 262.712 1o3I.B95 *
* 1972 203.86 I 104.503 I 242.377 11o1.38 *
* 1973 214.515 I 126,.568 I 270,.672 1366.245 *
* 1974 225.72!'+ I 122 .. 817 I 254.671 1325.753 *
* 1975 226.765 I 79.853 I 243.70€ 1121·789 *
* 1976 249.6o7 I 103.089 I 237.826 1346.621 *'
* 1977 265.9·=13 I 99.541 I 260.241 1560 .. 716
*
* 1978 280.614 I 102 .. 945 I 265.49 1862.484 *
*
1979 333.26 I 118 .. 864 I 297 .. 403 2132.373 ** 1980 336.7v1 I 108.851 I 291.121 2ooS.767
*
* 1981 375.51;+ I 114.,409 I 260.663 I 2073.413 *
* 1982 356.749 I 103.695 I 247.87€ I 20Q8.343 *
* *
**************************************************************************************************
SOURCES:
M 0 • 1 =f--1 0. 1 VI Pr-1 0 1 ., M2 • 4=t-12. 4 V /PM24., M3F=M3V/PM3F.,
M5•9=MM-M0•1-M2.4-M3f-(MQVTEMAN+MMNIRL>;PM01
CIN THE TE~T THESE FOUR SEH!Es ARE CALLED : M01,M~4,M3,M59)
1-'
[image:16.853.21.805.27.517.2]*
-* I PPICE INDEX- I COST CFI WAGE IF~RTILISIAGRICULTI CUSTOMSICPI
-
UKIt-4F'ORT U"'IT VALUE INDEX I SERVICES 1~PutHSI CAPITIIL I RATES I -ER I • OUTPUT I DUTIES I £ IRISH
--- ---
---
..
--- --- ---
---
----·---<I FOOD IRA~, :··1,\T. 1 ENERGY I OTHf.R I rouHis~,, I !1\DUSTRY I I
*
---··----
---
--- --- ---
PKI~N4CI--- PF .PQAGG I RC PCUK~
..
PMOl p1:!4 PI-!3F PMOS P~1T0 I AilE I I I--- --- --- --- --- --- ---
---
---
---
---1960 0.4048 0 .'~'i91 0.?114 O.J7d u.337S I o.o7J?. 0.4734 I 27.67 I o.J"'-'4 0.0257 o.3646
* 1961 0.3985 ·o.'"~l02 0. ?0')5 0.3Slo4 0.3459 I (l.045t.J o.c;oa6 I 25.·b6 I u.J:::>Iq o.o?.26 0·3772
* 1962 0.4 057 0 •. ld?.4 o.?on 0·4012 0.3616 I o.o489 o.s511 I 26.2<; I u.3St16 o.o231 0·39?.7
1963 0.413 o. J<i14 0.?132 0.4162 0.37 I o.o554 0,5801 I 26 .• 12 I 0.3608 0.0226 0.4007
19(A 0.4167 0 •.• J71 0.?182 0.4235 0.3':15 I o.os3 0 ·'"•21 I 21). 74 I 0,3tlb2 0.0198 0.4137
1965 0.4185 o .:,osb 0.?1?.'1 0 ·.4? 75 0,4147 I o.ol\21 Q.h676 I 28.22 I 0.4 1)'>5 0.0202 0·4334
* 1966 0.41b7 () ... ;) 71 o.?Ot.d 0 ,lfl61 u .4273 I Q.(\4ti2 0.734 I 2H.33 I 1).3:7':18 o.o21d o.4so9
* 1967 0.4235 0. ·•t.J27 0.?021 Oe4423 •1.4415 I 0·0'•5A 0.78?1 I 28.9':1 I o.4143 0.0201 Oe4616
I968 0.4549 0,4273 0.?24J 0.4508 Ue4bl8 I o.o5~>2 o.A855 I 31.7 I 0.4433 o.o1135 Oe48Jtl
1969 0.4736 0. •>'>1 b 0.?251 0.49U3 0.1,94\1 I 0.0441 0.9934 3?..17 I Oe4b4?. 0.017.5 o.so97
w 1970 0.4977 0 ... . '50 0.;>2'}:5 0.53b3 u.5J6B I 0.0424 1.1475 3('.4'+ I 0.4db9 0. 017 0. :;4 25
* 1971 0.5231 o.""6 0,?6 0.'5'lU3 u.Sd39 I 0.036'1 1.r.n2 3'5.04 I 0.5156 O.Ol61 0.5935
... 1972 0.5492 o.~o7 0.?623 0.5739 u.6346 I o.o129 1. 53 33 38.7b I Oo6lb4 o.o174 Oe6355
1973 0.6711 o.o~7\l. 0.;>864 o.6A36 0.7069 I o.o354 1.7502 43.32 I o.7b19 o.o15 0·6937
1974 O.f\741 0. j 712 O.f\89.1 O·t!093 u. 8273 I o.o3d8 2·03?3 67.2!:l I o.7-JYs o.o147 0<8049
* 1975 1 • 0 1 • ,, 1. 0 l.o 1. 0 I o.ooo:; 2.r.OJ2 Ioo.o I 1.0 0 •. o 10 3 1 • 0
* 1Q76 1.156 1.1':15 1•316 1 .• 2?.57 l. 1 tl02 I o.o79a 3.}~71l 102.8 I 1.2444 o.o11 1·1658
1977 1 ·'•84 1 .... 64 1.494 1.3CJ21 1.3412 I 0.1?14 3.703 112.4 I 1.51b5 o.oo95 1.3501
1978 1 .544 1 •'H:!5 1. 417 1.4532 1.4427 I 0.]822 4.?711 119. 1 I I.6o::l) 0.0096 1·'•618
1979 1.657 1 • .,v5 }.c;73 1· 6727 1.6335 I 0·204 5..}247 13o.s I 1e7b54 o.ooH2 1·7?18
* 1980 1.87 1. !o3 2.7<;;,9 2e0454 l. 931 A I o.J433 ~.084) 154.5 I 1. 7t>C:,J o.ooi37 ·2·2417
"'
1 Q81 . 2.}56 ? • tF>4 3. 707 Z •'•O<+ ~.3265 I Q.}90t! 7.}749 1 71 • 7 I 2eQb1?. o.oo9 2·· 73781982 2.243 2.·1'>8 4.o73 2.5371 2.7J23 I 0.3114 s.;:>oas 182.2. I 2.2677 o.oo92 2o9146
R*~*~**~*****~**~**~~****{~~~***~*u********~***~***o*****~**~*********~~**~~**~*******~ooo~*~*~******~***********~
SOURCES AN0 oEF!NITIONS:
Pt~Ot:Ur.JIT VALUE WDEt<,J>.IP•f<T:; SITC 0 AND 1.DEPT. IJFF!N. DATAAANK.
M24:UNIT V/·.LUE ItJD<:,<,H!P·J•<TS SITC ?. A!'<O 4,DEPT. uf FIN. DATABANK. M3F:UNIT VALUE IrJOEXt!<iP·l'iTS ·siTe J,IJEPT. OF FIN• OATA:JANK. PMOS:PRtCE OFFLaTOR OTHER SERVICES !MPURTSoOEPT. uF FIN. DATAAANK. PMTO:PPICE DEFLATOR TOUR!31 IMPURT~,D~PT. OF FIN. UATA~ANK• f>Kit~N4C:PR1Cf 1~tf\Ex FOt( CJ~T OF CAPITt\L IN MANUFA'-TURlNG INDUSTRY.
Assu~1Es ~Jr:IGHTED AvERAGE T.,x flATt AND ;~o TAX SHIE._u o;~
INTEREST OH DEPPECIATIO~J. ;UURCE:DEPT. OF FIN. DAT-'ItsANK. AAEI :AVERAI>E ANWAL EAfl~H••'-'S PER HEAD 1N INDUSTRY• SOURCE:DfPT. OF FINANCE D~TAuANK
~ :PRICE l~mEx FOR FERTILlStR INPl!TtCEtJSUS QF AG•ilCULTuRAL PRODUCTICN.
~ IRISH ST t.TISTICAL 3ULLfT HI. .
JAGGIPRICE INDEX FO~ GQO~~ AGHICULTU~AL OUTPUT,DiPT. OF FIN. DATABAI\K. RC :INDEX OF EX POST RAT[ JF CUSTO~S OUTYtDEPT. Of FIN• DATABANK
VAHIABLE : RCUS.
;UK:lNDEX OF CON~UMER PR!CES IN UK CONVERTED TO IH!SH POUNDS. ERIVATION:THIS INDEX IS F~E AVERAGE 0F TrlE MONTHLY cPI FO~
trlE UK CONI/fRT£D TO IRISH ~OJtJOj USIN~ THE EXCHAN~c RATE FO~
THE RELEVANT MONTH.
*********Ott<>oo•··~···
*
*
* TAtiLE 11 *
* OEIHVEO tJtHC£: It10ICE5· *
*
"
•o~***~*~~~*~oo**~***~****~o*~***~
It !Ill 11<>11 II <1<1'.1-<1 <Ill llllttlllltttt*** llll''""***ll-* II <l<lllll<><loo<l<l<lll.olltt<IO <>111111<><1<1
*
0PRICE INDEX
II
<I ---~-- 0
* II
o'
* 1960
* 1961
*
1962* 1963
*
1964* 1965
<I 1966
*
1967* 1968
* 1969
*
1970* 1971
*
1972* 1973
* 1974 * 1975
*
1976" 1977 " 1978
II 1979
II 1980 " 1981
*
1982MANUFACTURED IMPORTS!
--~---PM 59 --~---0.377 o.Jno~ Oo37Ri 0.3fli-, 0.378'1 0.394-.!
0. 3974 Oo4004 Oo4?.63 Oo443-i 0.486'+ OoS15; o.s4i7 Oo:'97':i o.79R·+ 1.0 lol7i~
1. 3 52!
lo449~·1
1·608:-l 1o8542 2·158 '· 2.3?.oJ
OTHER CONSUI~P r 1 ON
---
PCO---
Oo3355 Oo3443 Oo3553 Oo3E>43 0.3886 0.4077 Oo4?.05 o.4321 0·4546 Oo4847 0.5228 Oo56tH 0.6?66 0.6999 0.8179 1.o 1ol702 1·3344 1·4288 lob412 1o9185 2o2812 2.6077 * * * * II II II II II II II * 11. II II ·* <I· " II* 0 <I II II II II It II o*~*******o*~***~**~*~*~*O**~~***~**~*******§******~*~*~ DE~'~IVATION.: PM5.9=M5.9V/M5.a, PCO=COV/CO ************ll<lllllll<l<>tt******ll******ll***~*****ll*llttllll*****
<I *
TAHLE 12
AGG~EGATE TRADE DATA.
£ I~ILLlON
17
*****<~ll<~*ll**llll<>ll<>ll<>o••~o********ll**********ll***ll***~**
•006*~~~****~~~0**~~******~~*******~*********~*****~***0***~~~**~~**·*~*~*******§~*~**~******~********~*~******~'
IMPORTS AT 1975 PMtCESoEM
---~--- ---~---TCTIIL I · :~t:llCH, .I TOTAL ~lERCH. I SERVICES
---
---
I TOUKISM I---
OTHE~ -~------
---I I TOURISM I 'OTHEH
1--- ---~---~-- 1'~---.,.--
---~1TVA r1tWA I ·I TOTAl.. I RESIDUALITRANSFORTI MT• MM I I
I IHUVA 1---
---
---
I MTO I MOSI I ~IOSV \ I OTHSf.qVDI 0Tt-JTRANDI I I
~
---·
--- --- ---
---
--- ---
--- ---
---1960 ('I;O, 1 I ·'-.~ l • \Jll I 1'+•9 4. lo I 1·4 o.o 673ol5o o1ti.0011 44.1491 11.006
1961 ('76,7991 .;';il;. gq I 16·3 5.0091 1·4 o.o 770. 1;9':1 70d.f:l1SI 47.13 I l't. 554
..
1962 ?.94,0Y91 ~''". 21 I 1"·2 s.od91 1· 6 o.o 81So763 748.4'7 I <;3.0911 l4.1B?" 1963 33}.1991 .1J2.S9 I 2c•4 &.c:J91 1o7 o.o 903o606 . d~d.J451' t\0.54?.1 14.'11<:1 " 196'• 388.2991 ~:) 3. 25 I 2S.~ 9 . b I loR o.o 10l>Oo4<.J2 ~~9.3161 65.5721 ?1.60"'
196S 420.5 I Jlj(} .9 I 28·2 11 ... I 3o1 8.3 110bo?.89 1011.63 I t\7,9941 26,h66
196() 436.2991 .! l 0. 6 I 3l•o 14 •. )':191 2oA llo3 1}4boQ98 10.ldo2~71 73.9551 33 •
.:'\fll-"
1967 451.3'191 "·l 7. 1 I Ju•l 14.1':191 "2. 9 llo3 1192.65!::> 1092.373 (,8 o18 I 32.1c:r."
1968 '5'63.2'ol91 .·,·)9. 0 I 36·3 17.'i':l91 3·3 14.7 1380.9}9 1co2.377 78.6121 39.93!1969 666.0991 "))7,2 I 37•A <'1.:J'>'91 3·9 17.2 }<;6'io445 1450.726 76.3771 4?.o34;
1970 72A.5 I ")li7,Q I 40o1 21o'+ I 3.9 17 .s 1boS.a17 14>J1.cl7 74.7 I 39.9
1Cl71 '103.'1 I I.Hlo6 I 42·8 22.~ I 3.9 18.6 l67':1o66tl 1Soo.Oo9 73.3' I 40.3
".1972
..
893.1 I !.2). 3 I 4oo9 22." I s.o 17.9 176So921 1o5.2o1cl 73.<:( I 39.91973 1211.1) I 1 : .~ 1 • 5 I b•J.o 3 29.~ I b.n i'3.2 ?107o29Y '1 ':17 d.\) A5.3 I 44.0
1974 170fl.4 I t·,ii l. s I 7:!·i'l 3'•. 1 I 8.7 ('5.4 ?05'iol 1 ':let!. ':l·oc; A8.0 I 42. l3o
1975 1A49.0 I i '.1 7 2. 11 J I 9"'·2 az.~d71 49o'l 32o8 184do9'491. 1o7co1l3 94o? I A~.o'l~
-
1•no 2<;?2.2 I ;> !<J2. 0 I 11)-Jo4 110. ) . l 70. 3. 40.5 2120·2':1'11 }'-J.J7.~U?. 92.7 I 90 • .39~"
1977 313!1,11 I ]·;··2 .5 I 1.3'j. 6 15S • 7 I 96.n f>2~1 ?401.5911 21tlb·"'"'1 1 0 1 • 1 I 11 '•. 0..
1978 "ll43."' I 3 .J ~,c. J I 1 GJ otl 20 3. j I l? l ol 132.2 277Cl.83ZI 2:>11o:i.l? 1?7.4 I 139.9 1979 5;>35.1021 47'>ilo39~1 ?51 ••• 223. J•l31 1?. 3. ~ 10 i). 1 316':1.3 I 2oo1.~ I 153.9 I 133,5 1980 5A9Q.tl931 r:; l • "> • 1 0 ~ I 2'l3· 4 27o.J'~71 126·6 14 3. !:l 30?.1o39':11 2742.:; I 146.7 I 132.2..
lqfll 7117.1991 n . .,,.,. a•H I 31~·5 311o<>V11 l4b·4 165.4 3090o6 I 2nc4oU I 116.9 I 12Q.7..
1982 71•15. 0 I &!•2·3011 J47•v 3S5.·Ji91 160~4 . 194.9 2963o86JI 27lbobb31 '127oli I 140.2~~~~o~~*~*o~~*~o~~~~*~**oo~*~~**~***~**~*****~~~~*•~~*~~~**~~oooo~o~·**~*~**oo*•*o**~**~**~*****~o*~~•~o~O*~*~o·
SOURCE:
~******************a************************
********************************'***************************************************************************************************
* *
* I I I I I CAPITAL
*
*
TOTAL I•~DUST"?Y I HANUFACTJ~ING INDUSTRY I AGRICULTURE I RESinENTIALINON 8UILDINGI GOODS*
*
--- --- --- --- --- --- **
INVESTMENT I CAP.STOCK I INVESH1nJT I Cl\P.STOCK I It\VESTI.IENT I CAP.STOCK J INVESTMENT I INVESTMENT I . IMPORTS*
*
--- --- --- --- --- --- --- --- --- ** II I KI I I I'" I K!v. I IA3 I
KAG I IRf3 I INB I R1o13 *
I
*
--- --- --- --- --- --- --- --- --- **
1960 sz.9Jl I 930. 7? I 49-665 I 433·183 I 53.425 I 1031.657 I 51.377 I 108.358 I 25.583*
* 1961 98.0<t I 9')4 .]02 I 61·746 I 4A0o;;:>75 I 63.021 I 1043.095 I 5"i.414 I 136.6':)2 I 34.482
*
* 1962 12].728 I 999.6R6 I 75.361 I 498.813 I 66.652 I 10~7.5':12 I 61.156 I 152.525 I 39.032 *·
* 1Q63 135.773 I 105">.484 I 79 .3~8 I 538.;;:>96 I
* 1964 143.712 I 111'>·7":·6 I 82·114 I 573·072 I
*'
1965 ]4Fh69 I ll74·2f:t5 I 91·085'·
622·911 I*
1966 144·214 I 1224·537 I 91·852 I 6!->'+·93 I* 196 7 156.3 I l2H3 o374 I ':14·92 I 706·6">5 I
*
1968 }73.269 I 1353.973 I 111·028 I 7f>l·I51 I*
l9f>9 ?14.333 I .!.459. 9AB I 13?-1388 I 833.]47 I* 1970 222.099 I 15o5.2.S7 I 139.644 I 9()6.]39 I
*
1971 ?29.935 I 167:)·049 I 145.526 I 979-173 I* !CH2 237.383 I 1774-3?7 I 1611·041 I 10I16.8Fl I
* 1973 281.956 I 1914·317 I 167.853 I ll49.3R2 I
*
1974 253·288 I 2014·478 I lh3·24 I 1??0.672 I* 1975 267-2 I 2120·5)9 I 195·4 I 1118·418 I
*
1976 323.2 I 2274.077 l 210.6 I 14;:>3.544 I*
1977 313.7 I 2405.8'5 I 2oo.4 I 1510-06 I*
1978 384·4 I 2597.7f!2 I 2'5So3 I l644.c;c;s I '*
19?9 439.7 I 2A2'~ • 6"i9 I 292.] I 1805-?91 f* 1980 441·1 I 3Q44.JR6 I 2i33o8 I 1944·667 I
* 1981 457.3 I 3?58-135 I 280·1 I 2069·194 I
* 1982 444.i) I 3441.4A4 I 263.0 I 2166.658 I
SOURCE:
DEPT. OF FINANCE DATABANK·
73 .]35 I 1077.d'+7 I 71.305
81.:,94 I 1105.648 I 89.233
7f...76h I 1127.132 I 101',.753
8}.694 I 11:,;:>.469 I 97.586
75.729 I Il7o.S74 I 114.088
89.474 I l2l)l.52 I ]]Q.181
99.07 I 124o.Sl3 I 12"> .292
94.&92 I 1273 • .38 I 12C:..7
9<;.749 I 1305.4::>9 I 150.5
104.05 . I 1344.236 I 191.3
113.424 I 13':JQ.44cl I 21Q.2
97.~91 I 1418.tll6 I 24?.3
101.8 I 1449.675 I ?09.7
13S.7 I 1::.12.d':fl f 21?.6
150.1 I 15'::16.346 I 221'1.8
16?.8 I 1&79.3ctl I 265.4
190.9 I 17b6.2b2 I 304.9·
149.3 I 18'+6.248 I 256ol
143.3 f 18'J7.2.36 I 256.7
121.0 I -1923.374 I 227.0
I 169.222 I
I PH.o6 I
I 201.111 I
I ]91.523 I
I 199.873' I
I 242.8'•7 I
I 329.963 I
I 334.6 I
I 351.8
I 185.5
I 489.0
I 442.8
I 425.8
I 502.4
I 540.0
I 644.4
I 695.7
I 612·0
I 640.6
I 608.0
**************O*******************
*
-·
*
*
*
*
Ti\HLE
i4
AGRICULTURAL DATA
*
*
*
*********'************************
**********************************************************
*
*
*
VALUE
AU ClEO E~WLOYMEr'iT ~~*
---~---~----·
~~*
CoNSTANT
1975PRICES
ITHOUSAND::i
*
*
--- ---
{~~~ £
MILLI0N
~-*
~---~-"~EAG
{~*
QAG -~~it
---~-
---
{~*
1960 4 0 5., 1~b3!
370.06 -~·*
1961 409.,,~91 I 360ol*
*
1962 412 .. 7;;1 I 351.3*
*
1963 405.655 I 343c5*
*
1964 424 .. 259 I 334o8*
*
1'965 408.532 I 321.4*
*
1966 407.0?6 ! 315 .. 5*
*
1967 419.,Lldl I 302.7 {}*
1968 444.01Lt I 292 .. 0*
*
1969 lt34.d08 I 281.7*
*
1970 4'+6.-,!
268.0*
*
1971 4 73 •. ~ I 258.1 {}{.
1972 509.8 I 252.4 {}*
1973 494 .. 9!
245.8 {t*
1'974 531.13 I 241o0*
*
1975 589.2 I 238.0*
{t 1'976 525 .. 3 I 232oO
*
*
1977 576.:: I 228.,0*
*
1978 585 .. 7 I 226oO {}*
1'979 513.9I
221o0*
*
1980 554.1 1. 2o9.o*
*
1981 525.1 I l96o0*
*
f982 574.0 I 193.0*
*
*
**********************************************************
SOURCE:
DEer. OF FINANCE DATABANK•
*************************l'*****<~*****************~*******~*****v*******************************************************
*
*
FOOD DRINK + TOBBACOI RAiv MATt:.RIA'-::, I ENERGY I MANUFACTURED GOODS I SERVICES
*
*
*
*
*
--- --- --- ---
FD'...!~10 l FOW~I24 FD•'M)F FOo;~159 ~---~---*
I FD"iMS
*
---~--- --- --- --- --- *
*
1960*
1961*
l9f>2*
1963*
19n4* 1965
* 1966
*
1967* 1963
* 1969
* 1970
*
1971* 1972
* 1973
*
1974*
1975*
1976* 1977
*
1978*
1979*
1980*
1981*
1982* 152.9"34 156.93 161-1:12 166.623 I75.n••2 1 7B ol ·l<t
l 79. 4-~:3
132o1q} 197.320 205.617 210.;?7'3 214.i74 224.5:3'3 242.807 251.410 234.QJ2 239.322 262.9~3 280.91!) . 28i3.8l
291.8)::; 304.? 305 .R-:l<t I I I I I I I I I I I I I I I I I I I I I I I
41.633 I
44.'=>74 I
45.748 I
48.79 I
52.752 I
54.505 I
';;4.dl)l I
58.895 I
66.712 I
73.741 I
75.646 I
77.438 I
83.275 I
9Q.:359 I
93.397' I
86.617 I
92.597 I
106.629 . l
116.375 I
126.005 I
125.901 I
,l27.1:H:l6 I
126.221 I
123.AB5 I 493.21 I 7~.398 *
135.54E I 542.729 I. 78.013
*
141 • .:;1:: I 56~oQ73 I. 1:}5.748 *
14tl.66 I 617.238 I 94.67 *
162.152 I 677 .• 045 ! 102.5)8 *
16i<.A37 I 70~·205 I lOA.087 *
174.343 I 713.1713 I 114.032 *
I82.n3:: I 764.b51:} I 107.993 *
200.71:: I 88::,ob36 I 12?.3':1 *
211',.333 I 1012.762 I 12?.?.7 *
223.48S I 1042.47'1- I 11':1.122
*
230.2SS I lo73.774 I 117.342
*
?43.721 I 1174 ·239 I 116.407
*
26-!;.IOE I 1329.137 I 131.549
*
27?.98E I 1332 o33i:! I 135.315
*
26(!.?24 I 1257.496 I 140.798
*
?73. 752 I 139':1.302 I 140.564 *
305.915 I 1600·055 I 154.626 *
334.?44 I 1784o458 I }85.751
*
35':1.403 I 1927.817 I 215.762 *
35E-.48c I 1B8b.707 I 207.949 *
359.881 I 1938.302
'
1':17.275*
3b5.216 I l89CS.515 I 189.382 *
*
*********************************************************************************************************************** SOvRCE:
OEPr. OF FINANCE DATABANK·
wHE~ USED I~ ESTIMATION TMESE DATA ARE ADJUSTED TU EXCLUDE CERTAIN
VA~IABLES.FOR EXAMPLE IN ThE RAW HATERIALS IMPORT~ EQUATION
RESIDENTIAL RUILDING IS E~CLUDE~·THIS Is DONE 8Y ~U8THACTING FRO~
FD~M24 IR~*wEIGHT HrlERE Trl~ WEIGHT IS JIVEN IN TAdLE 3.2 IN THE TEXT. XI IS EXCLUDED FROM FDWM5~ AND MTO IS EXCLUDED FRUM FDW~S·
!).)
***************************************************
*
*
*
*
*
*
TA8LE 16 EXPORT DATA
£ MILLION
21
***************************************************
*****************************************************************************
,it
*
~ VALUE,£ MILLION VOLUME £ MILLIO~
*
I} 1960
,, 1961
~· 1962
;} 1963 :} 1964
~ 1965
I 1966
l} 196 7
ll- 1968
I} 1969
l< 1970
t} 1971
~ 1972
*
1973 lr 19"74)} 1975 } 1976
~ 1977
:!- 1978
:j. 1979
!} 1980
it- 1981
' 1982
',} 1983
;r
~---~---~---
--- *
ENEflGY - COAL ENERGY - TOT ;~L INDUSTRIAL
--- --- --- *
XSIT3VXI
*
--- --- --- *
0.4'~50.863 0.722 0. 7H'1
0.6.:12
0.7~)3
0 0 8'+2
0.76 0. 7 d'~
1. 021 .1.70<3 1. 8·19 3 .. i?.6 3.225 3.9':1 5. 3'~
5.6'.30 7.414
8.oo?
B.Sbb 7.2.74 9.,653 10.71 11.929 I i I I I I I I I I.. I ... I I I I I I I I I I I I I 4.697 4" 25 .,
3.38 4.025 2.888 3.o28 2.213 6.7 3.779 4.399 6.393 6.565 6.331 6.652 14.854 19.093 12.303 16.706 12.165 16.661 26.723 31.637 36.016 79.499 l I I I I I I I I I .I I I I I I I I I I I I I I 154.707 156.412 172.36 192.346 255.42 296.642 345.69 390.881 459.655 493.563 548.483 .. 575.338 660,.94 767.38S 819.301 f\01.7 928.38<; 1125.79 1250.982 141:3.275 1523.642 1659.24<; 1838.384 2118.397
*
*
*
*
*
.U·*
*
*
*
{}*
*
{~*
*
*
*
*
*
*
*****************************************************************************
SOURCE:*
~* TOTAL I FOOD I TRA·bP. DuiP.r ALCCHOL I ENTEKTAINMENT I TRAVEL I OTHER ~
* --- --- --- --- --- --- --- *
* CVA l CF000VI\ I CTRE\1V I C.OLV I CENTtkV I COTRAVV I COV
*
*
--- --- --- --- --- --- --- ** lo53 372.626 I 137-667 I 6· 712 I 31.615 I 8.906 I 10.939 I 303.<;54 *
* 1954 379.919 I 14iJ.l6l I 8.5()1 I 32.734 I 9.422 I 11.398 I 3nh.2R3
*
* 1955 409.7<;9 I 151.71 I 9.575 I 34.97 I 9.809 I 12.247 I 331.?56 *
* 1956 412.103 I ]49.493 I 6.254 I 35.377 I 10.971 I 12.638 I 334.152
•
* l057 421.065 I 152.542 I 6e62? I 36.088 I 11·229 I 13.326 i 339.f<9/i *
* 1958 445.4SP. l ]6;::>.!;9 I 9-03R i 36.~ I "11· 1 I 14.4 06 I 3A0.314 *
*
1959 450.81;> I 165.23 I 9.577 I 37.Q I 11·3 I 14.R68 I 31'>4.167 ** 1960 480.411 I J70oC93 I l?.o47
,.
40.7 I llo8 I 17.349 I 383-191 i )* 1961 506.74P. I 174.'+06 I 12-969 I 44.2' I 11-8 I 17.776 I 403.703
*
* l%2 546.3;:>3 I 182·1:!28 I 14·465 I 51.} I 12·5 I 19.4S9 I 4?9.598
*
*
191'>3 sd2.74El I }87.724 I 16-959 I 55.;? I 13-1 I 20.347 I 454.74 ** 1964 649.697 I ?09 • .:J66 I 20·65 I 62.R I 14-3 I 23.276 I 502.77 fjo
*. l96S 68J.97i I ?21-802 I 20-85 I 68.5 I 14-7 I 24.652 I 5?.7.069 *'
* 196~ 721.783 I ?2R·J63 I 21·049 I. 73 .? I 15-1 I 26.238 I 5S4.5'l6 *
* 1967 769.671 I ?JJ.Uo4 I 22otl45 I 80.5 I 15.4 I 27.832 I 59?.993 il'
*
1968 879.046 l ?64-988 I 31·823 I 91.fl I 16·2 I 32.1 R2 I n70.741 ** i969 998.145 I ?37.119 I 37-31 I 102.7 I 18.0 I 35.702 I U.0.632 *
* 1970 1109.199 I Ji)l)o::J I 41·4 I 122.3 I 20o3 I 30.151 I. R48.94t-\
*
* 1971 1255.4 9-9 I 342.2 l 44.2 I 145. Q I 22.5 I 36.86 I 963.?38 *
* 1972 1449.0'19 i 3.3~~ ol I 58·7 I 165.~ I 24·4 I 40.585 I 1112·713
*
* 1973 1733.099 l :,92·0
.
I 83-l l 1St:.:; I 27.2 I 48.328 I 13?.2.67*
* 1974 2040.699 I ')79.3 l 83-1 ! ?3::.o I 3o.:, I 51.908 I 1569.391 ~
*
1975 2433.8Q8 I 657.8 I 92·2 I 303.3 I 37.4 I 79.4 I 1R?.7.398 ** 1976 2972.899 I 7':J7.0 I 16?·3 I :382.? I 60o8 I 90.9 I ?167.;>911 *
* 1977 --· - 359:! .399. L. -· 934 .d ·• .I ~34·5 I 422.1'\ I - - 72od I 117 .• 3 I 2£>15-398 *
* 19713 4229.098 I 1066·8 I Jos-s I 48£:.? I 91·2 I 149.1 I 3012.998
..
I
* 1979 5044.598 I 1?.69Qu I 3}2~3 !
' 574.5 ;. 110·7 I 169.6 I 3626.094 *
* 1980 5991.695 I 1472·':) I .:SJ4o6 I 695.9 I 128.0 I 214.2 .I 4355.586 *
* 19?.1 730d.492 I 1792·'=~ I .399-9 I 844.7 I 148.8 I. 262.8 I 5333.785 *
.
*
1982 8066.0 I 1977·0 I :336·0 I 1004.0 I 170.0 I 303.0 I 5906·0*
* *
*************************{'**************************************************************************************************** SOUPCEs:
COV:CVA-MTOVA-CTREQV-CALv-CEi~TERV-CUTRAVV
THE REST OF THE DATA ARE TAKEN FROM TrlE DEPARTMENT OF FI~ANCE DATABA~K.
~·~•****************************************
*
*
* TABLE 18 *
* CO~SUMPTICN DATA *
* VOLUM::..,CONSTA~T 1975 PRICES• £ MILLION •
*
*
*
********0***********************************
***********************•·~~····•*************************************************************************************~*********
* *
* TOTAL I FOOD I TRAf'lSP. EOUIP. I ALCCHOL I ENTEHTAINMENT I TRAVEL I OTHER
*
*
--- --- --- ----~--- --- --- --- **
c
I CFOOO I CTREQ I