2019
From purchase, usage, to upgrade — Consumer
analytics using large scale transactional data
Xinxue Qu
Iowa State University
Follow this and additional works at:https://lib.dr.iastate.edu/etd Part of theDatabases and Information Systems Commons
This Dissertation is brought to you for free and open access by the Iowa State University Capstones, Theses and Dissertations at Iowa State University Digital Repository. It has been accepted for inclusion in Graduate Theses and Dissertations by an authorized administrator of Iowa State University Digital Repository. For more information, please [email protected].
Recommended Citation
Qu, Xinxue, "From purchase, usage, to upgrade — Consumer analytics using large scale transactional data" (2019).Graduate Theses and Dissertations. 17079.
by
Xinxue Qu
A dissertation submitted to the graduate faculty
in partial fulfillment of the requirements for the degree of
DOCTOR OF PHILOSOPHY
Major: Business and Technology (Information Systems)
Program of Study Committee: Zhengrui Jiang, Major Professor
Joey F George Abhay N Mishra
Zhu Zhang Wei Zhang
The student author, whose presentation of the scholarship herein was approved by the program of study committee, is solely responsible for the content of this dissertation. The
Graduate College will ensure this dissertation is globally accessible and will not permit alterations after a degree is conferred.
Iowa State University
Ames, Iowa
2019
TABLE OF CONTENTS
Page
LIST OF FIGURES ... iv
LIST OF TABLES ... v
ACKNOWLEDGMENTS ... vi
ABSTRACT ... vii
CHAPTER 1. GENERAL INTRODUCTION ... 1
CHAPTER 2. PROJECT-ORIENTED RECOMMENDATION BASED ON ASSOCIATION RULES ... 4
Abstract ... 4
Introduction ... 5
Related Studies ... 7
Problem Description ... 14
Project-oriented Rule-based Recommendation ... 21
Experiment ... 25
Conclusions ... 30
References ... 31
CHAPTER 3. PREDICTING TIME TO UPGRADE UNDER SUCCESSIVE PRODUCT GENERATIONS ... 36
Abstract ... 36
Introduction ... 37
Related Literature ... 39
Time-to-Upgrade Model Development ... 45
Data Overview ... 52
Empirical Estimation ... 57
Model Extensions ... 62
Conclusions ... 68
References ... 70
CHAPTER 4. OPTIMAL MAINTENANCE POLICY FOR CONSOLIDATED DATA REPOSITORY UNDER INFINITE TIME HORIZON ... 74
Abstract ... 74
Introduction ... 75
Related Literature ... 78
Problem Description ... 80
Optimal Maintenance Policy under an Infinite Horizon ... 87
Policy Comparisons ... 97
Conclusions ... 101
CHAPTER 5. GENERAL DISCUSSIONS ... 104
APPENDIX. PROOFS FOR CHAPTER 4 ... 106
Proof of Lemma 1 ... 106
Proof of Lemma 2 ... 107
LIST OF FIGURES
Page
Figure 2.1 Topic-Driven Purchase versus Project-Driven Purchase ... 14
Figure 2.2 Product Category Structure ... 16
Figure 2.3 Project-Driven Shopping Transactions ... 17
Figure 2.4 Transformation from Product Matrix to Transaction-Category Matrix ... 23
Figure 3.1 An Illustrative Example of Cross-Generation Adoption ... 45
Figure 3.2 Composition of Sales for Each Game Generation ... 56
Figure 3.3 Kaplan-Meier Estimation of Hazard Rate and Survival Function ... 56
Figure 3.4 Predicted Versus Actual Monthly Upgrade Sales ... 60
Figure 3.5 AUC of Individual Upgrade Predictions by Extended Models ... 66
Figure 4.1 Problem Description: Consolidate Data Repository Maintenance ... 81
Figure 4.2 A Markov Decision Process of CDR Maintenance ... 88
Figure 4.3 Threshold Searching Algorithm Under Infinite Horizon ... 96
Figure 4.4 Maintenance Cost with Different System Check Cost ... 99
Figure 4.5 Total Maintenance Cost by Periodic Policy and Time-based Dynamic Synchronization Policy Under Infinite Horizon ... 100
LIST OF TABLES
Page
Table 2.1 Available Association Rules ... 20
Table 2.2 The Composition of Regular Customer's Shopping Basket ... 26
Table 2.3 Summary of the Retrieved Association Rules ... 27
Table 2.4 Top-N Recommendation on Different Support and Confidence ... 29
Table 2.5 Comparison Between Product Level and Multi-Level Rules ... 30
Table 3.1 Parametric Baseline Hazard Functions ... 48
Table 3.2 Measurements and Descriptions of Explanatory Variables ... 55
Table 3.3 Proportional Hazard Model Estimation Results ... 58
Table 3.4 Comparison of Upgrade Sales Predictions ... 61
Table 3.5 Estimation Results for Extended Models ... 63
ACKNOWLEDGMENTS
I would like to thank my committee chair, Dr. Zhengrui Jiang, and my committee
members, Dr. Joey F George, Dr. Abhay N Mishra, Dr. Zhu Zhang, and Dr. Wei Zhang,
for their guidance and support throughout my five years’ study at the Ivy College of
Business, Iowa State University.
In addition, I would also like to thank my friends, colleagues, the department
ABSTRACT
The amount of data businesses are collecting about their customers is staggering.
Firms can now easily track and record past purchases, product usage patterns, and
customers’ responses to marketing campaigns and promotion programs. If fully analyzed,
such rich transactional data offers companies the opportunity to understand what drives
customers’ purchase decisions, how to improve consumers’ shopping experience, and
how to develop and retain loyal customers. My dissertation addresses these issues by
applying consumer analytics, including association rule mining, survival analysis,
econometrics, and optimization, on large-scale transactional data to help companies better
understand, predict, and subsequently influence the consumption behavior of their
customers.
My dissertation comprises three essays. The first essay utilizes multi-level
association rule mining and proposes a project-oriented recommendation method to
predict next purchases for inexperienced consumers. In the second essay, I propose an
Expo-Decay proportional hazard model and use customers’ adoptions and usage of
previous product generations to understand and predict their upgrade behaviors for the
current product generation. In the third essay, a time-based dynamic synchronization
policy is applied for the maintenance of consolidated data repository under an infinite
planning horizon.
In these essays, I apply and extend a variety of business analytics tools including
data mining (association rule mining and collaborative filtering), survival analysis,
dynamic programming, simulation, and econometric methods. These essays contribute to
make informed decisions on cross-generation product development, product promotion
CHAPTER 1. GENERAL INTRODUCTION
Analytics has become a new source of competitive advantage for organizations. For
the past few decades, organizations have implemented various information technologies to
support business operations and decision makings. In the age of Big Data, the amount of
information businesses have collected is increasing exponentially. The development of
advanced analytic tools provides organizations more opportunities to utilize the information
resources to gain more competitive advantages. However, consumers’ decision making
processes (including first time purchases and product/service upgrades) are not fully
discovered. My dissertation extends our understanding about consumers’ decision-makings
and develops consumer analytic tools to better understand, predict, and subsequently
influence the consumption behavior of consumers.
My dissertation comprises three essays. The first essay develops a recommendation
method to predict project-oriented purchases to assist inexperienced consumers to make their
decisions. The recommendation is based on frequently purchased product sets learnt from
large-scale transactional records. The second essay proposes a survival analysis framework to
understand and predict existing users’ product upgrade decisions and identify
experience-related factors that impact the upgrade behavior of existing users. To achieve a high accuracy
of prediction and precisely understand consumers’ decision makings, the quality of data
collected significantly influences the quality of results generated by these analytic tools.
Therefore, the third essay extends a time-based dynamic synchronization policy to an infinite
planning horizon to schedule the maintenance of consolidated data repository by striking a
balance between synchronization costs and losses incurred by poor decisions made on the
A variety of business analytics tools have been applied and extended in my
dissertation. In the first essay, association rule mining algorithms are applied to search for
frequently purchase products from the historical transaction records, and then the
collaborative filtering method is adopted to utilize the product category hierarchical
information in the recommendation model. The evaluation is based on Top-N item prediction
using precision and recall. In the second essay, based on the survival analysis (specifically
the proportional hazard mode), I propose an Exponential-Decay proportional hazard model to
estimate and predict the upgrade timing of existing users. Random effect model and point
process model extensions are developed based on the baseline framework to address some
econometric concerns. In the third essay, the consolidated data repository maintenance is
modeled as a Markov decision process, and the dynamic programming method has been
applied to develop an algorithm to search the optimal control limits. In policy comparisons,
simulations are conducted to evaluate the cost-savings with benchmark policies.
My dissertation contributes to the consumer analytics literature by proposing various
analytics tools to understand and predict consumers decision makings, from first-time
purchase to product upgrade decisions. Moreover, an optimal data repository maintenance
policy developed to address the data quality issues in analytics applications. These findings
also carry some managerial implications. The recommendation method shows the importance
of product category information and also provides a solution to data sparsity issues when
dealing with transactional data in practice. The upgrade timing analysis can help companies
with customer retention. The importance of previous adoption and usage experience provides
data repository maintenance policy provides data-driven analysis or research with some
implications about the importance of data quality in decision makings.
In summary, my dissertation applies consumer analytics, including data mining,
statistical learning, econometrics and optimization, on large-scale transaction records to help
companies better understand consumers’ decision makings, and subsequently predict and
CHAPTER 2. PROJECT-ORIENTED RECOMMENDATION BASED ON ASSOCIATION RULES
Modified from a manuscript to be submitted to INFORMS Journal on Computing
Xinxue Qu, Zhengrui Jiang, and Zhu Zhang
Ivy College of Business, Iowa State University, Ames, IA, USA
Abstract
The recommender system has been used as a tool in E-commerce for a long time.
There are a lot popular algorithms generating reliable recommendations, like collaborative
filtering and association-rule-based method. However, “Buying mistakes” are still the top 1
retail pain. The assumption that a customer’s future purchase can be predicted using his/her
taste/preference retrieved from the historic record may not hold when the customer’s
purchase is driven by the on-going project. The products purchased previously may have
very low similarity with products needed in the future, which means the traditional
collaborative filtering method will not work well in the project-driven scenario. Moreover, in
real world, when the company has a great variety of products, the data sparsity problem
makes association-rule-based method less useful. Therefore, in this study, we propose an
association-rule-based method by utilizing the product category information to measure the
similarity between products sets and generate high-quality project-oriented recommendations
for customers.
Introduction
According to the latest report from Gartner, Inc., the global revenue in the business
intelligence (BI) and analytics market is forecast to reach $16.9 billion in 2016, an increase
of 5.2 percent from 2015. The great potential in the analytics market is inspired by the
abundant data related to the customers or agents in business. For decades, companies have
accumulated huge amount of information related to the customers and the business process.
Recently, with the data mining and machine learning techniques, the business analytics
toolkits can help squeeze information out from each bit of data stored, which can be directly
linked to marketing profitability and efficiency (Blattberg et al. 2008).
The recommendation system is one of the widely applied toolkit for firms customize
their marketing effort to targeted consumers. Matching the customers with the most
appropriate products will enhance consumer satisfaction and loyalty. According to
Hosanagar et al. (2014), 60% of the Netflix rentals stem from recommendations, and 35% of
Amazon’s sales are generated by their recommendation system. Among the recommendation
algorithms, the most popular ones are content-based filtering, collaborative filtering (e.g.
matrix factorization), and association-rule-based methods (Ghoshal et al. 2015). In this study,
we mainly focus on providing high quality association-rule-based recommendations.
However, with the recommendations from these popular systems, customers still
make the “wrong” purchasing decisions in the shopping trips. Every year, product returns
cost U.S. manufacturers and retailers $100 billion in lost sales, transportation, handling,
processing and disposal. Customer returns can reduce a manufacturer's profitability by an
average of 3.8%. (Blanchard D. 2007) According to the recent study by Petersen and Kumar
(2015), the percentage of customers who returned a product during their relationship with the
customers returned a product; for a high-tech business-to-business firm, 64% of customers
returned a product; and for a general merchandise retailer, 75% of customers returned a
product. Even professional customers make mistakes in purchasing products for a project. (In
this study, we find 99.6% of professional consumers have returned, while 48% regular
consumers have returned.) Therefore, more work need to be done to improve the quality of
recommendations.
Market basket analysis is a well-known data mining technique by studying what
products consumers purchase together, which could help retailers discover cross and
up-selling opportunities, develop promotions, determine product placement, and optimize the
inventory. (Askar 2016) Using data mining techniques to analyze shopping basket data can
help better understand customers’ purchase behaviors and empower the customers to buy
“smarter”. According to the interviews by the Fact Point, among the over 50 retailers with
revenues from $400 million to $24 billion, “Buying mistakes” are the top 1 retail pain
(Gordon 2008). The primary objective of this study is to use the information from the
potential ongoing projects hidden in the transaction records, and predict the future
project-driven purchases.
To help the consumers identify what they really need, this study will develop a
recommendation method using the on-going project information based on the association
rules. Since each shopping basket is composed of products that are oriented toward one or
multiple potential ongoing “project”, the recommendation will rely on the similarity
computed using the product(set)-based collaborative filtering methods. Meanwhile, the
product category structure will be utilized to help measure the similarity between products
The related literature will be discussed next. Then we will describe the problem to be
solved in detail. After that, we will propose the project-oriented recommendation method.
Then, we will show the description of the data and the experiment results. We will conclude
this paper with discussions
Related Studies
There are a variety of recommendation systems used in the E-commerce platforms by
utilizing the demographic information, the content, or the historical records etc. The most
successful and widely accepted methods are collaborative filtering (with matrix factorization
techniques) and association rule mining.
Collaborative Filtering
Collaborative Filtering (CF) is firstly used in an email filtering system, Tapestry, by
Goldberg et al. (1992). Different from the content filtering, which creates profiles for users
and products to characterize the nature and uses the profiles for matching, the collaborative
filtering relies on the customers’ past behavior, and analyzes relationships between users and
interdependencies among products to identify new user-item relations. The collaborative
filtering systems do not explicitly incorporate feature information, but usually incorporate the
information in preference similarity across individuals.
There are two classes of collaborating filtering methods. The first one is call
based model, which is also known as instance-based or neighborhood methods. The
memory-based models evaluate a customer’s preference for a product memory-based on the preference of
“neighboring” products by the same user (item-based) or identify like-minded customers who
can complement each other’s rating (user-based). The memory-based collaborative filtering
methods are easy to implement and highly effective. In a report by Amazon research team
clustering method and search-based method. The comparison shows that user oriented CF
method is impractical on large scale data set, cluster models hurt the recommendation quality
and search-based models fail to provide recommendations with interesting, targeted titles,
while the item-based collaborative filtering method is efficient and provide high quality
recommendations. Therefore, this study will extend the item-based collaborative filtering
method.
Another group of methods is call model-based algorithms. These methods compile
the available user preferences into compact statistical models from which the
recommendations are generated. The most popular ones include singular value
decomposition to identify latent structure in ratings (Billsus and Pazzani 1998); probabilistic
clustering and Bayesian networks (Breese et al. 1998); dependency networks (Heckerman et
al. 2001); latent class models (Hofmann and Puzicha 1999) and latent semantic models
(Hofmann 2004) to cluster the ratings; and flexible mixture models to separately cluster users
and items (Si and Jin 2003). Unlike the instance based approach, the model-based algorithms
are slow to train, but once trained, they can generate recommendations quickly.
With the success of the Netflix competition (Koren et al. 2009), the matrix
factorization models are getting great attention. The matrix factorization model belongs to
the latent factor models. The latent factor models try to explain the ratings (or preference) by
characterizing both products and consumers on factors inferred from ratings patterns. For
products, each factor measures the item’s characteristic in that dimension. And for
customers, each factor denotes how much the customer likes the product on the
corresponding attribute. Based on that, the matching between products and customers would
realization of latent factor models is based on matrix factorization. The matrix factorization is
a technique for dimension reduction. Besides the explicit rating information, the matrix
factorization model allows incorporation of addition information, like implicit feedback
including customers’ purchasing history, browsing history, search patterns. The extension of
the matrix factorization model includes adding item/user biases and considering temporal
dynamics (item’s popularity changing over time and users’ baseline changing over time).
The fundamental assumption of the collaborative filtering method is that if users X
and Y rate n items similarly, or have similar behaviors (e.g., buying, watching, listening),
they will rate or act on other items similarly. Then we could use the explicit (eg. rating or
reviews) or implicit (e.g. browsing or purchasing behavior) information to collaborate the
user’s preference and then make recommendations based on that. However, users’ need may
change over time, and this phenomenon is quite often when the customer’s shopping is
heavily driven by the task or project they are working on. In this scenario, the user-item
based collaborating will not work well since what customers have purchased may share low
similarity with future purchase. In this study, we will extend the user/item-based
collaborative filtering method to itemset-based collaborative filtering. The assumption is that
the products purchased can reflect the need or preference relationship between the on-going
project and the products set. Although we could not directly identify the on-going project, we
can partially recover the project’s information from the frequent purchased products-sets.
And the proposed method will generate more reliable project-oriented recommendations.
Association Rule Mining
The association rule mining is firstly proposed by Agrawal et al. (1994), which
initializes the field of association rule mining. After that, researchers endeavor a lot to
algorithms (e.g. FP-tree by Han et al. 2000, PRICES algorithm by Wang and Tjortjis 2004)
to enhance the original design. But the detail of the algorithms is not what we will discuss in
this study. The passing decades have witnessed this method becoming an interesting and
well-established area, which studies the co-occurrence relations and patterns among
variables/items in large databases. At the beginning, this method is mainly used in the area of
market basket analysis in business. After years’ development, this method has been applied
in broader areas including crime pattern mining (Usha and Rameshkumar, 2014), disease
symptom predication (Mocormick et al. 2011), fraud detection (Phua et al. 2010), etc.
To generate interesting rules to guide the business, various measures have been
developed, including support, confidence, lift, conviction, etc. Lallich et al. (2007) draw a
summary of the association rule interestingness measures. They argue that researchers or
practioners have to choose the measures best suited to the problem, not limited to the
Piatetsky-Shapiro schema (using the support and confidence), and validate the interesting
rules against the measures. The measures themselves could only reflect partial information in
the dataset, so more metrics need to be developed to recover the full information related to
the frequent patterns.
Above that, there are a lot variations and extensions on the market basket analysis.
Generalized association rule mining with product category information can discover more
useful knowledge by taking application specific information into account (Thomas and
Sarawagi 1998). Spatial database (Koperski and Han 1995) also includes the location or
geographic information. Temporal association rule mining takes the time of the itemsets into
Besides the traditional mining on the Boolean attribute values, there are a stream of studies
discussing the quantitative association rule mining.
Shopping basket analysis produces the best results when the items occur in roughly
the same number of transactions in the data. This helps prevent rules from being dominated
by the most common items. Also for companies having a rich product variety, the association
rules generated at the product level may be of less interests. Therefore, the product
hierarchical structure can help here. By rolling up rare items to higher product cateogry
levels in the hierarchy, the rules will become more frequent. More common items may not
have to be rolled up at all. Nevertheless, in the hierarchical higher level, still some
segment/line dominate. There are ways to deal with the problem with uniform
support/confidence using group based measure or reduced min support at lower levels
transaction (Han et al. 2011).
Association Rule-based Recommendation
In this study, we will not focus on how to efficiently retrieve association rules from
the transaction data set. The goal is to discuss how we should utilize the association rules to
generate high quality recommendations for customers and empower their purchasing
decision-making.
The Association Rule based collaborative filtering algorithms are more often used for
top-N recommendation tasks than prediction ones. Sarwar et al. (2000) describes their
approach to using a traditional association rule mining algorithms to find rules for developing
top-N recommender systems. They find the top-N items by simply choosing all the rules that
meet the thresholds for support and confidence values, sorting items according to the
confidence of the rules so that items predicted by the rules that have a higher confidence
recommended set. Fu and Han (1995) develop a system to recommend web pages by using a
priori algorithm to mine association rules over users’ navigation histories. Leung et al. (2006)
propose a collaborative filtering framework using fuzzy association rules and multi-level
similarity. Other model-based CF techniques include a maximum entropy approach (Pavlov
and Pennock, 2002), which clusters the data first, and then in a given cluster uses maximum
entropy as an objective function to form a conditional maximal entropy model to make
predictions.
Zaïane (2002) propose a method that finds all eligible rules (rules whose antecedents
are subsets of the basket and whose consequents are not) and recommends the consequent of
the eligible rule with the highest confidence. Wang and Shao (2004) suggested considering
only maximal rules, i.e., eligible rules whose antecedents are maximal-matching subsets of
the basket. All these approaches focus on identifying a single rule to make the
recommendation. The recommendation is made on the partial information—items not present
in the maximal rules used are ignored. The set of eligible rules often contains multiple rules
with the same consequent, and the quality of recommendations could improve by combining
such rules effectively.
The notion of combining rules has been explored in a few studies in the past. Given a
customer’s basket, Lin et al. (2002) calculate the score for each item as the sum of the
products of the supports and confidences of all eligible rules with that item as the consequent.
The item with the highest score was recommended to the customer. Wickramaratna et al.
(2009) present an approach to identify rules that predict the presence and absence of an item,
and proposed a Dempster–Shaffer-based approach for combining rules when some rules
However, they noted that their approach is not scalable for real-time applications. Ghoshal et
al. (2015) proposed an algorithm to search for the admissible group for the predicted item,
and recommend the item which could give the highest mutual information value. Although
these methods all try to improve by combing more eligible rules, Liu’s method consider all
eligible rules without any weights to measure the match between the basket and the eligible
rules, so this method will add a lot noise and lead to low quality recommendation. Ghoshal’s
proposed method has a strong restriction that the admissible group is composed of disjoint
rules, which lead to a loss of information from other related rules.
In real world, the data sparsity could be a big challenge for utilizing the rules. For a
company with a rich product variety, the frequent product purchasing patterns may not cover
all products. It’s highly possible that given the basket, we could not find enough eligible
rules for the recommendation generation. Ziegler et al. (2004) propose a hybrid collaborative
filtering approach to exploit bulk taxonomic information designed for exact product
classification to address the data sparsity problem of collaborative filtering
recommendations, based on the generation of profiles via inference of super-topic score and
topic diversification. The relationships between super-concepts and sub-concepts provide
powerful inference opportunities for profile generation based upon the classification of
products that customers have chosen.
Based on the literature, we are interested in using the retrieved association rules to
make project-oriented product recommendation. The basic assumption in this study is the
occurrence of the frequent products patterns is largely driven by the on-going projects. This
study is trying to make recommendations for customers based on the match between the
product categorical information as a way to deal with the data sparsity problem and measure
the similarity between products-sets.
Problem Description
Based on the literature, most of the existing studies developed recommender systems
using explicit information. Even if using implicit information from the customers’ browsing
or purchasing history, the products they studied were either movies or book. This is because
these products belong to the same functionality category and the customers’ preferences or
tastes play a key role in determining their purchasing decisions. For these products, we could
infer customers’ preference based on their transaction record and use this preference
information to predict the future purchasing decisions. So we classify these products into
topic-driven purchasing category. Music, movies, and books, etc. could be classified in this
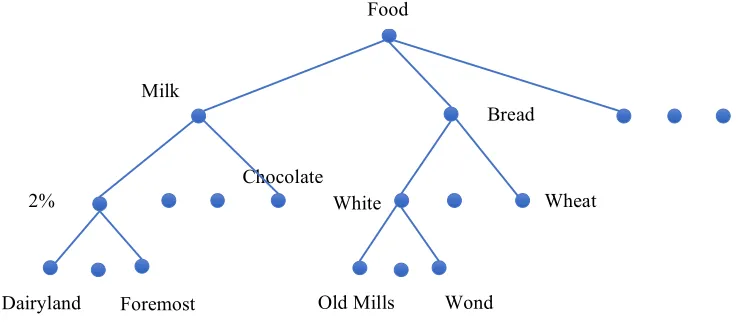
[image:23.612.111.510.405.640.2]category.
Figure 2.1 Topic-Driven Purchase versus Project-Driven Purchase
Another group of products, which is driven by the function or task, can be taken as
project-driven products. For the appliance and electronic products, the customer may work
on building up a home theatre, so his/her purchase may be related to DVD players, speakers
and cables. But later next month, the customer becomes interested in updating her desktop.
Then the transaction in the following month could be hard drives, monitors and so on. In this
project-driven scenario, the products bought for the former project would have very low
similarity with the products for the later one. Thus we cannot rely the transaction data to infer
customers’ preference and base on the preference to make recommendations.
In this study, we propose an itemset-based collaborative filtering methods. Although
the products set purchased by the same user across time may share low similarity, the
products bundles bought by different customers working on the same project will be highly
similar with each other. The item-set based method means we could match the products in
the basket or already purchased with those in the frequent patterns, based on which we could
tell whether the focal customer is working on some project that is similar with the frequent
products bundles. Then we could make reliable recommendations for the customer.
Notations
The shopping basket and the item-set in the association rule mining is denoted as
{𝐴1, 𝐵1, 𝐷1, 𝐹1}, each character here stands for the categorical information of the product in
the hierarchical structure. And the subscript number is product’s position at the product leaf
level in the category structure. The character and the number together is the product’s SKU.
The association rule at the product level is composed by the antecedent and the consequent:
{𝐴1, 𝐵1, 𝐷1, 𝐹1} → {𝑋2}.
Companies would always keep a record of their historical transaction data, which
could use the product SKU and customer ID information with collaborative filtering
techniques to make predictions. Most firms would have a category structure to manage their
product line, so here we take the product taxonomy structure from Han et al. (1999) to
[image:25.612.128.497.197.362.2]encode the product structures (in Figure 2.2).
Figure 2.2 Product Category Structure
For example, the Old Mills Whilte bread belong under the Food category, so it could
be encoded as [Food, Bread, White, Old Mills], and in practice for simplicity this can be
transformed as a vector [1,2,1,1], similarly the Dairyland 2% Milk can be encoded as
[1,1,1,1]. Each element in the encoded vector stands for which class/category the product
belongs to at that product category level. And for a higher subcategory, the chocolate is
encoded as [1,1,4, *], where the unknown leaf is replaced with *.
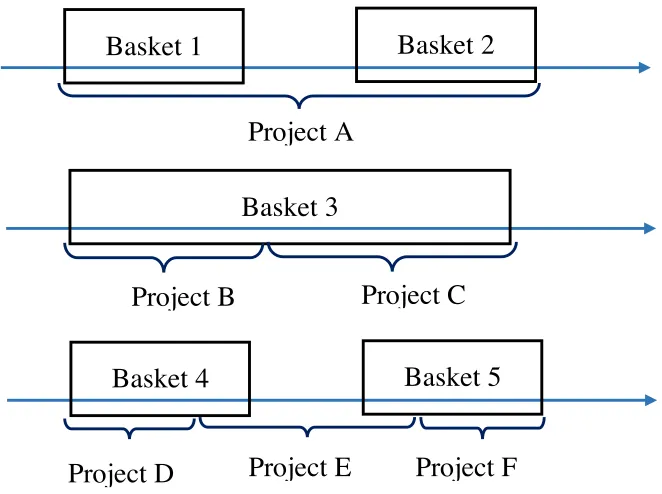
Project-driven Transactions
In this study, we’d like to analyze the interesting patterns from the project-driven
transactions. The most ideal case is each shopping basket is composed by products for one
project.
Chocolate
Wheat White
Food
Milk
Bread
2%
However, most customers may not have a perfect shopping list when they prepare for
the project. The complexity of the problem is that the customer may purchase products
related to one project in sequential shopping trips. As shown in the following Figure 2.3, the
first scenario is that the customer is not an expert in doing the project. It’s highly possible
that in the first shopping trip, he/she doesn’t get all what he/she actually needs. Then the
customer need to make consecutive shopping trips to make up for the missing products they
need for the project.
Another possibility is that the customer may get involved in different projects during
a period of time. For example, when a customer buys a new house, he/she may need to
redecorate the house by replacing the floor board and paint the wall. Thus in one shopping
transaction, the customer may purchase products related to both projects.
And the hybrid of the two scenario mentioned above is possible when the customer
[image:26.612.149.480.427.674.2]buys products for several on-going projects in consecutive shopping trips.
Figure 2.3 Project-Driven Shopping Transactions
Basket 1
Basket 2
Project A
Basket 3
Project B
Project C
Basket 4
Basket 5
Therefore, it is hard to identify the on-going projects from the raw transaction
records. However, when there are large amounts of customers’ transaction records, some
products-sets (core products in the project) will occur frequently in the dataset.
In developing recommendation system, we need to try to identify what project(s) the
customer is currently working on based on the products in the shopping cart, and then
recommend the most likely useful product (for the related project) to the customer. The
complexity of the multiple trips with multiple projects leads to fragments of the products sets
for one project falls into multiple frequent item set (in multiple association rules). Hence, the
probability we can identify what exactly is the on-going project is very low. However, the
association rule mining method could help partially recover the partial information of the
project. By comparing the existing shopping basket with the frequent pattern fragments, we
could identify a proportion of the on-going project. Then using similar neighbor methods
from collaborative filtering, we could provide reliable recommendations for the customer.
Data Sparsity Challenge
Another hurdle in item recommendation is some products may be functionally
substitutive to each other, so for the same project, different customers may select different
products according to their preference or brand loyalty. When the company has a rich
product lines, there will be large number of substitutive products for the same function. If
one functional category has thousands of products (varying in size, versions, or brands, etc.)
serving the same function, there is a great chance that each single product may be purchased
less frequently. Therefore, the frequent products set (association rules) we get at the product
level will be of very low support. Such information would be ignored if we set a high
However, when given the product category information, we may find that product in
the same level subcategory would be highly substitutive to each other. Like the product
category tree structure in Figure 2.2, Dairyland 2% milk is highly substitutive to Foremos 2%
milk.
Given the shopping basket {𝐴1, 𝐵1, 𝐶1}, we have to recommend products the
customer may need. Assume in the association rules set, we have {𝐴1, 𝐵1, 𝐶1} → {𝐷1} and
{𝐴1, 𝐵2, 𝐶1} → {𝐷1}. Current methods would just take the information from the first rule to
predict the related products, since {𝐴1, 𝐵1, 𝐶1} is a perfect maximal eligible rule for the
basket. However, the second rule also give some “support” based on the basket, because item
𝐵2 and 𝐵1 belong to the same subcategory and they may perform the same function in the
project. For example, customers who are working on their garden have purchased spade, rose
seeds and fertilizer would purchase water pipe. Another group of customers may buy spade,
tulip seeds, fertilizer and water pipe together. If the given shopping basket has spade, rose
seeds and fertilizer included, considering both frequent patterns may be helpful for the
prediction, although the second pattern is not exactly an “eligible” subset of the basket.
Association Rule-based Recommendation
Companies always keep a record of the customers’ historic transaction data. Based on
the transaction records, the association rule mining method could generate interesting
shopping pattern. The task of the itemset based recommendation system is given the
shopping basket, {𝐴1, 𝐵1, 𝐶1}, how to utilize the information from the rules and predict
which product(s) will be added into the shopping cart.
There is prior knowledge about the product category structure, like product B1 and
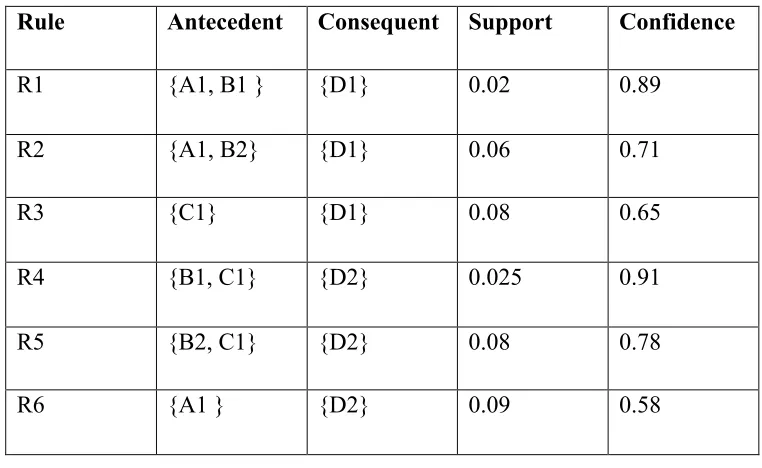
Table 2.1 Available Association Rules
Rule Antecedent Consequent Support Confidence
R1 {A1, B1 } {D1} 0.02 0.89
R2 {A1, B2} {D1} 0.06 0.71
R3 {C1} {D1} 0.08 0.65
R4 {B1, C1} {D2} 0.025 0.91
R5 {B2, C1} {D2} 0.08 0.78
R6 {A1 } {D2} 0.09 0.58
In brief, the problem is that given the association rules and the products current in the
shopping cart, how to measure the similarity between the basket and the rules and use the
information from rules to generate high quality recommendations.
In Ghoshal et al. (2015), the basket is decomposed into admissible groups and select
the admissible group that gives the largest mutual information. For example, given the
information in the table above, we have the admissible group {𝐴1, 𝐵1} and {𝐶1}
recommending {𝐷1}, and another group {𝐵1, 𝐶1} and {𝐴1} referring to {𝐷2}. By comparing
the two groups’ mutual information, we could decide whether to recommend {𝐷1} or {𝐷2}.
However, in this study, we want to extend the admissible group method by taking the
substitutive information from the product category. Although R2 in Table 2.1 may not
directly contribute to the reliability of the first admissible group (not an exact subset of the
basket), when B1 and B2 are substitutive to each other, the R2 would support the
that taking this information into consideration would change the order of the
recommendation list.
Project-oriented Rule-based Recommendation
This study aims to predict what the customers will purchase based on the composition
of the customer’s shopping basket. In the life time of the customer, he/she could only work
on one specific project once, therefore, the transaction history may not help in prediction
what the customer will work on in the future. So the traditional item-based collaborative
filtering method, which makes recommendations from similar products based on the historic
transaction records would not work here. Also the item-based method usually utilizes the
co-purchase information between two products, while neglecting the joint distribution of
products in the set. In this section, we will use the association rules, which capture the
co-occurrence of a bunch of products in the transactions, as the prior knowledge for
recommendation generation.
Generate Association Rules Set
Since our proposed recommendation algorithm is based on the association rules, the
first step is to generate association rules. The Apriori algorithm, FP-tree method and other
algorithms only differ in the efficiency or computing cost and memory cost, which will not
affect the set of rules we can get.
In traditional association rule mining, usually the threshold of the support and
confidence is set by consulting the experts in the industry. By including the product category
structure, less frequently purchased products may also contribute to the support of a higher
level product sub-category. Therefore, we should set a low threshold for the support in case
40%, 50%), which means given the antecedent, we can make a correct prediction on the
consequent at a 30% (or 40%, 50%) probability.
Similarity between Product Sets
When generate recommendations, the prior knowledge we have is the products in the
current shopping basket and the association rules retrieved. To utilize the association rule, we
should know how similar or close the frequent patterns in the rules are with the products set
in the basket. Or in other words, to what extent the information from the rules can be applied
in analyzing the shopping basket.
Similarity Metric
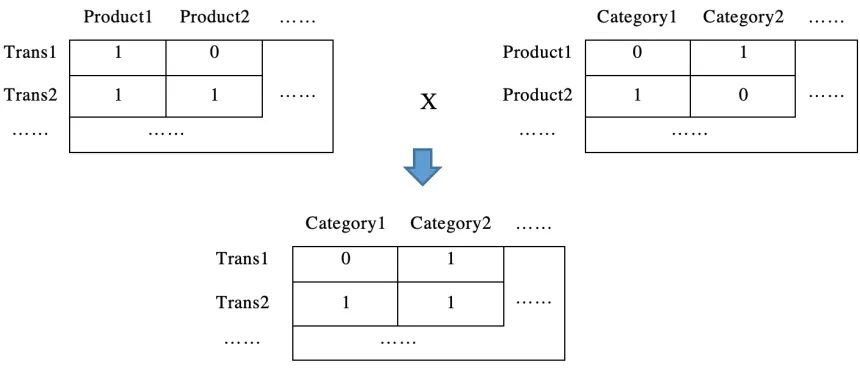
In the literature, the item-based collaborative filtering methods usually transform the
transaction records into an item-item co-purchase matrix. In another way, the transaction
records could also be transformed into a transaction matrix: each row stands for one
transaction, and each column stands for one product/item, and the binary (0-1) denotes
whether the product is purchased in the transaction or not. Similarly, the current shopping
basket and the antecedent of the association rule can be conceptualized as a product vector.
Since in this study, we try to utilize the product category information in measuring
the similarity between products sets, we could construct a product-category matrix, which
denotes the “belonging to” relationship between products and the category.
Based on the literature, there are widely used measurements for the similarity
between vectors— Person Correlation and Cosine Correlation. Here we have two product
Pearson Correlation:
𝐶𝑜𝑟𝑟2,9 = @=AB(;<=>;<)(;?=>;?)
;<=>;< C @
=AB @=AB;?=>;?C
(2-1)
Cosine Correlation:
𝐶𝑜𝑠2,9 = 2∙9
2 ∗ 9 (2-2)
The cosine correlation measures the angle between the two product vectors, which
equals the dot product of the two vectors divided by the product of their scales.
In this proposed recommendation methods, we’d like to utilize the product category
information and construct the transaction-category vector. For example, given we have the
transaction-product matrix, and the product-category structure, we could generate a
transaction-category matrix which capture what categories have been purchased in the
[image:32.612.100.530.423.608.2]transaction as follows:
Figure 2.4 Transformation from Transaction-Product Matrix to Transaction-Category Matrix
Based on the transformation above, we can get the transaction-category matrix. And
structure has three levels of category: product group, product class and product sub-class.
Each transaction/antecedent/basket can be denoted 𝐺2 = (𝐺23, 𝐺24, … , 𝐺2H) (at group level),
𝐶2 = (𝐶23, 𝐶24, … , 𝐶2I) (at class level) and 𝑆2 = (𝑆23, 𝑆24, … , 𝑆2K) (at the sub-class level),
where g, c, s stand for the number of product groups, classes and sub-classes.
The similarity between two products sets 𝑎, 𝑏 can be expressed as:
𝑆𝑖𝑚 𝑎, 𝑏 = 𝐶𝑜𝑠 𝐺2, 𝐺9 ∗ 𝛼 ∗ 𝐶𝑜𝑠 𝑎, 𝑏 + 𝛽 ∗ 𝐶𝑜𝑠 𝐶2, 𝐶9 + 𝛾 ∗ 𝐶𝑜𝑠 𝑆2, 𝑆9 + ⋯ (2-3)
The similarity includes all the cosine similarities at different product category levels:
𝐶𝑜𝑠 𝑎, 𝑏 measures the cosine similarity at the product vector level, 𝐶𝑜𝑠 𝐺2, 𝐺9 is the
group level cosine similarity, and so on. Also, we could set different weights (𝛼, 𝛽, 𝛾, …) to
different level’s similarity. If we need to emphasize exact match of the product, the product
similarity weight α can be assigned a large value. When we’d like to emphasize the
functionality of the product at the sub-class level, we can give a larger weight on 𝛾.
To reduce the computing cost, the similarity at the product group level is moved
outside as an indicator. If the products sets have no similarity at the group level, there is no
chance they could share some similarity at lower level.
Recommendation Generation
For recommendation, the system could recommend one product with the highest
probability to be purchased or a list of N products with an order by their predicted purchasing
probability. In this study, we will combine the information from the basket with that from the
association rules, and generate top N related products.
Based on the review of the literature, it shows that confidence is the most popular
weighted (based on the similarity between basket and the rules) confidence of the products as
a metric to rank.
Given the similarity between the current shopping basket and the retrieved rules, we
group the rules by the consequent. For each group, we combine the rules by the similarity we
get from previous steps, and normalize it and recalculate the confidence or the product of
support and confidence. Then we can get the metric for each recommended product, and we
can rank these recommended products.
Experiment Data Set Description
The data set is from a multi-billion dollars, multi-national specialty retailer. There are
over 100,000 different products, and we have a clear product categorical structure. The
products are divided into 18 groups, over 200 classes, and almost 2,000 sub-classes. Based
on the structure, products performing similar functions are usually divided into one
sub-category.
The transaction records are within a two-year time window, which includes a sample
of 60,000 customers. For the purpose of CRM (customer relationship management), the
company divide the customers into professional customer and regular customer groups. Since
the professional customer’s purchasing behavior is not exactly driven by the on-going
project, in this study, we focus on the project-driven purchasing behavior of the regular
customers (about 40,000).
Despite the large size of the dataset, there is still a severe data sparsity problem due to
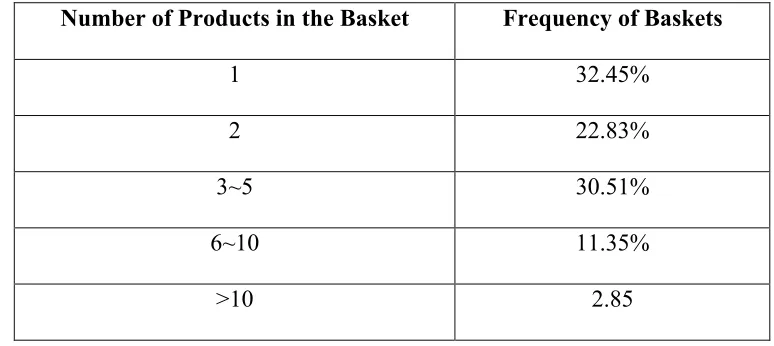
the rich product variety. Each transaction is defined as one unique customer’s shopping trip
However, among these transaction records, only 76.96% of the products have ever been
[image:35.612.120.504.161.337.2]purchased.
Table 2.2 The Composition of Regular Customer's Shopping Basket
Number of Products in the Basket Frequency of Baskets
1 32.45%
2 22.83%
3~5 30.51%
6~10 11.35%
>10 2.85
The size of the baskets shows that half of the shopping baskets have only one or two
products, which shows some evidences that most of the time customers do not have a clear
to-buy shopping list so they need make several shopping trips to purchase the products for
one or several on-going project(s).
To deal with data sparsity, one way is to combine consecutive transactions of the
same customer according to the time sequence. Another way is to use product category
structure information. Our first stage attempt is to combine all the customers’ shopping
records into one transaction for the customer. Although this combination misses the
sequential shopping information, the records still contain all the products the customer has
purchased in the observation time window,
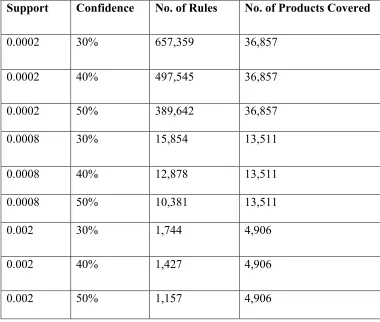
The summary of the association rules generated from the dataset is shown below in
[image:35.612.119.506.164.337.2]Table 2.3 Summary of the Retrieved Association Rules
Support Confidence No. of Rules No. of Products Covered
0.0002 30% 657,359 36,857
0.0002 40% 497,545 36,857
0.0002 50% 389,642 36,857
0.0008 30% 15,854 13,511
0.0008 40% 12,878 13,511
0.0008 50% 10,381 13,511
0.002 30% 1,744 4,906
0.002 40% 1,427 4,906
0.002 50% 1,157 4,906
From Table 2.4, we can tell there is severe data sparsity problem because among the
over 100,000 different products, the association rules can only cover a small proportion of
them. In practice, there would be a tradeoff in selecting a proper threshold for the support— a
higher support will reduce the computing complexity but provide less information (covering
a smaller number of products), while a lower support will generate more information in
products co-purchasing patterns at the cost of computing burden.
Evaluation of the Performance
In this study, we propose to recommend the top N products based on the ranking
computed by the algorithm. To evaluate the performance, we divide the dataset into training
performance. Since each transaction record represents one customer, we can randomly
sample from the regular customers and separate these customers into training and testing
groups.
Since the proposed recommendation method will generate a list N-products,
according to literature, we use two measures, precision and recall, to evaluate the
recommended result.
The precision measures among all the recommended N products, what proportion
eventually get purchased by the customer.
𝑃𝑟𝑒𝑐𝑖𝑠𝑖𝑜𝑛 = KWXY Z[ ]\Y ]Z^>6 KY]KWXY Z[ \W] KY] =|]YK]⋂]Z^>6|6 (2-4)
The recall measures among the real future purchase of the customer, what proportion
is correctly predicted by the recommendation algorithm.
𝑅𝑒𝑐𝑎𝑙𝑙 =KWXY Z[ ]YK] KY]KWXY Z[ \W] KY] =|]YK]⋂]Z^>6||]YK]| (2-5)
Based on these two measures, we can evaluate how good the proposed
recommendation algorithm performs.
Since the recall is affected by the size of the future basket, it’s hard to predict. Thus
precision is more important here as it shows among the top N products we have
recommended, how many actually get purchased.
Empirical Results
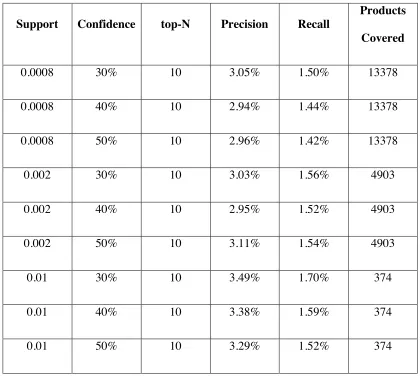
The recommendation result is shown below in Table 2.4.
The higher the support, the rule will only cover a smaller proportion of products.
When support is increased, there is no decline trend in precision and recall. On the opposite,
Given the threshold of support, the higher confidence in general leads to a lower precision
and recall values, which is because a higher confidence value will cut the number of rules
retrieved and provide less information to absorb. The exception is that for support at 0.002,
when the confidence increases from 40% to 50%, the precision and recall unexpectedly
[image:38.612.105.525.245.621.2]increases.
Table 2.4 Top-N Recommendation on Different Support and Confidence
Support Confidence top-N Precision Recall
Products
Covered
0.0008 30% 10 3.05% 1.50% 13378
0.0008 40% 10 2.94% 1.44% 13378
0.0008 50% 10 2.96% 1.42% 13378
0.002 30% 10 3.03% 1.56% 4903
0.002 40% 10 2.95% 1.52% 4903
0.002 50% 10 3.11% 1.54% 4903
0.01 30% 10 3.49% 1.70% 374
0.01 40% 10 3.38% 1.59% 374
0.01 50% 10 3.29% 1.52% 374
Next, we need to check how the similarity weights on different category levels impact
the prediction results. Especially we are interested in whether the product similarity (𝛼) or
coverage affected by the support and confidence, we set the thresholds for support and
[image:39.612.98.530.160.374.2]confidence for rules selection as: support=0.01 and confidence=80%.
Table 2.5 Comparison Between Product Level and Multi-Level Rules
Top-N Product Level Rules Multi-Level Rules Improvement
N=3 3.47% 3.82% 10.09%***
N=5 2.98% 3.19% 7.0%***
N=10 2.13% 2.14% 0.47%
When 𝛼 =1, it means we only consider the similarity at the product level. The second
column in Table 2.5 shows the performance of recommendation based on rules only learned
from the product level. The third column demonstrates the performance of multi-level rules
based recommendation, with 30% weights from product level, 10% from product class
category level, and the rest 60% relies on the sub-class category level. Overall, it shows that
utilizing information from product class and sub-class categorical structure could help
improve the performance of association-rule-based recommendations. The improvements in
precision are significant.
Conclusions
In this study, we are interested in discovering the hidden on-going projects from the
customers’ historical shopping basket information. And the association rule mining method
project, we will adapt the multi-level association rule mining methods and sequential rule
mining algorithms.
We believe that the proposed method can add to the existing literature on association
rule mining and inspire further research on the identification of more complex patterns in
market basket analysis. The practical contribution of the proposed research is that it can help
companies better understand customers’ project related purchase behaviors and better predict
future demands of its products. In a longer term, the proposed method could be applied in
other related domains as well.
There are also some interesting future research directions worth exploration. First of
all, there is a lack of theoretical foundation for rule-based recommendations. Some model
developments based on statistical theories would be promising. Secondly, a context-aware
recommendation system would help firms utilize available context related information to
improve the performance of recommendation systems. For instance, the seasonal indicator
can be incorporated and whether the customer is a business buyer or a regular consumer may
direct the recommendation algorithm to more accurate predictions.
References
Agrawal, R., Imieliński, T., Swami, A. 1993. “Mining Association Rules between sets of Items in Large Databases,” In ACM SIGMOD Record, 22(2), pp. 207-216.
Agrawal, R., and Srikant, R. 1994. “Fast Algorithms for Mining Association Rules. Proc. 20th int. conf. very large databases,” VLDB. Vol. 1215.
Agrawal, R., and Srikant, R. 1995. “Mining Sequential Patterns. In Data Engineering,” In Proceedings of the Eleventh International Conference, pp. 3-14.
Agrawal, R. C., Aggarwal, C. and Prasad, V. 2000. “A Tree Projection Algorithm for
Askar, P. 2016. “Beyond Market Basket Analysis: Extending Association Rules,” Ironside, Downloaded from https://www.ironsidegroup.com/2016/01/11/beyond-market-basket-analysis-extending-association-rules/.
Asthana, P., Singh, A. and Singh, D. 2013. “A Survey on Association Rule Mining Using Apriori Based Algorithm and Hash Based Methods,” International Journal of Advanced Research in Computer Science and Software Engineering, 3(7), pp. 599-603.
Billsus, D. and Pazzani, M.J. 1998. “Learning Collaborative Information Filters,” In ICML, 98, pp. 46-54.
Blanchard, D. 2007. “Supply Chains Also Work in Reverse,” Downloaded from Industry Week. http://www.industryweek.com/planning-amp-forecasting/supply-chains-also-work-reverse.
Blattberg, R. C., Kim, B., and Neslin, S. A. 2008 Database Marketing- Analyzing and Managing Customers (Springer).
Breese, J. S., Heckerman D., and Kadie C. 1998. “Empirical analysis of predictive algorithms for collaborative filtering,” In Proceedings of the Fourteenth conference on Uncertainty in artificial intelligence, pp. 43-52. Morgan Kaufmann Publishers Inc.
Chuang, K., Chen, and M., Yang, W. 2005. “Progressive Sampling for Association Rules Based on Sampling Error Estimation,” Lecture Notes in Computer Science, Volume 3518, pp 505 – 515.
Fu, Y., and Han, J. 1995. “Meta-Rule-Guided Mining of Association Rules in Relational Databases,” In KDOOD/TDOOD, pp. 39-46.
Ghoshal, A., Menon, S., and Sarkar, S. 2015. “Recommendations Using Information from Multiple Rules,” Information Systems Research, 26(3), pp. 532–551.
Goldberg, D., Nichols, D., Oki, B. M., and Terry, D. 1992. Using collaborative filtering to weave an information tapestry. Communications of the ACM, 35(12), pp. 61-70.
Gordon, L. 2008. “Leading Practices in Market Basket Analysis,” White paper, Fact Point Group. Downloaded from http://www.irgintl.com/pdf2/1.pdf.
Han, J., and Fu, Y. 1995. “Discovery of Multiple-level Association Rules from Large Databases,” VLDB. Vol. 95, pp. 420-431.
Han, J., and Fu, Y. 1999. “Mining Multiple-level Association Rules in Large Databases,” IEEE Transactions on Knowledge and Data Engineering, 11(5), pp 798-805.
Han, J., Kamber, M., and Pei, J. 2011. Data Mining: Concepts and Techniques. Elsevier.
Heckerman, D., Chickering, D. M., Meek, C., Rounthwaite, R., and Kadie, C. 2001.
“Dependency networks for inference, collaborative filtering, and data visualization,” The Journal of Machine Learning Research 1, pp. 49-75.
Hofmann, T., and Puzicha, J. 1999. “Latent class models for collaborative filtering,” In IJCAI, 99, pp. 688-693.
Hofmann, T. 2004. “Latent semantic models for collaborative filtering,” ACM Transactions on Information Systems (TOIS), 22(1), pp. 89-115.
Hosanagar, K, Fleder, D. M., Lee, D, and Buja, A 2014. “Will the global village fracture into tribes: Recommender systems and their effects on consumers,” Management Science 60(4), pp.805–823.
Koperski, K. and Han, J. 1995. “Discovery of Spatial Association Rules in Geographic Information Databases,” In Advances in spatial databases, Springer Berlin Heidelberg, pp. 47-66.
Koren, Y., Bell, R., and Volinsky, C. 2009. “Matrix factorization techniques for recommender systems,” Computer (8), pp. 30-37.
Kotsiantis, S., and Kanellopoulos, D. 2006. “Association Rules Mining: A Recent
Overview,” GESTS International Transactions on Computer Science and Engineering 32(1) pp 71-82.
Lallich, S., Teytaud, O. and Prudhomme, E. 2007. “Association Rule Interestingness: Measure and Statistical Validation,” In Quality Measures in Data Mining. Springer Berlin Heidelberg, pp 251-275.
Lin, W., Alvarez, S. A., and Ruiz, C. 2002. “Efficient adaptive-support association rule mining for recommender systems,” Data Mining and Knowledge Discovery, 6(1), pp. 83-105.
Linden, G., Smith, B., and York, J. 2003. “Amazon.com recommendations: Item-to-item collaborative filtering”, IEEE on Internet Computing, 7(1), pp. 76-80.
Leung, C.W.K., Chan, S.C.F. and Chung, F.L., 2006. “A collaborative filtering framework based on fuzzy association rules and multiple-level similarity,” Knowledge and
McCormick, T., Rudin, C. and Madigan, D. 2011. “A Hierarchical Model for Association Rule Mining of Sequential Events: An Approach to Automated Medical Symptom Prediction,” MIT Sloan Research Paper. Available at SSRN:
http://ssrn.com/abstract=1736062.
Pavlov, D. Y., and Pennock, D. M. 2002. “A maximum entropy approach to collaborative filtering in dynamic, sparse, high-dimensional domains,” In Advances in neural information processing systems, pp. 1441-1448. Chicago.
Petersen, J. A., and Kumar, V. 2015. “Perceived Risk, Product Returns, and Optimal Resource Allocation: Evidence from a Field Experiment,” Journal of Marketing Research 52(2), pp. 268-285.
Phua, C., Lee, V., Smith, K., and Gayler, R. 2010. “A Comprehensive Survey of Data Mining-based Fraud Detection Research,” arXiv preprint arXiv:1009.6119. Avarilable at SSRN: http://arxiv.org/abs/1009.6119
Priyanka, Er. V., and Sharma, K. 2014. “Apriori Algorithm for Mining Frequent Itemsets-A Review,” International Journal of Computer Application and Engineering Technology, 3 (3), pp 232-236.
Sarwar, B., Karypis, G., Konstan, J., and Riedl, J. 2000. “Analysis of recommendation algorithms for e-commerce,” In Proceedings of the 2nd ACM conference on Electronic commerce, pp. 158-167.
Short, J. E., Bohn, R. E., and Baru, C. 2011. “How Much Information? 2010 Report on Enterprise Server Information,” UCSD Global Information Industry Center.
Si, L., and Jin, R. 2003. “Flexible mixture model for collaborative filtering,” In ICML, 3, pp. 704-711.
Srikant, R., and Agrawal, R. 1995. “Mining Generalized Association Rules,” IBM Research Division.
Tang, P., and Turkia, M. P. 2006. “Parallelizing Frequent Itemset Mining with FP-Trees,” Computers and Their Applications, pp 30-35.
Thomas, S. and Sarawagi, S. 1998. “Mining Generalized Association Rules and Sequential Patterns Using SQL Queries,” In KDD, pp 344-348.
Tien D. D., Hui, S. C. and Fong, A. 2003. “Mining Frequent Itemsets with CategoryBased Constraints,” Lecture Notes in Computer Science, (2843), pp. 76 – 86.
Wang, F. H. and Shao, H. M. 2004. “Effective personalized recommendation based on time-framed navigation clustering and association mining,” Expert systems with applications, 27(3), pp. 365-377.
Wang, C., and Tjortjis, C. 2004. “PRICES: An Efficient Algorithm for Mining Association rules,” Intelligent Data Engineering and Automated Learning–IDEAL. Springer Berlin Heidelberg, pp 352-358.
Wickramaratna, K., Kubat, M., and Premaratne, K. 2009. “Predicting missing items in shopping carts,” IEEE Transactions on Knowledge and Data Engineering, 21(7), pp. 985-998.
Yuan, Y., and Huang, T. 2005. “A Matrix Algorithm for Mining Association Rules.,” Advances in Intelligent Computing. Springer Berlin Heidelberg, pp 370-379.
Zaïane, OR 2002. “Building a recommender agent for e-learning systems,” Proc. Internat. Conf. Comput. Ed. (IEEE, Washington, DC), pp. 55–59.
Ziegler, C. N., Lausen, G., and Schmidt-Thieme, L. 2004. “Taxonomy-driven computation of product recommendations,” In Proceedings of the thirteenth ACM international
CHAPTER 3. PREDICTING TIME TO UPGRADE UNDER SUCCESSIVE PRODUCT GENERATIONS
Modified from a manuscript to be submitted to Information Systems Research
Xinxue Qu, Zhengrui Jiang, and Aslan Lotfi
Ivy College of Business, Iowa State University, Ames, IA, USA
Abstract
In the presence of successive product generations, most customers are repeat buyers,
who may decide to purchase a future product generation before its release. As a result, after
the new product generation enters the market, its sales often show a declining pattern,
making traditional bell-shaped diffusion models unsuitable for characterizing the timing of
product upgrades by customers. In this study, we propose a survival model with
exponential-decay baseline function (or Expo-Decay model) to predict customers’ time to upgrade to a
new product generation. Compared with existing proportional hazard models, the
Expo-Decay model is parsimonious and easy to interpret. In addition, empirical analysis using
upgrade and usage data for a major sports video game series shows that the Expo-Decay
model performs better than or as well as existing parametric models in prediction accuracy.
Furthermore, we extend the baseline Expo-Decay model with the frailty model to incorporate
unobservable customer heterogeneity and with the point process method to capture
influences of previous adoptions, and with time-variant covariates. Empirical results obtained
using the Expo-Decay model reveal that customers’ previous adoption and usage patterns can
help predict their timing to upgrade to a new product generation. In particular, we find that (i)
potential switching customers who have adopted the previous generation are more likely to
lower probability to upgrade. These findings can help firms better understand customers’
upgrade behaviors and develop more personalized promotions to target customers.
Keywords: Technology Adoption, Product Upgrade, Video Game, Survival Analysis
Introduction
Continuous product improvement and frequent releases of new product generations is
a common practice by firms. Releasing improved product generations enhances customer
loyalty and encourages more repeat purchases (Albuquerque and Nevskaya, 2012), thereby
increasing sales which otherwise would decrease as a result of market saturation. For
example, Call of Duty, the best-selling first-person shooter video game series, releases new
game generations every year to blockbuster-level sales. In fact, introducing product
improvements may result in a large volume of upgrade sales in a relatively short time period.
For instance, on average, 17% of iPhone users upgrade as soon as the new model is released,
58% upgrade one year after the release, and 22% two years after the release. Only 2% of
users wait longer (Edwards, 2016).
However, companies’ investments in technological improvement may not always lead
to popularity of new product generations. If the quality improvement is marginal, customers
may be reluctant to upgrade to a new generation. For instance, in recent years, the average
time-to-upgrade for smartphones has extended. In 2014, U.S. consumers are upgrading their
smartphones every 23 months. Lately, consumers on average are holding onto their phones
for an additional eight months. It is estimated the time gap between upgrades will widen to
33 months by 2019 (Martin and FitzGerald, 2018). Therefore, it is important to explore
A limited number of prior studies have focused on factors that might impact
customers’ future purchases intentions in a product series. To the best of our knowledge, no
prior research has examined the influence of consumers’ previous adoption and usage
experience on their upgrade decisions. This gap is filled by the current study. Furthermore, in
the presence of successive product generations, most customers are repeat buyers, who may
decide to purchase a future product generation before its release. As a result, after the new
product generation enters the market, its sales often show a declining pattern, making
traditional bell-shaped diffusion models unsuitable for characterizing the timing of product
upgrades by customers. To model this declining sales trend, we propose an
Exponential-Decay proportional hazard model (Expo-Exponential-Decay PHM) to help explain and predict
consumers’ upgrade behaviors.
Using a rich dataset for a major sports video game series that includes
individual-level activation and usage records, we evaluate the proposed Expo-Decay model against
existing survival models, and identify predictors of time-to-upgrade decisions. Our results
indicate that players’ prior adoption and usage experience can indeed help predict their
timing of product upgrade. In particular, we find that potential switching customers who have
adopted the previous generation are more likely to upgrade to a new generation, heavy
players tend to upgrade earlier, and specialized customers have a lower probability to
upgrade. Furthermore, empirical results show that the proposed Expo-Decay model performs
better than or as well as existing parametric models in prediction accuracy. By integrating the
Expo-Decay model with a point process capturing adoptions of previous generation, the