Abstract—In this research, common parts of frequent sequences were detected from medical instructions for catheter ablation described in the clinical pathways of University of Miyazaki Hospital, deformed patterns (variants) of medical instructions were detected and graphical representation was performed. Next, we created a visualization tool by Web application with high visibility compared with output result by character string. As a result of experiments, it became possible to grasp the correspondence between typical clinical paths in catheter ablation surgery. Moreover, in order to improve visibility compared to conventional character string output, a visualization tool was created and data obtained by experiment was displayed. However, confirmation of the visualization effect of clinical path variant from a medical point of view is still to be done, and at the present time the visualization method is in the stage of functioning.
Index Terms— Sequential Pattern Mining, Electronic Medical Records, Clinical pathways Variant, Visualization of Clinical Pathways, Catheter Ablation.
I. INTRODUCTION
n Electronic Medical Record(EMR) Logs records information on patients by computer instead of by paper. Not only the data but also the entire management system may be called EMR Logs. The expected effect simplifies the entire process of hospital management and improves medical care. Because data are managed electronically, input data can be easily managed and compared with medical records on paper. Information can be easily shared electronically. On the other hand, falsification must be prevented and the originality of the data must be guaranteed.
Medical workers including doctors, nurses, and technicians currently use clinical pathways. A clinical pathway is a guideline for a typical sequence of medical orders for a disease, which is traditionally generated by the medical workers themselves based on their medical experiences. Human verification and modification of clinical pathways are time-consuming for workers. It would be helpful if medical workers could verify the correctness of the
Manuscript received Dec. 8, 2017 ; revised Jan 5, 2018.
This work is partially supported by the Kurata Grants awarded by the Hitachi Global Foundation.
M. Kushima, T. Yamazaki, and K. Araki are with the Faculty of Medicine, University of Miyazaki Hospital.
e-mail:{muneo_kushima, yama-cp, taichan}@med.miyazaki-u.ac.jp, http://mit.med.miyazaki-u.ac.jp/.
5200, Kihara, Kiyotake-cho, Miyazaki-shi 889-1692 Japan. Tel: +81-985-85-9057, Fax: +81-985-84-2549.
Y. Honda, H. H. Le, and H. Yokota are with the Department of Computer Science, Tokyo Institute of Technology.
e-mail:{honda, hanhlh} @de.cs.titech.ac.jp, e-mail:[email protected],
http://www.de.cs.titech.ac.jp/.
2-12-1 Oookayama, Meguro-ku, Tokyo 152-8552, Japan
existing clinical pathways or modify them by comparing them with the frequent sequential patterns of medical orders extracted from EMR logs.
In our previous work, Le et al. [1] proposed to speed up the clinical pathway generation, and deployed an occurrence check that adds only closed sequential patterns to the results during mining while considering time intervals between events. Experiments on real data sets showed that the proposed system can be more than 13 times faster than our earlier method and can significantly improve the decision-making process for medical actions at large hospitals.
Honda [2] et al. proposed a method for detecting variants in clinical pathways with treatment time information from EMR logs, and combine typical clinical pathways to find the differences between similar pathways TUR-Bt(transurethral bladder tumor resection) and ESD(endoscopic submucosal dissection).
In this study, a common part detection is performed on the typical sequence obtained by T-PrefixSpan from the data of the medical instruction history, so that a variant which is a deformation pattern of the medical instruction was represented as a variant pattern explained.
As a result of the experiment using the proposed method, it was possible to show that correspondence between typical clinical pathways in catheter ablation technique can be grasped. Moreover, in order to improve visibility compared to conventional character string output, a visualization tool was created and data obtained by the experiment was displayed.
In this study, Catheter ablation with a different branching pattern from TUR - Bt and ESD was chosen. Catheter ablation is a very important treatment method. It is a treatment method aimed at curative arrhythmia, and it is not necessary to cut open a patient’s chest as compared with surgical operation, so it has features such as a short treatment time and a small burden on the body. This is the reason for
choosing catheter ablation in this study. II. PURPOSE
Since this study attempted to realize a visualization tool with high visibility for clinical path variant detection, the purpose is to confirm that the visualization method works with catheter ablation as an example.
III. RELATED WORK
There have been many studies of the secondary uses of EMRs related to clinical pathways. Wakamiya and Yamauchi proposed standard functions for electronic clinical pathways
Visualization and Analysis of Variants in Catheter
Ablation’s Clinical Pathways from Electronic
Medical Record Logs
Muneo Kushima, Yuichi Honda, Hieu Hanh Le, Tomoyoshi Yamazaki,
Kenji Araki, and Haruo Yokota
[3]. Hirano and Tsumoto proposed a method for extracting typical medical treatments by analyzing the logs stored in a hospital information system [4].
Uragaki et al. proposed a method using sequential pattern mining to extract clinical pathways. The a-priori-based frequent pattern mining algorithm [5] is well known. However, this algorithm is time-consuming with large data sets and cannot handle time intervals between items. Uragaki et al. therefore proposed T-Prefixspan [5]. This algorithm is a time-interval sequential pattern mining (TI-SPM) algorithm that can handle time intervals between items [6]. Because it is based on PrefixSpan [7], it is faster than a-priori-based algorithms. Uragaki et al. showed that more effective mining can be performed by focusing on the efficacy of the medicine. However, this approach does not process variants, so an additional capability is needed to detect clinical pathways containing variants.
Episode mining [8] is a well-known method for extracting patterns containing variants. However, this approach normally extracts such patterns from a single long sequence of data. Because we combine multiple sequences of data, this approach cannot be used for this study.
IV. METHOD
A. Extracting typical clinical pathways
First, we extract typical clinical pathways from actual EMRs by sequential pattern mining. As a side note, these clinical pathways do not have variants. In medical care, it is important to consider time intervals between medical treatments. In this study, we employ T-PrefixSpan [5], because this method considers time intervals between items. As in our previous study, we define medical treatments to have the four values Class, Description, Code, and Name. (1) Class denotes the classification of a medical treatment, (2) Description denotes its detailed diagnostic record, (3) Code is the medical code that represents the unique efficacy of the medicine considered, and
(4) Name is the name of the medicine.
For treatments without medicine, Code and Name are set to “null", to represent a blank value.
For example, assume a medical treatment designated as “injection" is described as an “intravenous injection" with a medical code “331" and the name “Lactec injection" appears in a medical log. The item is then represented in the form: (injection; intravenous injection; 331; Lactec injection). In this example, “Code 331" indicates “blood substitute." In another example, when the medical treatment is the “nursing task" of “changing the sheets," the item is represented in the form: (nursing task; changing the sheets; null; null).
We specify that medical treatments have four values but we execute mining by focusing on Name, that is, we do not use efficacy of medicines (Code). Efficacy is used to detect variants. This is explained in the next section.
The following are the important definitions introduced for T-PrefixSpan [5], which we employ in this work.
Definition 1 T-item (i, t)
Let I be a set of items and let t be the time when an item i
occurred. We define a T-item (i, t) as a pair of i and t. Definition 2 T-sequence s and O-sequence Os
T-sequence s is a sequence of T-items, which is denoted by s = < (i1, t1), (i2, t2), ….., (in, tn) >.
T-times that occur at the same time should be arranged in alphabetical order. Furthermore, let n be the length of T-sequence s and let an O-sequence of s be the sequence Os = < i1, i2, …., in >.
Definition 3 Time interval TIk
Given a T-sequence s = < (i1, t1), (i2, t2), …., (in, tn) >, The time interval TIk is defined as follows:
TIk ≡ tk+1 - tk (k = 1, 2, …., n – 2, n - 1).
Definition 4 T-sequential database D and O-sequential
database OD
Given a set of T-sequences, the T-sequential database D is defined as follows, where the identifier sid of an element of D
has a unique value for each sequence. D ≡ {(sid, s)|sid, s∈S}.
Let an O-sequential database OD be a sequential database that consists of O-sequences configured from all the T-sequences in D. Let Size(D) be Size(OD),
which is the number of sequences in OD. Denition 5 T-frequent sequential pattern P
Let MinSup ( 0 ≦MinSup≦ 1 ) be a minimum support and let D be a T-sequential database.
Given P =< i1, X1, i2, X2,…., in-1, Xn-1, in > (∀j ij is an item,
∀k Xk is a set of five values: (mink, modk, avek, medk, maxk)), and we can configure a sequence OP =< i1, i2,…., in-1, in>.
We define P as a T-frequent sequential pattern if OP is a frequent sequential pattern in an O-sequential database configured from D (i.e., Sup(P) =| {Seq | OP⊆Seq(sid, Seq)
⊂OD, where sid is an identifier of Seq } | ≧Size(OD) ×
MinSup). Let OP be the O-pattern of P. The set of five values is defined as follows:
Given all the T-sequences with O-sequences containing OP in D, let S be one of them, where S =< i’1, t1, i’2, t2,…, i’m-1,
tm-1, i’m >.
By using j1, j2,…., jn-1, jn, which satisfies: (1) 1 ≤ j1 < j2 < …. < jn-1 < jn≦m and (2) ik = i’jk, ik+1 = i’jk+1,
we can configure sets of time intervals: SetTI1 , SetTI2 ,…. ,
SetTIn-1 , where TIk =t’jk+1 – t’jk .
Moreover, in Xk= (mink, modk, avek, medk, maxk), we define the five values as follows.
1) mink = min SetTIk
2) modk = the most frequent value in SetTIk 3) avek = the average of the values in SetTIk 4) medk = the median of the values in SetTIk 5) maxk= max SetTIk
Given a time interval Xj = (minj , modj , avej , medj , maxj)(1 ≤
j < n), if the equation minj = maxj holds, then the time interval between item ij and item ij+1 is consistent; in particular, if the equation minj = maxj = 0 holds, then these two items occurred at the same time.
Definition 6 T-closed frequent sequential pattern A
Given a T-sequential database D, let Σ be a set of T-frequent sequential patternsextracted from D and let A be a T-frequent sequential pattern of Σ. A is a T-closed frequent sequential pattern if Z satisfying the following does not exist in Σ\ A.
1) If we let A’ and Z’ be O-patterns of A and Z, respectively, then A’⊆Z’.
2)Sup(A) ≤ Sup(Z), where we define a support of the T-frequent sequential pattern as Sup(A) ≡ |{ s | s⊆S, (sid, S)
∈D, where sid is the identifier of S in D} |.
j2,…. , jn exists and satisfies (1) 1 ≤j1 < j2…. jn≤m and (2) ak =
bjk , ak+1 = bjk+1. Thus, for all Tk =
(mink, modk, avek, medk, maxk) and T’jk = (min’jk , mod’jk ,
ave’jk , med’jk , max’jk , equations (1) mink≥min’jk and (2)
maxk≤max’jk hold.
T-PrefixSpan outputs the set of T-frequent sequential patterns P with T-sequential database D and minimum support MinSup as input.
More detailed definitions are given in Uragaki[5].
B. Grouping the clinical pathways
We explained how to extract typical pathways without variants from EMR logs. In this section, we explain how to group the clinical pathways. That is, to detect a more practical variant from a combination of similar pathways. For example, two medical treatments in the variant have the same
Class, Description and Code but not the same Name. To achieve this, we group pathways. In each group, the number of medical treatments are all equal for each relative treatment day. The reference date of the relative treatment day is defined as the day on which the main medical treatment is performed.
For example, the relative treatment day of the treatment done the day before the main medical treatment day is “-1” and one done on the day following the main medical treatment day is “1”.
This date is determined from time intervals. The method in [1] defines time intervals that have five values, i.e., minimum,
most frequent, average, intermediate, maximum, but we use only the most frequent value to calculate relative days. Because we think that typical sequential patterns are frequent patterns of EMR logs, relative days use the most frequent values.
C. Detecting clinical pathways containing variants
We have explained grouping the pathways. In this section, we explain how to detect clinical pathways containing variants while treating time information from typical pathways without variants for each group.
First, we define the concepts required to introduce our method before we explain the algorithm.
Definition 7 T-block B
T-block B is the set of T-items with the same time of occurrence, which is denoted by B = {(i1, t1), (i2, t2),…,(in,
tn)|t1 = t2 = ….= tn}.
Furthermore, let n be the number of elements of T-block B, and let tBbe the time at which these items occur, that is, t1 = t2 = ….= tn= tB.
Definition 8 Variant pattern v
Variant Pattern v is a sequence of T-blocks, which is denoted by V = < (B1, tB1 ), (B2, tB2 ),…., (Bn, tBn) >. T-blocks that occur at the same time shouldbe arranged in alphabetical order. Let n be the length of Variant Pattern V.
When the number of elements of all the blocks is 1, the variant pattern is equal to the T-sequence.
We developed a method for detecting the pathway with variants from the pattern without variants. The algorithm is described in Algorithm 1. A variant pattern is detected by finding the difference between the clinical pathways in each group.
Algorithm 1 Detecting clinical pathways containing variants Input: P’: the set of T-closed frequent sequential patterns Output:V : the set of variant patterns
1: v ←{s | s ∈ S}
2: for p ∈ P’ \ v do 3: k , j = 1
4: while k < length(v) and j < length(p) do 5: Bv = {Bi∈ v}
6: Bs = {Bj∈ p} 7: if tBv = = tBpthen 8: for {i | i ∈ Bv } do
9: if iBp does not match any element of iBvthen 10: Add (iBp , tBp ) to Bv
11: end if 12: end for
13: k = k + 1, j = j + 1 14: else if tBv > tBpthen 15: Insert Bp just before Bv 16: k = k + 1, j = j + 1 17: else
18: k = k + 1 19: end if 20: end while
21: while j < length(p) do
22: Add Bj , Bj+1,…., Blength(p) to the end of v 23: end while
24: end for 25: V ← v
D. Representing variant patterns
As a solution to the problem that cannot be expressed when the order cannot be uniquely determined, the method of representing the variants is defined by a nested structure with reference to the graphical notation [9].
Definition 9 Nested branched sequence
The items in the odd level of a list indicate a sequence pattern, while the items in the even level of the list a parallel pattern. [L1,1 , L1,2 , …., L1,n] is a sequence pattern, L1,i = [L2,i,1 ,
L2,i,2 ,…., L2,i,m] is a parallel pattern, and L2,i,j =
[L3,i,j,1 , L3,i,j,2,…. , L3,i,j,k] is a sequential pattern, and so on. For example, when five T-items(a,b,c,d,e,f,g) are written as v
[image:3.595.304.510.52.305.2]= [[a], [b], [c], [d, e], [f], [g]], the variant pattern is shown in Figure 2.
Fig. 2. Example of variant representation.
E. Visualizing variant patterns
The problem with the representation in the previous section is that if the structure becomes complicated, it becomes impossible to understand the information intuitively, and the amount of information that can be read by each person is different. To provide the same information to anyone, visualization of data in an interactive graphical interface system is important.
F. Deriving the set of nodes and edges from the variant pattern
For visualization, we must create sets of nodes and edges from the variant patterns. The algorithm is described in Algorithm 2.
Algorithm 2 Derivation of the set of nodes and edges Input: Variant pattern v’
Output: the set of nodes of v’(V ) and the set of edges of v (E) 1: k = 1
2: count = 1
4: startBk = count 5: for {i | i ∈ Bk} do 6: icount = i 7: V ← icount
8: for k ≧ 2 and startBk-1≦ j ≦ endBk-1do 9: E ← (ij , icount)
10: end for
11: count = count + 1 12: end for
13: endBk = count - 1 14: k = k + 1 15: end for
The set of nodes contains all the T-items that exist in the variant pattern, the set of edges contains all edges from all T-items belonging to Bk-1 to all T-items belonging to Bk. In the visualization, the graph is created by the set of nodes and edges.
V. EXPERIMENT
A. Experimental data
We used target medical treatment data based on clinical pathways recorded from November 19, 1991, to October 4, 2015, in the EMRs at the Faculty of Medicine, University of Miyazaki Hospital. These medical data were acquired using an EMR system WATATUMI [10] employed by the Faculty of Medicine, University of Miyazaki Hospital. The total data size of the EMR system is 49GB.
For personal information protection, the data that we used did not include information that could identify a patient uniquely. When we extracted the medical treatment data, we used anonymous patient IDs, which were impossible to associate with real people. The data we extracted from the EMRs to support medical treatments at the Faculty of Medicine, University of Miyazaki Hospital were described previously in [12] and they can be accessed at the website of the University of Miyazaki and the Research Ethics Review Committee of Tokyo Institute of Technology.
Our target data consisted of medical treatments based on one clinical pathway that was included in the EMRs: catheter ablation. We chose this one clinical pathway because catheter ablation has clinical pathways that are relatively fixed.
In the experiment, we confirm that variant pattern v can be constructed for the one case catheter ablation.
The number of sequences, average length of the sequences and maximum length of the sequences for the one data set catheter ablation is shown in Table 1.
[image:4.595.47.224.51.183.2]The reason for limiting the hospitalization period is to exclude exceptional pathways. For example, there is a pathway in which the treatment period should end in several days but the hospitalization period has exceeded one year.
Table 1. Target dataset.
Dataset Catheter ablation
Number of patients 21
Days of hospitalization period 7 Average treatments per patient 70.10 Maximum treatments per patient 121 Minimum treatments per patient 38
B. Results and discussion
The numbers of typical clinical pathways by T-PrefixSpan are shown in Table 2.
Table 2. Dataset of Catheter ablation.
Dataset Catheter ablation
Threshold 0.4
Number of typical pathways 12636 Average treatments per pathway 7.48 Maximum treatments per pathway 12 Minimum treatments per pathway 3
In the result of catheter ablation, there are not a few cases where a variant pattern is formed from many pathways. The reason is that many small differences of medical treatments between pathways were detected and there were few similar pathways because the clinical pathway of catheter ablation is fixed.
A part of clinical pathways of catheter ablation at threshold 0.4 for T-PrefixSpan are shown in Fig. 4(a,b), and variant patterns derived from Fig. 3(a,b) are shown in Fig. 4(a,b). The original character outputs are not colored, but we give the same color to the medical treatments of the same T-block in Fig. 4(a,b), for the readability.
(a)
(b)
Fig. 3. Variant patterns of a part of clinical pathways of catheter ablation at threshold 0.4 for T-PrefixSpan.
C. Visualization
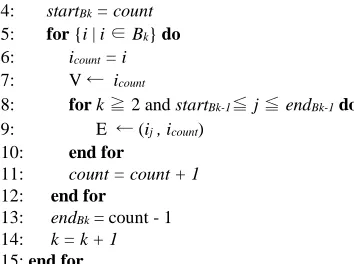
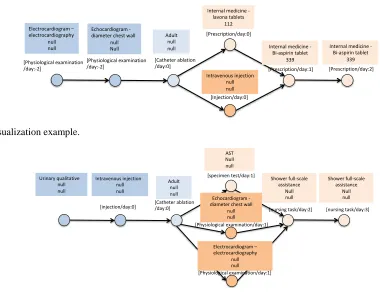
Even with the character outputs as Fig. 3(a,b), it is difficult for medical workers to grasp the variant patterns from the character strings. Therefore, we try to visualize the variant patterns using an interactive graphical output tool D3.js [11]. We use circles and arrows between them to make it easier to grasp the entire clinical flow, while making detailed information be given interactively by user clicks.
For example, the variant patterns of Catheter ablation in Fig. 3(a,b) are visualized in Fig. 4(a,b). Over the circle node,
Type and Treatment day are always displayed because they are necessary information for grasping the entire pathway.
The nodes that have the same Type of medical treatment are painted with the same color. When a circle node is clicked, detailed information, i.e., Explain, Code, and Name are displayed in the square node. This square node with the detailed information is a toggle between hide and show to focus on important portions in the pathway.
[image:4.595.306.552.270.446.2]By contemplating the visualized output result diagram, it is possible to discover a combination of new medical instructions. It was easier to understand and handled than the conventional string output.
As a result, it is possible to grasp the detailed information of each medical instruction and grasp the detailed difference between the medical instructions, so to grasp the entire flow by following nodes and arrows, supplemental information of medical instructions, It is possible to grasp the information of the medical instruction unit. Furthermore, there is a possibility that comparison of corresponding medical instructions is easy, and new medical knowledge can be obtained from differences in visualization diagrams.
VI. CONCLUSION
In this study, we described a method to represent a variant, which is a deformation pattern of medical instructions by catheter ablation, as a variant pattern.
As a result of the experiment using the proposed method, it was possible to show that correspondence between typical clinical paths in catheter ablation surgery can be grasped.
However, confirmation of the visualization effect of clinical path variants from a medical point of view is still to be done, and at the present time the visualization method is in the stage of functioning.
REFERENCES
[1] H. H. Le, H. Edman, Y. Honda, M. Kushima, T. Yamazaki, K. Araki, H. Yokota, “Fast Generation of Clinical Pathways Including Time Intervals in Sequential Pattern Mining on Electronic Medical Record Systems”, The 2017 International Conference on Computational Science and Computational Intelligence, Proceeding of the fourth International Conference on Computational Science and Computational Intelligence (CSCI 2017), Dec. 2017.
[2] Y. Honda, M. Kushima, T. Yamazaki, K. Araki, H. Yokota, “Detection and Visualization of Variants in Typical Medical Treatment Sequences”, International Workshop on Data Management and Analytics for Medicine and Healthcare, Proceeding of the third International Workshop on Data Management and Analytics for Medicine and Healthcare (DMAH 2017), in conjunction with the 43rd International Conference on Very Large Database (VLDB 2017), pp. 88-101, Sep. 2017.
[3] S. Wakamiya and K. Yamauchi, “What are the standard functions of electronic clinical pathways?”, International Journal of Medical Informatics, vol.78, pp.543-550, 2009.
[4] S. Hirano and S. Tsumoto, “Clustering of order sequences based on the typicalness index for finding clinical pathway candidates”, IEEE International Conference on Data Mining (ICDM Workshops), 2013. [5] K. Uragaki, T. Hosaka, Y. Arahori, M. Kushima, T. Yamazaki, K.
Araki and H. Yokota, “Sequential pattern mining on electronic medical records with handling time intervals and the efficacy of medicines” First IEEE Workshop on ICT Solutions for Health, Proc. 21st IEEE International Symposium on Computers and Communications, Jun. 2016.
[6] Y. Chen, M. Chiang and M. Ko, “Discovering time-interval sequential patterns in sequence databases”, Expert Systems with Applications 25, pp.343-354, 2003.
[7] J. Pei, J. Han, B. Mortazavi-Asl, H. Pinto, Q. Chen, U. Dayal and M. Hsu, “PrefixSpan: Mining sequential patterns efficiently by prefix-projected pattern growth”, Proceedings of 2001 International Conference on Data Engineering, pp.215-224, 2001.
[8] H. Mannila, H. Toivonen, and A. Verkamo, “Discovery of frequent episodes in event sequences”, Data Mining and Knowledge Discovery, Vol. 1, pp.259-289, 1997.
[9] Achar A, Laxman S, Raajay V, Sastry PS, “Discovering general partial orders from event streams”, Technical report. arXiv:0902.1227v2 [cs.AI].
http://arxiv.org
[10] Denshi Karte System WATATUMI (EMRs \WATATUMI"). http://www.corecreate.com/02 01 izanami.html
[11] D3.js., https://d3js.org,
[12] Miyazaki Daigaku Igaku Bu Fuzoku Byouin Iryo Jyoho Bu (Medical Informatics Division, Faculty of Medicine, University of Miyazaki Hospital).
http://www.med.miyazaki- u.ac.jp/home/jyoho/
Fig. 4(a). Visualization example.
Fig. 4(b). Visualization example.
Intravenous injection null null
[injection/day:0]
Adult null null [Catheter ablation /day:0]
AST Null null [specimen test/day:1]
Echocardiogram -diameter chest wall
null null [Physiological examination/day:1]
Shower full-scale assistance
Null null
[nursing task/day:2] Urinary qualitative
null null
Electrocardiogram – electrocardiography
null null [Physiological examination/day:1]
Shower full-scale assistance
Null null
[nursing task/day:3] Electrocardiogram–
electrocardiography null null
[Physiological examination /day:-2]
Echocardiogram -diameter chest wall
null Null
[Physiological examination /day:-2]
Adult null null
[Catheter ablation /day:0]
Internal medicine -lavona tablets
112 [Prescription/day:0]
Intravenous injection null null [Injection/day:0]
Internal medicine -Bi-aspirin tablet
339 [Prescription/day:1]
Internal medicine -Bi-aspirin tablet
[image:5.595.99.479.455.747.2]