Impact of different processing of full-fat soybeans
on broiler performance
J. Heger
1, M. Wiltafsky
2, J. Zelenka
11Mendel University in Brno, Brno, Czech Republic
2Evonik Industries AG, Hanau-Wolfgang, Germany
ABSTRACT: The response of broilers to various conditions of expander processing of full-fat soybeans (FFSB) was studied in an experiment involving 5040 birds allocated to 10 dietary treatments with six replicates. In treatments 1–8, the proportions of FFSB in starter, grower, and finisher diets were 40, 39‒43, and 34‒37%, respectively. Diets for treatments 9 and 10 contained commercial soybean meal (SBM) as a main protein source. All diets were isocaloric and were formulated to contain standardized ileally digestible amino acids at levels corresponding to 95% (treatments 1–7 and 10) or 100% (treatments 8 and 9) of requirement. In treatment 1, raw FFSB was used while diets for treatments 2–8 contained FFSB processed by various combinations of times and temperatures used during conditioning and expanding. Urease activity, protein dispersibility index, and trypsin inhibitor activity of FFSB decreased as processing time and/or temperature increased while protein solubility remained relatively unchanged. Concurrently, growth performance of chickens improved (P < 0.05) and their relative pancreas weight decreased (P < 0.05). The best results in terms of feed intake, growth rate, feed conversion ratio, and carcass quality of FFSB-fed birds were obtained using expanding for 15 s at 125°C preceded by short-term (1 min, 100°C) and long-term (5 min, 100°C) conditioning. These results were not sig-nificantly different from those achieved with SBM-based diets (P > 0.05). Numerically better performance was found in 100% amino acid diets as compared with 95% diets (P > 0.05). Switching the raw FFSB diet to SBM diet caused relative pancreas weight decrease by 31% during 3 days. An opposite switch resulted in a 65% increase in relative pancreas weight during 4 days.
Keywords: soybean treatment; expanding; pancreatic hypertrophy; heat treatment
INTRODUCTION
In the last years, the feed industry showed a growing interest in the use of full-fat soybeans (FFSB) and, as a result, its large-scale process-ing became a common practice. Due to their high oil content, FFSB are particularly suitable for manufacturing high-energy poultry diets, as post-pellet application of fat may be reduced or eliminated (Waldroup 1982). However, the nutri-tional potential of FFSB is limited by the presence of antinutritional factors, mainly trypsin inhibi-tors, which interfere with digestion, absorption, and metabolism of nutrients (Liener and Kakade 1980). Trypsin inhibitors form complexes with pancreatic proteases, thus reducing their acitiv-ity in the upper small intestine. In an attempt to
offset the lack of enzymes, hypersecretion by the exocrine pancreas is evoked followed by pancreatic hypertrophy and hyperplasia (Grant et al. 1995). As a result of the combined effect of endogenous loss of essential amino acids (particularly sulphur amino acids) and decreased intestinal proteolysis, growth performance of chickens is reduced.
be-tween most amino acids and polypeptide chains, thus reducing the efficiency of intestinal proteases. Part of amino acids may be totally destroyed as a result of the advanced Maillard reaction. Thus, an optimal balance between under- and over-processing must be found to ensure an efficient utilization of soyabean protein. In this experiment, an attempt was made to find such optimum and to investigate which amount of trypsin inhibitors was tolerated by growing broilers without affecting their performance. The aim of the present experi-ment was to investigate the effect of different heat treatments imposed on full-fat soybeans on the performance and organ weights in broilers.
MATERIAL AND METHODS
Processing of soybeans. One batch of raw soybeans was purchased from Rieder Asamhof GmbH & Co. KG (Kissing, Germany). The raw soybeans were further processed at the facilities of Amandus Kahl GmbH & Co. KG (Reinbeck, Germany). The follow-ing equipment was used for the processfollow-ing of the soybeans: a short-term (60 s) conditioner DLM I, a long-term conditioner LK 1605-2, and an expander OEE 15.2 (all Amandus Kahl GmbH & Co. KG). Various combinations of short-term conditioning at 80 or 100°C, long term conditioning at 100°C for 5 or 15 min, and expanding at 115 or 125°C were applied to manufacture six FFSB products used in experimental diets (Table 1). The expander had a throughput of 1.5–1.8 t/h. After short-term condi-tioning at 80°C, a specific energy input of 30.0 and 39.2 kWh/t was needed to reach expansion tempera-tures of 115 and 125°C, respectively. After short-term conditioning at 100°C and long-term conditioning at 100°C for 5 and 15 min, a specific energy input of 13.5 and 20.0 kWh/t was needed to reach expansion temperatures of 115 and 125°C, respectively.
All FFSB products were dried in a belt dryer with 85°C air and left the dryer after 5 min with a tem-perature of 43°C. Then they entered the belt cooler and left it after 5 min with a temperature of 30°C.
Animals and procedures. The experiment was conducted at the International Poultry Testing Station Ústrašice, Czech Republic. The animal procedures were reviewed and approved by the Animal Care Committee of the Mendel University in Brno. A total of 5040 one-day-old male Ross 308 broiler chicks were allocated randomly to 10 dietary treatments using a randomized complete
block design with six replicates per treatment. There were 70 chicks per replicate pen except for treatments 1 and 10, in which 140 chicks per pen were used. Stocking density was 17 broilers per square meter. The chickens were kept in a windowless house with full climatic control, on deep litter from wood shavings. Each pen was equipped with manually filled tube feeders and nipple drinkers. Heating and lighting programmes were in accordance with Ross Broiler Management Manual (2009). On day 1, the birds in each pen were weighed together while on days 10, 24, and 35, all birds were weighed individually. At the same time, feed consumption per pen was recorded. On day 35, when the first part of the experiment terminated, five birds of each pen having body weights closest to the pen mean were selected, tagged, and after 12 h of fasting they were weighed, sacrificed and carcass, breast meat (boneless and without skin), and pancreas weights were recorded. The experi-ment continued with the chickens remaining on treatments 1 and 10 for another 6 days. From day 36 onwards, the chickens on treatment 1 received the diet previously fed to birds on treatment 10 while the birds on treatment 10 were switched to treatment 1. During this period, the recovery from raw soybeans (treatment 1) and the adaptation to raw soybeans (treatment 10) was studied. Five birds from each pen were sacrificed each day and slaughter analysis was performed as described above.
digestible amino acids at levels of 100 and 95%, respectively. Processing conditions and diet char-acteristics are summarized in Table 1. Ingredient composition and nutrient contents of diets are given in Tables 2 and 3. The diets in crumbled form (starter phase) or pellets (grower and finisher phase) were supplied ad libitum.
Chemical analyses. The raw and processed FFSB as well as commercial SBM were analyzed for urease activity (UA) according to ISO 5506:1988 (Soya bean products ‒ Determination of urease activity), protein solubility in a 0.2% potassium-hydroxide solution (PS) as described by Araba and Dale (1990a), protein dispersibility index (PDI) us-ing the AOCS Official Method Ba 10-65 proposed by the American Oil Chemists’ Society (AOCS 1996), and trypsin inhibitor activity (TIA) accord-ing to ISO 14902:2001 (Animal feedaccord-ing stuffs ‒ Determination of trypsin inhibitor activity of soya products). Reactive lysine was determined in raw and FFSB samples using homoarginine reaction as described by Fontaine et al. (2007). The diets were analyzed for nitrogen using Dumas procedure and for amino acids by ion-exchange chromatography (Llames and Fontaine 1994).
Statistical analysis. Experimental data were analyzed as a completely randomized block de-sign using ANOVA procedure of Statgraphics Plus package (Version 3.1., 1994). When a sig-nificant value for treatment effect (P < 0.05) was observed, the differences between means were assessed by Tukey’s HSD test. The experimental
unit was a replicate pen. Linear, quadratic or rec-tilinear (Robbins et al. 2006) models were fitted to experimental data to describe the response of chickens to TIA values found in FFSB and SBM samples. Only treatments with 95% amino acid levels were included into this analysis. Pearson’s correlation coefficients between in vitro indicators of soybean treatment as well as between in vitro indicators and in vivo performance characteristics were calculated. In the change-over part of the experiment, relative pancreas weight was related to time after the diet change.
RESULTS AND DISCUSSION
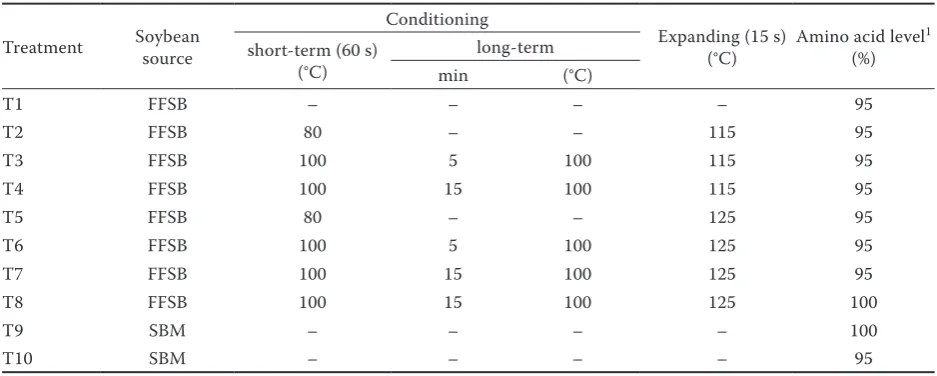
[image:3.595.63.532.112.300.2]Growth experiment. Except for PS, all other in vitro indicators responded strongly to changes in FFSB treatment (Table 4). Urease activity fell almost to zero in treatment 7 while PDI and TIA were reduced to 20% of their initial values (Fig-ure 1). The lowest TIA was slightly above the recommended threshold level of about 4.0 mg/g (Leeson et al. 1987; Loeffler et al. 2012). The in-crease of the expanding temperature from 115 to 125°C (T2 vs T5) resulted in a reduction of PDI and TIA values by 57 and 70%, respectively. The PS gradually decreased from 94 to 89%. Although it has been suggested that this assay may be useful in assessing protein quality in under-processed samples (Araba and Dale 1990b), it is commonly used as an indicator of soybean over-processing (Parsons et al. 1991; Anderson-Haferman et al. Table 1. Processing conditions and treatment characteristics
Treatment Soybean source
Conditioning
Expanding (15 s)
(°C) Amino acid level
1
(%) short-term (60 s)
(°C)
long-term
min (°C)
T1 FFSB – – – – 95
T2 FFSB 80 – – 115 95
T3 FFSB 100 5 100 115 95
T4 FFSB 100 15 100 115 95
T5 FFSB 80 – – 125 95
T6 FFSB 100 5 100 125 95
T7 FFSB 100 15 100 125 95
T8 FFSB 100 15 100 125 100
T9 SBM – – – – 100
T10 SBM – – – – 95
FFSB = full-fat soybeans, SBM = soybean meal
Ta
ble 2. Com
po
sition of die
ts (%, a
s-f ed b asi s) Die t St ar ter ( da ys 0–10) Gr ower ( da ys 11–24) Fini sher ( da ys 25–35) Tr ea tmen t T1–7 T8 T9 T10 T1–7 T8 T9 T10 T1–7 T8 T9 T10 Amino ac id le ve l (%) 95 100 100 95 95 100 100 95 95 100 100 95 FFS B 40.00 40.00 – – 38.92 42.57 – – 33.66 36.8 – – SB M 5.61 8.07 37.18 34.55 – – 31.12 28.45 – – 26.90 24.61 Mai ze 20.00 20.00 20.00 20.00 30.00 30.00 30.00 30.00 35.00 35.00 35.00 35.00 Whe at 29.30 27.36 33.50 36.45 27.09 23.62 29.32 32.31 26.80 23.80 28.74 31.29 Soy be an oil – – 5.07 4.77 0.37 0.19 5.83 5.53 1.19 1.04 5.91 5.65 Dic alc ium pho spha te 1.92 1.92 1.93 1.93 1.70 1.69 1.71 1.71 1.56 1.56 1.58 1.58 C alc ium c arb ona te 1.91 1.35 0.97 0.99 0.75 0.73 0.78 0.80 0.75 0.74 0.78 0.79 So dium c hlor ide 0.31 0.31 0.37 0.37 0.31 0.31 0.37 0.37 0.32 0.32 0.37 0.37 dl -M et hionine 0.27 0.29 0.28 0.25 0.23 0.25 0.24 0.21 0.19 0.21 0.20 0.18 Bioly s ® 1 0.27 0.27 0.29 0.29 0.24 0.24 0.25 0.25 0.19 0.18 0.19 0.20 l-Thr eonine 0.06 0.07 0.06 0.06 0.05 0.06 0.05 0.05 0.04 0.04 0.03 0.03 l-Valine 0.05 0.06 0.05 0.04 0.04 0.04 0.03 0.02 – 0.01 – – Supplemen tar y pr emi x 2 0.30 0.30 0.30 0.30 0.30 0.30 0.30 0.30 0.30 0.30 0.30 0.30 FFS
B = f
ull-f at s oy be ans , S
BM = s
oy be an me al 1ly sine c on ten
t of 50.7%
2 pr emi x f or S tar ter die t supplie
d (mg/kg die
t): r
etin
yl ac
et
at
e 4.64, c
hole calc ifer ol 0.128, dl -α -t oc opher ol ac et at
e 83.0, menadione 3.99, t
hi
amine 3.99, r
ib
ofl
av
in 8.1, py
rido
x-ine 4.5, h
ydr
oxyc
ob
al
amine 0.02, ni
ac
in amide 60.0, p
an
tot
henic ac
id 15.6, biotin 0.2, f
olic ac
id 2.0, c
holine c
hlor
ide 240.0, b
et
aine 138.0, Ma
xib
an 95.0, C
u 17.4, F
e 60.0, Z
n
89.7, Mn 120.0, I 1.0, Co 0.3, M
o 0.5, S
e 0.3; pr
emi
x f
or Gr
ower die
t supplie
d (mg/kg die
t): r
etin
yl ac
et
at
e 4.13, c
hole calc ifer ol 0.128, dl -α -t oc opher ol ac et at
e 56.0, menadione
3.0, t
hi
amine 3.0, r
ib
ofl
av
in 6.0, py
rido
xine 4.1, h
ydr
oxyc
ob
al
amine 0.015, ni
ac
in amide 50.0, p
an
tot
henic ac
id 18.0, biotin 0.2, f
olic ac
id 1.7, c
holine c
hlor
ide 240.0, b
et
aine
100.0, N
ara
sin 70.0, C
u 17.0, F
e 50.0, Z
n 80.0, Mn 100.0, I 1.0, Co 0.4, M
o 0.5, S
e 0.3; pr
emi x f or F ini sher die t supplie
d (mg/kg die
t): r
etin
yl ac
et
at
e 3.43, c
hole calc ifer ol 0.125, dl -α -t oc opher ol ac et at
e 50.0, menadione 3.0, t
hi
amine 2.0, r
ib
ofl
av
in 5.0, py
rido
xine 4.0, h
ydr
oxyc
ob
al
amine 0.013, ni
ac
in amide 40.0, p
an
tot
henic ac
id 14.0, biotin 0.2, f
olic
ac
id 1.5, c
holine c
hlor
ide 198.0, b
et
aine 77.0, C
u 17.0, F
e 50.0, Z
n 80.0, Mn 100.0, I 1.0, Co 0.4, M
o 0.5, S
1992). The critical level of PS associated with maintaining optimal performance is a matter of debate. Lee et al. (1991) reported that a 10% drop in PS resulted in a significant decrease in growth rate of turkeys while Araba and Dale (1990a) and Parsons et al. (1991) identified the critical PS levels at 70 and 59%, respectively. The PS values found in
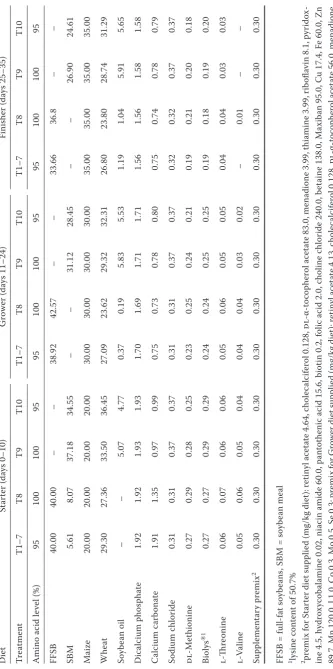
[image:5.595.63.534.112.400.2]the present study thus suggested that none of the FFSB treatment led to soybean over-processing. As indicated by correlation coefficients (Table 4), there was a close correlation between UA, PDI, and TIA, the R values ranging between 0.97 and 0.99. A moderately strong relationship was found between PS and other FFSB processing indicators. Reactive Table 3. Nutrient content of diets (as-fed basis)
Diet Starter (days 0–10) Grower (days 11–24) Finisher (days 25–35)
Treatment T1–7 T8 T9 T10 T1–7 T8 T9 T10 T1–7 T8 T9 T10
Amino acid level (%) 95 100 100 95 95 100 100 95 95 100 100 95
Calculated composition (g/kg)
AMEn (MJ/kg) 12.65 12.65 12.65 12.65 13.20 13.20 13.20 13.20 13.40 13.40 13.40 13.40 Crude protein 225.0 234.4 233.8 224.8 199.3 208.4 207.4 198.4 182.9 190.8 189.9 182.2 Crude fat 87.0 87.2 70.4 67.3 91.0 95.4 79.9 76.8 91.3 95.1 81.7 79.0 SID Lysine 12.1 12.7 12.7 12.1 10.4 11.0 11.0 10.4 9.2 9.7 9.7 9.2
SID Met+Cys 8.7 9.1 9.1 8.7 7.7 8.1 8.1 7.7 7.0 7.4 7.4 7.0
SID Threonine 7.6 8.0 8.0 7.6 6.7 7.0 7.0 6.7 6.0 6.3 6.3 6.0
SID Valine 9.6 10.0 10.0 9.6 8.3 8.8 8.8 8.3 7.4 7.8 7.8 7.4
SID Isoleucine 8.2 8.6 8.6 8.2 7.2 7.6 7.6 7.2 6.5 6.9 6.9 6.5
Analyzed composition (g/kg)
Crude protein 230.2 240.3 238.9 230.7 199.3 206.1 212.6 203.5 182.9 194.1 197.8 183.8 Lysine 13.6 14.3 13.6 13.2 11.8 12.5 12.2 11.6 10.4 11.2 11.2 9.9
Methionine 5.8 6.2 5.9 5.6 5.1 5.2 5.1 4.7 4.6 4.9 4.8 4.2
Cysteine 3.8 4.0 3.7 3.5 3.7 3.8 3.6 3.7 3.3 3.4 3.3 3.2
Threonine 8.9 9.6 9.0 8.9 7.7 8.1 8.1 7.8 7.2 7.6 7.5 6.9
Arginine 15.3 16.2 15.9 15.4 12.6 13.3 13.7 13.1 11.8 12.6 13.0 11.6
Valine 10.8 11.5 11.4 10.9 9.4 9.8 10.0 9.6 8.5 9.2 9.4 8.4
Isoleucine 9.3 9.8 9.8 9.5 8.2 8.6 8.8 8.5 7.6 8.1 8.3 7.4
AMEn = apparent metabolizable energy, SID = standardized ileal digestible
Table 4. In vitro indicators of soybean processing
Treatment Urease activity (mg N/g) Protein dispersibility index (%) KOH protein solubility (%) Trypsin inhibitor activity (mg/g)
T1 4.15 72.2 94.2 27.3
T2 3.88 50.7 99.0 24.0
T3 1.53 34.6 93.3 14.4
T4 1.19 27.1 91.9 8.7
T5 0.42 22.0 90.0 7.2
T6 0.36 24.6 89.5 5.9
T7 0.05 14.7 88.7 5.3
T10 0.01 12.5 80.2 2.6
Pearson’s correlation coefficients
UA – 0.96 0.78 0.99
PDI – – 0.72 0.97
PS – – – 0.80
[image:5.595.66.530.550.738.2]lysine content in raw FFSB expressed as percent-age of total lysine was 92.4. The values found in other FFSB samples ranged between 91.4 and 92.9, thus indicating no deleterious effect of pro-cessing on lysine availability.
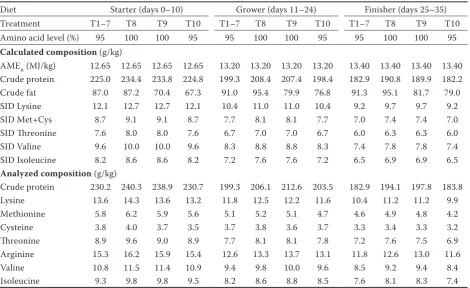
As expected, growth performance of chickens fed raw or under-processed FFSB was markedly reduced in comparison with the SBM-fed birds (Table 5). At 95% amino acid level, both weight gain (WG) and feed conversion ratio (FCR) were maximized in treatment 6 and were not significantly different from those obtained with SBM-based di-ets. Similar results were reported by other authors comparing SBM and properly heat-treated FFSB included into broiler diets at moderate levels (Her-kelman et al. 1991; Perilla et al. 1997; Mirghelenj et al. 2013). Increasing the amino acid concentration from 95 to 100% of the requirement resulted in an insignificant improvement of growth rate and FCR in both types of diet. Feed intake followed a similar trend as growth performance. In contrast, Perilla et al. (1997) reported a negative relationship between extrusion temperature and feed intake in chickens fed FFSB-based diets. Carcass and breast meat yields responses to processing time and temperature were similar to those of growth rate and FCR (Table 6). Relative pancreas weight was reduced from 4.47 g/kg in raw FFSB to 1.85 g/kg in treatment 3. In other treatments, the values ranged between 1.73 and 2.26 g/kg including birds fed SBM-based diets. The only exception was
treat-ment 5 in which unexpectedly higher pancreas weights were found.
[image:6.595.62.535.525.739.2]It is generally accepted that the reduction of chicken performance and pancreatic hypertrophy is largely due to the presence of trypsin inhibitors in raw soybeans (Applegarth et al. 1964; Han and Parsons 1991; Leeson and Atteh 1996; Foltyn et al. 2013). In the present study, a close correlation was found between in vivo chicken response and in vitro indicators of FFSB treatment (Table 7). TIA and PDI were the best predictors of chicken growth performance. The relationships between TIA and WG or FCR in chickens fed FFSB-based diets are shown in Figure 2. Growth rate and FCR did not change appreciably at TIA levels below 15 mg/kg which suggests that the TIA threshold might be higher than the commonly accepted val-ues of 4–5 mg/kg (Leeson et al. 1987; Leeson and Atteh 1996). PDI is considered to be a sensitive indicator of minimum adequate heat processing of SBM (Batal et al. 2000). The results of the present study suggest that, to attain sufficient heat treat-ment, the PDI value should not exceed 30–35%. A slightly higher threshold (45%) was suggested by Batal et al. (2000) while the American Soybean Association recommended optimum PDI between 15 and 30% (Balloun 1980). In accordance with the results of other studies (Anderson-Haferman et al. 1992; Ruiz et al. 2004), a relatively weak cor-relation was found between KOH protein solu-bility and in vivo characteristics which indicated Table 5. Effects of soybean treatment on growth performance of chickens
Feed intake (g/day) Weight gain (g/chick) Feed conversion ratio Days 1–10 11–24 25–35 1–35 1–10 11–24 25–35 1–35 1–10 11–24 25–35 1–35
Treatment
T1 28.2a 72.3c 133.8d 79.0d 137d 602c 560d 1299d 2.07a 1.68a 2.66a 2.13a
T2 28.1a 76.1c 142.6cd 83.2cd 157c 737b 664cd 1558c 1.79b 1.45b 2.37ab 1.87b
T3 29.0a 88.3ab 146.0bcd 89.4bc 211ab 875a 756bc 1842b 1.38c 1.42b 2.15bc 1.70cd
T4 29.3a 91.0ab 162.0ab 95.6ab 220ab 930a 791abc 1940ab 1.34c 1.37b 2.26bc 1.73bcd
T5 27.9a 85.4b 153.5abc 90.4b 204b 837ab 782abc 1823b 1.38c 1.43b 2.17bc 1.74bc
T6 29.5a 93.5a 166.5a 98.0a 228ab 953a 880ab 2060a 1.30c 1.38b 2.08bc 1.66cd
T7 29.8a 91.6ab 158.1abc 94.8ab 221ab 930a 791abc 1942ab 1.35c 1.39b 2.21bc 1.71cd
T8 29.0a 91.8ab 161.1ab 95.5ab 223ab 945a 933a 2101a 1.30c 1.36b 1.91c 1.59cd
T9 31.2a 88.8ab 159.0ab 94.3ab 229ab 939a 917a 2086a 1.36c 1.32b 1.92c 1.58d
T10 30.9a 90.0ab 147.8bcd 91.3ab 232a 882a 800abc 1914ab 1.33c 1.44b 2.06bc 1.68cd
Pooled SEM 0.79 1.71 3.48 1.50 5.5 26.6 32.6 41.2 0.051 0.033 0.084 0.032
that this index was not sufficiently sensitive for evaluating protein quality of underprocessed FFSB. Correlation coefficients for UA were comparable with those for TIA and PDI thus suggesting that, under conditions of the present study (i.e. using FFSB not impaired by over-processing), this assay may be a good predictor of chicken performance. However, as shown by Dale et al. (1986) and Par-sons et al. (1991), UA is unsuitable for detecting over-processed FFSB or SBM samples. There was a negative correlation between TIA and relative pancreas weight but, in contrast to other reports (Herkelman et al. 1991; Perilla et al. 1997; Clarke and Wiseman 2007), only a moderately strong relationship between the variables was observed (Figure 3). Even though significant differences were found between most of the treatments, pancreas
weights in treatments 1–7 and 10 ranged within a relative narrow limit, thus suggesting that the pancreas to BW ratio might not be a sensitive indicator of TIA at lower trypsin inhibitor levels. Nevertheless, linear regression model relating the present growth performance data to relative pan-creas weight showed a good relationship between the variables. The regression equations were y = 2532 – 286.4x (R2 = 0.78) and y = 1.301 + 0.1861x
(R2 = 0.77) for WG and FCR, respectively.
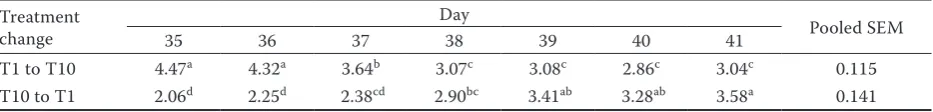
Changeover experiment. Switching the dietary treatments from T1 to T10 and vice versa resulted in rapid changes in pancreas weights. During the first 3 days after the switch from raw FFSB to the SBM diet, relative pancreas weight decreased by 31%. When the SBM diet was replaced by the raw FFSB diet, relative pancreas weight on day 4 0
20 40 60 80 100 120
1 2 3 4 5 6 7
Indicator change (%)
Treatment No. UA
PDI KOH
1.5 1.6 1.7 1.8 1.9 2.0 2.1 2.2
1000 1200 1400 1600 1800 2000 2200 2400
0 5 10 15 20 25 30
Feed conversion ratio
Weight gain (g)
[image:7.595.75.273.98.227.2]Trypsin inhibitor activity (mg/g) Figure 1. Effect of various treatments of full-fat soybeans
on various in vitro indicators (% of initial value)
[image:7.595.72.275.536.669.2]UA = urease activity, PDI = protein dispersibility index, KOH = potassium hydroxide
Figure 2. Weight gains (WG) (■) and feed converson ratio (FCR) (□) of chickens (1–35 days of age) in relation to trypsin inhibitor activity. The points are treatment means. Plotted from the equations y1 = 1920.0, y2 = 3441.8 – 78.49x, R2 =
0.78 (WG) and y1 = 21.89, y2 = 0.148 + 0.071x, R2 = 0.78 (FCR)
0.0 1.0 2.0 3.0 4.0 5.0
0 5 10 15 20 25 30
Pancreas weight (g/kg BW)
Trypsin inhibitor activity (mg/g) Raw FFSB FFSB 115°C FFSB 125°C SBM
1.0 1.5
2.0 2.5
3.0 3.5
4.0 4.5
5.0 5.5
34 35 36 37 38 39 40 41 42
Pancreas weight (g/kg BW)
Days
Figure 4. Relative pancreas weights of chickens after the changeover from treatments T1 to T10 (●) and T10 to T1 (○), respectively, during six following days. The points are treatment means. Plotted from the equations
y = 101.98 – 4.918x + 0.0610x2, R2 = 0.80 (T1 to T10) and
y = –7.501 + 0.272x, R2 = 0.71 (T10 to T1)
BW = body weight Figure 3. Relative pancreas weights of chickens at 35 days
of age in relation to trypsin inhibitor activity. The points are treatment means. Plotted from the equation y = 1.563 + 0.0772x, R2 = 0.62
[image:7.595.307.529.544.662.2]increased by 65%. No significant changes were observed on days 5 and 6 (Table 8) even though there was a further numerical increase in pancreas weight. As shown in Figure 4, the response of T10 to T1 chickens was linear (P < 0.001), thus suggesting that the final pancreas weight might reach a similar level as that found in T1 chickens on day 35. On the other hand, the recovery of T1 to T10 chickens does not seem to follow a linear pattern. Very little information is available on the time-course of the pancreatic response to trypsin inhibitors in poultry. Madar (1979) found that pancreatic hypertrophy in chickens fed Bowman-Birk soybean trypsin inhibitor was evident after a minimum of 7 days of feeding. In contrast, Duarte et al. (2014) reported that the pancreas weight and pancreatic enzyme activities of feed-restricted chickens returned to normal after 3 days of realimentation. In experiments with rats, Rackis (1965) observed maximum pancreatic hyper-trophy within 9 days after feeding raw SBM while Oates and Morgan (1984) found that a significant increase in pancreatic weight was apparent in rats
[image:8.595.65.533.113.285.2]already after 2 days of feeding raw soybean flour. It has been shown that the trypsin inhibitor-induced pancreatic enlargement is mediated through a nega-tive feedback mechanism regulating enzyme secre-tion in response to the concentrasecre-tion of trypsin or chymotrypsin in the upper part of the small intes-tine (Schneeman and Lyman 1975). The process is under hormonal control by cholecystokinin (CCK), the release of which is inhibited by intraduodenal proteases (Slaff et al. 1984). When the activity of intestinal proteases is reduced by soybean trypsin inhibitor, CCK production is stimulated which results in an increased secretion of pancreatic enzymes and consecutive pancreatic hypertrophy (Grant et al. 1995; Clarke and Wiseman 2005). In experiments with chickens, Furuse et al. (1990) observed a con-siderable increase in plasma CCK within 90 min of feeding a diet supplemented with soybean trypsin inhibitors. The pancreatic response to CCK was also quick; continuous infusion of CCK in rats caused pancreatic hyperplasia already after 36 h of infu-sion. Conversely, blockage of endogenous CCK by Table 6. Effects of soybean treatment on carcass characteristics of chickens
Treatment BW (g) Carcass (% BW) Breast meat (% BW) Pancreas (g/kg BW)
T1 1447e 62.46d 16.44c 4.470a
T2 1677d 64.92c 18.43b 2.920b
T3 1972bc 66.54abc 19.87ab 1.850f
T4 2115ab 67.08ab 19.33ab 2.000e
T5 1892c 66.23bc 19.00ab 2.567c
T6 2183a 67.94a 20.25a 1.734g
T7 2046abc 66.94ab 19.31ab 2.258d
T8 2197a 67.00ab 20.17a 1.848f
T9 2159a 67.31ab 19.79ab 1.856f
T10 2061ab 67.69ab 19.45ab 2.062e
Pooled SEM 15.1 0.292 0.292 0.0222
BW = body weight
a–gmeans within a column not sharing a common superscript were significantly different (Tukey’s HSD test, P < 0.05)
Table 7. Pearson’s correlation coefficients describing the relationships between in vivo chicken parameters and in vitro
indicators of full-fat soybeans treatment(calculated for treatments 1–7)
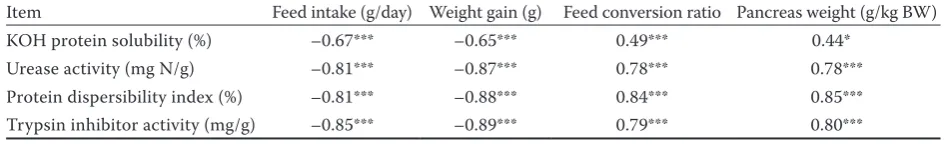
Item Feed intake (g/day) Weight gain (g) Feed conversion ratio Pancreas weight (g/kg BW)
KOH protein solubility (%) –0.67*** –0.65*** 0.49*** 0.44*
Urease activity (mg N/g) –0.81*** –0.87*** 0.78*** 0.78***
Protein dispersibility index (%) –0.81*** –0.88*** 0.84*** 0.85*** Trypsin inhibitor activity (mg/g) –0.85*** –0.89*** 0.79*** 0.80***
[image:8.595.61.534.654.726.2]a receptor antagonist led to decreased pancreas weight after 3 days of infusion (Ohlsson et al. 1995). Similarly, Brannon (1990) in her review on pancreas adaptations concluded that diet-induced changes in pancreatic enzyme synthesis occur within several hours. Whether or not the pancreatic enlargement may be fully reversed after switching to a TIA-free diet, is not clear. In the present experiment, the relative pancreas weight significantly decreased during the first 3 days of T1 to T10 changeover, but did not reach the values found in SBM-fed chickens at day 35 (Figure 4). In contrast, Booth et al. (1964) found that pancreatic hypertrophy in rats fed raw SBM-based diet was reversible when a casein-based diet was fed for 71 days. However, the time-course of the recovery phase was not studied in detail in this experiment.
REFERENCES
Anderson-Haferman J.C., Zhang Y., Parsons C.M., Hymowitz T. (1992): Effect of heating on the nutritional quality of Kunitz-trypsin-inhibitor-free and conventional soybeans for chicks. Poultry Science, 71, 1700–1709.
AOCS (1996): Official Methods and Recommended Practi-ces of the American Oil Chemists’ Society. AOCS Official Method Ba 10-65. 4th Ed. American Oil Chemists’ Society,
Champaign, USA.
Applegarth A., Fruta F., Lepkovsky S. (1964): Response of the chicken pancreas to raw soybeans. Poultry Science, 43, 733–739.
Araba M., Dale N.M. (1990a): Evaluation of protein solu-bility as an indicator of overprocessing soybean meal. Poultry Science, 69, 76‒83.
Araba M., Dale N.M. (1990b): Evaluation of protein solubi-lity as an indicator of underprocessing of soybean meal. Poultry Science, 69, 1749–1752.
Balloun S.L. (1980): Effect of processing on the nutritional value of soybean meal for poultry. In: Lepley K.C. (ed.): Soybean Meal in Poultry Nutrition. Ovid Bell Press, Fulton, USA, 36–55.
Batal A.B., Douglas M.W., Engram A.E., Parsons C.M. (2000): Protein dispersibility index as an indicator of adequately processed soybean meal. Poultry Science, 79, 1592–1596.
Booth A.N., Robbins D.J., Ribelin W.E., De Eds F., Smith A.K., Rackis J.J. (1964): Prolonged pancreatic hyper-trophy and reversibility in rats fed raw soybean meal. Proceedings of the Society for Experimental Biology and Medicine, 116, 1067‒1069.
Brannon P.M. (1990): Adaptation of the exocrine pancreas to diet. Annual Review of Nutrition, 10, 85‒105. Clarke E., Wiseman J. (2005): Effects of variability in trypsin
inhibitor content of soya bean meals on true and apparent ileal digestibility of amino acids and pancreas size in broiler chicks. Animal Feed Science and Technology, 121, 125–138. Clarke E., Wiseman J. (2007): Effects of extrusion conditi-ons on trypsin inhibitor activity of full fat soybeans and subsequent effects on their nutritional value for young broilers. British Poultry Science, 48, 703–712.
Dale N., Charles O.W., Duke S. (1986): Reliability of urease activity as an indicator of overprocessing of soybean meal. Poultry Science, 65 (Suppl. 1), 164.
Duarte C.R.A., Vicentini-Paulino M.L.M., Pinheiro D.F. (2014): Digestive enzymatic responses of chickens feed-restricted and refed as affected by age. Journal of Poultry Science, 51, 289‒296.
Foltyn M., Rada V., Lichovnikova M., Safarik I., Lohnisky A., Hampel D. (2013): Effect of extruded full-fat soybeans on performance, amino acids digestibility, trypsin activity, and intestinal morphology in broilers. Czech Journal of Animal Science, 58, 470–478.
Fontaine J., Zimmer U., Moughan P.J., Rutherfurd S.M. (2007): Effect of heat damage in an autoclave on the reac-tive lysine contents of soy products and corn distillers dried grains with solubles. Use of the results to check on lysine damage in common qualities of these ingredients. Journal of Agricultural and Food Chemistry, 55, 10737–10743. Furuse M., Yang S.I., Muramatsu T., Okumura J. (1990):
[image:9.595.64.531.114.170.2]Enhanced release of cholecystokinin by soya-bean trypsin inhibitor in chickens. Scandinavian Journal of Gastroen-terology, 25, 1242‒1246.
Table 8. Mean relative pancreas weights during the change-over experiment (g/kg BW; n = 30)
Treatment
change 35 36 37 Day38 39 40 41 Pooled SEM
T1 to T10 4.47a 4.32a 3.64b 3.07c 3.08c 2.86c 3.04c 0.115
T10 to T1 2.06d 2.25d 2.38cd 2.90bc 3.41ab 3.28ab 3.58a 0.141
BW = body weight
Grant G., Dorward P.M., Buchan W.C., Amour J.C., Pusztai A. (1995): Consumption of diets containing raw soya beans (Glycine max), kidney beans (Phaseolus vulgaris), cowpeas (Vigna unguiculata) or lupin seeds (Lupinus angustifolius) by rats for up to 700 days. Effects on body composition and organ weights. British Journal of Nutrition, 73, 17–29. Han H., Parsons C.M. (1991): Nutritional evaluation of soy-beans varying in trypsin inhibitor content. Poultry Science, 70, 896‒906.
Herkelman K.L., Cromwell G.L., Stahly T.S. (1991): Effects of heating time and sodium metabisulfite on the nutritional value of full-fat soybeans for chicks. Journal of Animal Science, 69, 4477‒4486.
Lee H., Garlich J.D., Ferket P.R. (1991): Effect of overcooked soybean meal on turkey performance. Poultry Science, 70, 2509–2515.
Leeson S., Atteh J.O. (1996): Response of broiler chicks to dietary full-fat soya beans extruded at different tempera-tures prior to or after grinding. Animal Feed Science and Technology, 57, 239–245.
Leeson S., Atteh J.O., Summers J.D. (1987): Effects of inc-reasing dietary levels of commercial heated soybeans on performance, nutrient retention and carcass quality of broiler chickens. Canadian Journal of Animal Science, 67, 821‒828.
Liener I.E., Kakade M.L. (1980): Protease inhibitors. In: Liener I.E. (ed.): Toxic Constituents of Plant Foodstuffs. Academic Press, New York, USA.
Llames C.R., Fontaine J. (1994): Determination of amin acids in feeds: collaborative study. Journal of AOAC Interna-tional, 77, 1362–1402.
Loeffler T., Baird S.R., Batal A.B., Beckstead R. (2012): Effects of trypsin inhibitor levels in soybean meal on broiler per-formance. Poultry Science, 91 (Suppl. 1), 42.
Madar Z. (1979): Kinetics of native and modified Bowman– Birk soya-bean trypsin inhibitor on growth and enzymes activities of the chick pancreas. British Journal of Nutri-tion, 42, 121‒126.
Mirghelenj S.A., Golian A., Kermanshahi H., Raji A.R. (2013): Nutritional value of wet extruded full-fat soybean and its effects on broiler chicken performance. Journal of Applied Poultry Research, 22, 410‒422.
Oates P.S., Morgan R.G.H. (1984): Short-term effects of feeding raw soya flour on pancreatic cell turnover in the rat. American Journal of Physiology – Gastrointestinal and Liver Physiology, 247, G667‒G673.
Ohlsson B., Axelson J., Sternby B., Rehfeld J.F., Ihse I. (1995): Time-course of the pancreatic changes following long-term stimulation or inhibition of the CCK-A receptor. Interna-tional Journal of Pancreatology, 18, 59‒66.
Parsons C.M., Hashimoto K., Wedekind K.J., Baker D.H. (1991): Soybean protein solubility in potassium hydroxide: an in vitro test of in vivo protein quality. Journal of Animal Science, 69, 2918–2924.
Perilla N.S., Cruz M.P., de Belalcazar F., Diaz G.J.. (1997): Effect of temperature of wet extrusion on the nutritional value of full fat soya beans for broiler chickens. British Poultry Science, 38, 412–416.
Rackis J.J. (1965): Physiological properties of soybean trypsin inhibitors and their relationship to pancreatic hypertrophy and growth inhibition of rats. Federation Proceedings, 24, 1488–1493.
Robbins K.R., Saxton A.M., Southern L.L. (2006): Estimation of nutrient requirements using broken-line regression ana-lysis. Journal of Animal Science, 84 (Suppl.), E155–E165. Ross Broiler Management Manual (2009). Aviagen, Newbridge,
Midlothian, UK.
Ross Nutrition Supplement (2009). Aviagen, Newbridge, Midlothian, UK.
Ruiz N., de Belalcazar F., Diaz G.J. (2004): Quality control parameters for commercial full-fat soybeans processed by two different methods and fed to broilers. Journal of Applied Poultry Research, 13, 443–450.
Schneeman B.O., Lyman R.L. (1975): Factors involved in the intestinal feedback regulation of pancreatic enzyme secretion in the rat. Proceedings of the Society for Experi-mental Biology and Medicine, 148, 897‒903.
Slaff J., Jacobson D., Tillman C.R., Curington C., Toskes P. (1984): Protease-specific suppression of pancreatic exo-crine secretion. Gastroenterology, 87, 44‒52.
Waldroup P.W. (1982): Whole soybeans for poultry feeds. World’s Poultry Science Journal, 38, 28‒35.
Received: 2015–04–29 Accepted after corrections: 2015–06–18
Corresponding Author
Prof. Ing. Jiří Zelenka, CSc., Mendel University in Brno, Faculty of Agronomy, Department of Animal Nutrition and Forage Production, Zemědělská 1, 613 00 Brno, Czech Republic