Abstract — Incoming wind flow to upstream wind turbine can be affected by the presence of the downwind turbines resulting in reduced performance of the upstream turbine. Meanwhile, the wake effect of the upstream turbine to downwind turbines varies according to its configuration and direction of rotation. In this study, the effect of varying wind turbine array configuration and rotation were explored. There was a reduction in the performance of both the upwind and second (back) row turbines when the cluster tends to form a straight line perpendicular to the flow of the free-stream wind. On the other hand, there was no significant variation observed to different combination of turbine rotations studied in the CFD simulation.
Index Terms—array configuration, CFD, VAWT, wake
I. INTRODUCTION
espite being unpopular in the earlier days of the commercial application of wind turbines which was dominated by HAWT, there was a revival of interest in VAWT technology as several universities and research institutions carried extensive research activities using aerodynamic computational models [1]. For example, researchers at Caltech stated that cautiously designing VAWT farms may result in the generation of power output that is ten times greater than a HAWT wind farm with the same area [2]. Many studies explored VAWT’s unique characteristic – synergistic arrangement of vertical axis wind turbines result in increased power output compared to equivalent isolated wind turbine due to the effect of turbine wake. Various research findings from experiments of Shaheen and Abdallah, Hezavah, et al, Whittlesey, and Bons all shows improvement to the over-all performance of the turbine array arranged in triangular cluster configuration ranging from 26% to 37% compared to isolated counterparts [3], [4], [5], [6].
Factors such as the distance between turbines, the oblique angle and whether turbine counter-rotate or co-rotate with each other might have effects to the development of turbine wake. In Lam’s wind tunnel experiment, it was found out that a pair of twin, co-rotating (CR) VAWT exhibit asymmetric patterns and at turbine spacing equivalent to twice
J.E. Silva, B. Sc. is a M.Sc. student of the Energy Engineering Program, University of the Philippines Diliman (email: [email protected]).
L.A.M. Danao, PhD is an Associate Professor of the Department of Mechanical Engineering, University of the Philippines Diliman (corresponding author, e-mail: [email protected]).
the turbine’s diameter, the wakes of the turbines evolved independently and the mutual interference is negligible [7]. Moreover, the individual wakes gradually bridged and interact with each other as the downstream distance increases. For a backward counter-rotating (CBR) pair of twin-turbines, the same experiment concluded that there was almost no interaction between their respective wakes, and contribute little to wake recovery. Forward counter-rotating turbines (CFR), on the other hand, shows progressive wake interactions contributing to fast wake recovery. The study concluded that forward counter-rotating pair of turbines exhibited the highest interaction (smallest wake expansion) between individual wakes, followed by the co-rotating and backward counter-rotating turbine pairs.
The presence of downstream wind turbine may also affect the wind flow velocity of the incoming wind to the upstream turbine. In the wind tunnel experiment of Medici, et al it was found out that the presence of a wind turbine can be felt at an upstream distance greater than three times the rotor diameter and the wind speed as perceived by the rotor was decreased to 95%-98% compared to the free-stream wind flow [8].
Finally, the research of Ilev proved that the “undisturbed air” was decreased or increased in specific upwind location before it meets the wind park [9].
II. METHODOLOGY
A. Model Development
The dimension, properties and characteristics of the wind turbine clusters are represented in a computational domain composed of a rotating (inner) sub-domain and stationary (outer) sub-domain. The computational domain was simulated in a 2-dimensional model (Fig. 1). The validity of using 2-dimensional modeling rely on the assumption that the stream-wise velocity component of the wind is much bigger compared to its span-wise component and due to the fact the turbine airfoils are long and slender [10]. NACA 0025 was used as the airfoil for the model.
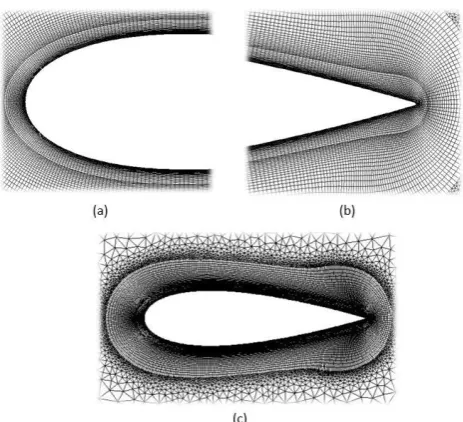
Finer mesh was employed to the rotating sub-domain where the turbine components i.e. airfoil blades and hub are located (Fig. 2). Because most of the important flow physics happen in this region, particular attention was given to the first cell height by considering a characteristic value, y+. For this study, y+ value was kept below 5 as required by the CFD software. Over-all, there are 102,000 cells per rotating sub-domain (Fig 3a).
VAWT Cluster Parameter Study on Overall
Cluster Performance, Part II: Oblique Angles
and Direction of Rotation
Jeffrey E Silva, and Louis Angelo M. Danao, Member, IAENG
Fig. 1. Computational Domain for Single Turbine
Fig. 2. Near blade mesh: (a) Leading Edge-Mesh (b) Trailing Edge-Mesh (c) Airfoil Near-Blade Mesh
(a) (b)
Fig. 3. Unstructured domain mesh (a) Rotor Mesh (b) Outer Mesh.
The stationary sub-domain, composed of the domain inlet, walls, pressure outlet and circular openings coincident with the placement of the rotation mesh has about 19,000 cells (Fig 3b).
The k-ω SST (Shear Stress Transport), a two-equation eddy viscosity turbulence model was chosen as CFD model for this study. The k-ω SST take advantage on the versatility of k-ω model at the inner boundary layer and combines it with the k-ε model when solving at the outer region of and outside the boundary layer resulting in highly accurate predictions on the onset and the amount of flow separation under adverse pressure gradients. Detailed explanation and validation for choosing k-ω SST was elaborated in the paper “VAWT Cluster Parameter Study on Overall Cluster
Performance, Part I: Model Development and Rotor Spacing” by Silva and Danao [11].
The computational domain was simulated in Ansys Fluent 15.0, a CFD package which uses the Finite Volume Method to solve governing equations for fluid flows. Second order discretization for improved simulation accuracy, pressure-based coupled velocity coupling and least square cell-pressure-based gradient evaluation settings were used throughout the study. Free stream, steady wind velocity of 5 m/s was set at the inlet of the computation domain directed towards the turbine and out to the outlet boundary.
A minimum of 10 full rotations were performed for each simulation case, and the last 3 rotations were analyzed. If the numerical average of the last three rotations agrees to within ± 3%, and all monitored residuals are below 10-5, the result
of the simulation was accepted. Otherwise, the case was subjected to another 10 full rotations.
To determine the tip speed ratio and the time step size to be used in this study, a single turbine was simulated at four different tip speed ratios (λ = 2, 3, 4 and 5) in 3 different time step sizes (Δt = 0.5°ω-1, 1.0°ω-1, and 2.0°ω-1) for a total
of 12 simulations. The results obtained shows that there was not any significant variation to the torque profile across the different time step size investigated and the maximum power coefficient was found at λ = 4, consistent with previously published studies on the performance of VAWT. Therefore, the tip speed ratio chosen was 4 and the time step size to be used in subsequent simulations is 2.0°ω-1 to reduce the
durationof the simulation. It is advisable for the readers to refer to paper by Silva and Danao [11] for the detailed discussion of the model development of this study.
B. Turbine spacing
Three turbines arranged in triangular configuration were simulated at fixed oblique angle of 60° for three different equivalent rotor diameter spacing: 4 rotor diameter, 8 rotor diameter and 12 rotor diameter. It was found out that at closer turbine spacing, the local velocity increases due to the funneling effect resulting in higher performance coefficient. Further, it was found out that at the farthest turbine spacing (i.e. 12 equivalent rotor diameter distance), the effect of the funneling degraded and the performance of the individual turbines is essentially identical to the performance of a single, isolated turbine. The simulation of tip speed ratio and time-step study versus turbine spacing were covered in reference [11] and thus the reader is directed to the paper for more detailed explanation and results.
Fig. 4. Summary of power coefficient computed across different turbine spacing. For comparison, the power coefficient for a single
[image:2.595.47.288.458.596.2] [image:2.595.309.548.605.745.2]C. Simulation Phases
[image:3.595.304.549.56.582.2]The 4 equivalent rotor distance spacing was selected and will be used for the subsequent simulations. The next phase of the study consist of simulations aimed at finding the best performance at different internal angles of the turbine cluster (Fig. 5). Finally, wind turbine rotations were reversed to see if there were significant effect to the performance of the cluster when turbines were rotating at different directions. The turbine at the upwind position was designated as Turbine 1 while the turbine located at the left and right downwind positions are Turbine 2 and Turbine 3, respectively.
Fig. 5. Computational Domain for Turbine Angle Study
III. RESULTSANDDISCUSSION
A. Varying Oblique Angles
It was found out that decreasing spacing from 12 rotor distances to 4 rotor distances among turbines resulted in improved performance for the cluster at an oblique angle fixed to 60°. The most compact turbine array (i.e. least distance between turbines) yields the maximum performance exhibiting an increase of +4.97% compared to the performance of isolated turbine. Decreased turbine spacing leads to restriction and free-stream wind flows exhibit relatively higher velocities compared to turbine arrays with wider spacing [11].
[image:3.595.45.287.208.345.2]Another factor that may affect the compactness of the turbine cluster is the internal angle (i.e. oblique angle) among the turbines. For the same oblique distance between Turbine 1 and Turbine 2, the horizontal and vertical distance components will be different when we changed the oblique angles between the two turbines. For example, by changing the oblique angle from 60°to 45°at fixed oblique distance of 4 rotor diameters, the distance at x-direction will be decreased by 2.39 units while the y-component will be increased by 3.10. To investigate if there are significant variations to the cluster performance at different oblique angles, the computational domain was simulated at varying angles of 0°, 15°, 30°, 45°, 60°, 75°.
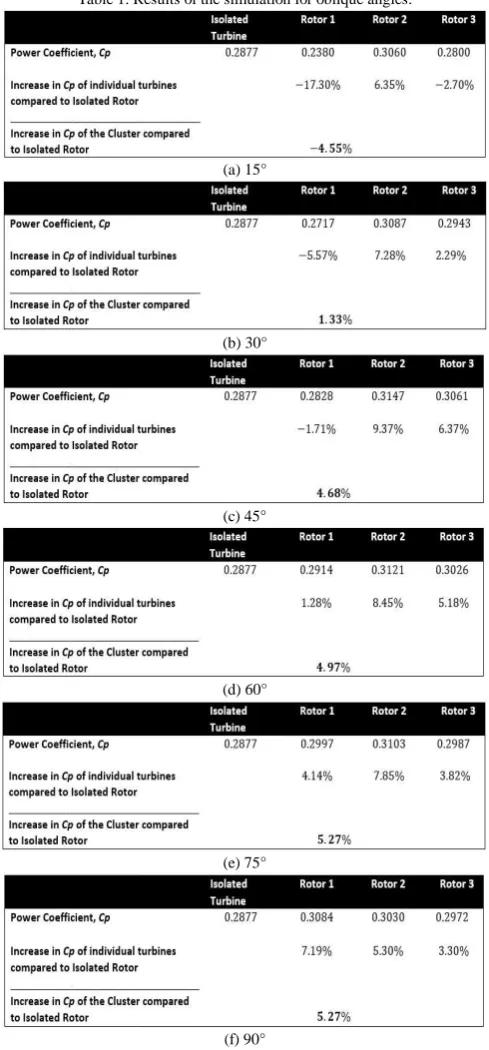
Table 1. Results of the simulation for oblique angles.
(a) 15°
(b) 30°
(c) 45°
(d) 60°
(e) 75°
(f) 90°
It can also be seen from Fig. 6 that for almost all simulated cases, the performance of the turbines are greater than the isolated turbine performance. Exception is taken for the extreme case of internal angle of 15° where the Cp of Turbine 1 is at 0.2380. Also with slightly lower Cp’s than the
isolated case are Turbine 3 for 15° internal angle, and Turbine 1 at 30° and 45° internal angles. To further emphasize the trends, Fig. 7 shows a plot of the power coefficient versus the internal angle for the individual turbines and the cluster performance. It is evident that the cluster performance increases as internal angle increases. Also observed is the best case for both Turbine 2 and Turbine 3 where their Cp’s peak at an internal angle of 45°
while Turbine 1 Cp follows the increasing trend of the cluster
[image:4.595.304.547.135.612.2]Cp as internal angle increases.
[image:4.595.58.278.241.391.2]Fig. 6. Summary of power coefficient computed at varying internal angles.
Fig. 7. Trends in the power coefficient at Varying Internal Angles
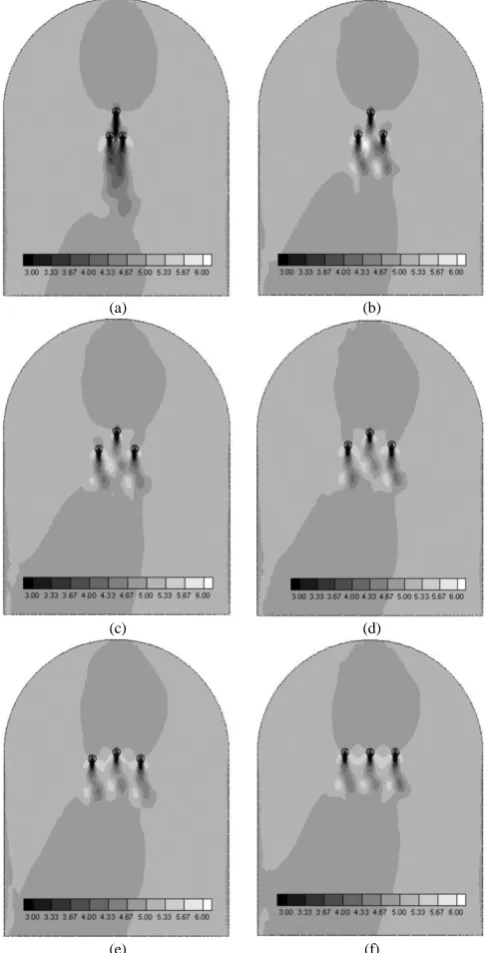
A look at the velocity contour in the frontal vicinity of the turbines at 15° would show that the velocity of the wind incoming to the downwind turbines was greatly affected by the wake of the upwind turbine (Fig. 8a). Large low velocity wind stream was being received by the downwind turbines, represented by the blue and light shade of orange. Also, the long wake of the upwind turbine is evidence that wake recovery is delayed further inducing wake blockage. When the downwind turbines started to align with Turbine 1 (i.e. increasing oblique angle with respect to upwind turbine), the low velocity wind wake coming from Turbine 1 started to weaken its influence on Turbine 2 and 3 due to angle separation. Hence, it is observed that the performance of these turbines improved until the oblique angle reaches 45° (Fig. 8c). From 60° to 90° (Figs. 8d – 8f), the free stream wind approaching Turbines 2 and 3 gradually decrease in
velocity wind stream received by Turbine 1. At 90° oblique angle, the performance of Turbine 1 continues to improve. Fig. 9 shows the torque ripple of one blade for Turbine 1 in one rotation at different oblique angles, showing a slight but visible reduction in torque for internal angle case of 15° in both upwind and downwind stroke.
(a) (b)
(c) (d)
(e) (f)
Fig. 8. Plots of velocity magnitude in the domain at a) 15° b) 30° c) 45° d) 60° e) 75° and f) 90° oblique angles.
[image:4.595.54.274.429.560.2]also decreased due to the rotational effects caused by the interactions of incoming wind flow to the surrounding flow and propagated to the upwind. This effect is called the cluster effect [9]. By looking into the velocity profile of the wind stream flow near the turbines, we can verify numerically the reduction in the velocities. A velocity monitor was placed one-half rotor distance away from the airfoil to the front of each turbines. At 15°oblique angle, the average wind flow in front of Turbine 1 is 4.524 m/s while at 90°oblique angle, the average wind velocity is 4.673 m/s. The effect of higher wind speed at 90°oblique angle leads to increased generated forces at rotor blades and consequently to higher turbine performance.
Fig. 9. Torque ripple of one blade for Turbine 1 at various oblique angles.
B. Varying Rotational Direction
All previously performed simulations had turbines rotating in the same counter clockwise direction. Another interesting variation in a turbine array is to examine the effect to the performance of the turbines when the rotation of the turbines are reversed. Some literature experimented about the effect of reversing turbine rotation. For example, Zanforlin, et al found out that the counter-rotating vortical motion are beneficial to rapid wake recovery of a pair of wind turbines [12]. Lam and Peng, meanwhile systematically measured the wake aerodynamics of co-rotating and counter-rotating (both backward and forward) turbine pair in a wind-tunnel experiment. In this study, seven additional simulations were performed to check the effect of reversing the turbine rotations.
Fig. 10. Computed power coefficients at varying rotational directions.
(a) (b)
(c) (d)
(e) (f)
[image:5.595.48.294.219.366.2](g) (h)
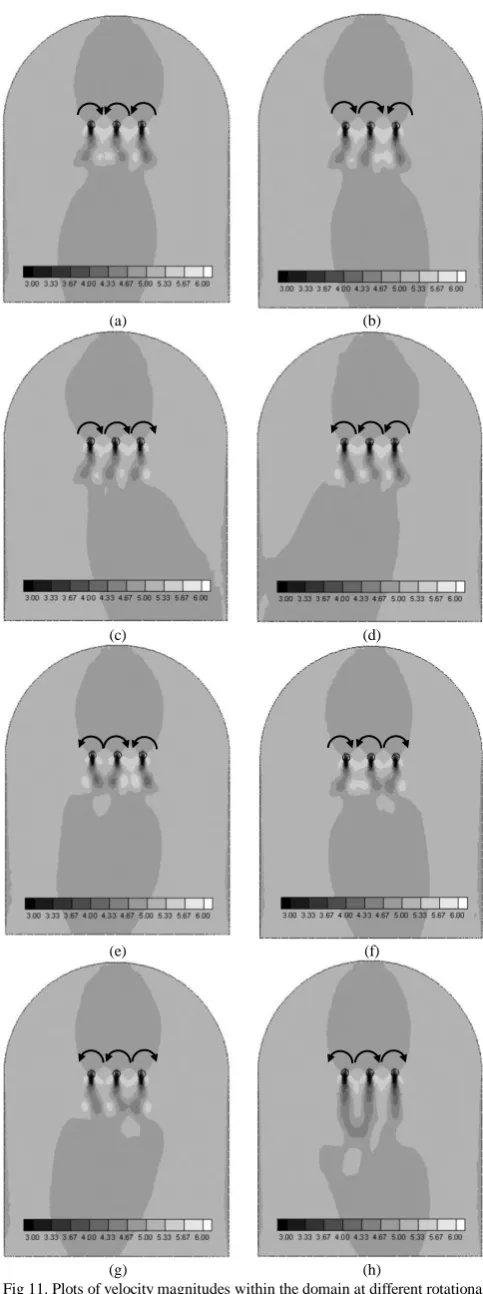
Fig 11. Plots of velocity magnitudes within the domain at different rotational direction combinations of the three turbines (from left to right):
a) CW-CCW-CCW b) CW-CW-CCW c) CW-CW-CW d) CCW-CCW-CCW e) CCW-CW-CCW f) CW-CCW-CW
[image:5.595.54.289.584.752.2]Fig. 10 shows the computed power coefficients of the simulations for eight different combinations of three wind turbines cluster placed perpendicular to the incoming wind stream. It can be seen that the center turbine consistently has higher Cp than the outer turbines. It can also be observed that mirror image cases do not show mirrored performance predictions. The first two cases are mirror images of each other. The same is true for the third and fourth, the fifth and sixth, and lastly, the seventh and eighth. This could be a numerical variation due to the use of the same outer stationary domain for all simulations with some degree of asymmetry in the unstructured mesh resulting in a slight difference in performance prediction. However, the over-all average cluster performance does not vary much among the different combinations. Visually, it can be observed in Fig. 11 that the direction of the wake of a rotor in counter-clockwise rotation is toward the right of the computational domain. This observation is consistent with Lam’s wind tunnel experiment - positive cross-stream velocities suggest constant sideways movement of wake flows toward windward i.e. to the right [12]. Meanwhile, the wake is toward the left when the turbine’s rotation was reversed to clockwise. The effect of the sideways wake direction seems to be just an artifact of the simulation where the first few rotations of the rotor caused a sideward movement of the wake. Further simulations (up to 48 rotations) revealed a more consistent straight wake convected downwind (Fig. 11h). Despite a seemingly underdeveloped wake, the predicted performance of the 10-rotation simulation is not different from the 48-rotation simulation. The first image pair (Figs. 11a and 11b) show larger areas of high local velocity wind within the turbine gaps which could have directly influenced the relatively higher performance of the two cases (Cp greater than 0.31) versus the other simulation pairs. The other cases show very similar contour plots of velocity magnitudes. Upstream of the turbines for all simulations, it is apparent that the incoming wind that is expected to interact with the turbines have magnitudes between 4.67m/s and 5m/s. This is consistent to the observation in the oblique angle study where the observed incoming with velocity is lower than the free stream wind of 5m/s.
IV. SUMMARY AND CONCLUSION
Three turbines arranged in triangular array were simulated at different oblique angles and rotation direction. The performance of the cluster degrades as the second row turbines converge at the back of the upwind turbine. It was also found out that the downwind turbines affect the incoming wind flow velocity to the upwind turbine and consequently its performance. No significant variation to the over-all average power coefficient was observed among the simulated rotational combination at 4 equivalent rotor distances. It was also found out that mirror image pairs of turbine arrangement have almost the same over-all coefficient of performance.
REFERENCES
[1] Islam, M., D.S.K. Ting, Leijon, M., 2008, “Aerodynamic models for darrieus-type straight-bladed vertical axis wind turbine”, Renewable Sustainable Energy Rev., 12:1087-1109
[2] Saad, M., Asmuin, N., 2014, “Comparison of Horizontal Axis Wind Turbines and Vertical Axis Wind Turbines”, IOSR Journal of Engineering
[3] Shaheen, M., Abdallah, S., 2015, “Development of efficient vertical axis wind turbine clustered farms”, Renewable and Sustainable Energy Reviews 63 (2016) 237-244
[4] Hezavah, D., et al, 2016, “Cluster Design for Vertical Axis Wind Turbine Farms”, Princeton University
[5] Sanderse, B., “Aerodynamics of Wind Turbine Wakes: Literature Review”, Energy Research Center of the Netherlands
[6] Bons, N., “Optimization of Vertical Axis Wind Turbine Farm Layout”, American Institute of Aeronautics and Astronautics
[7] Lam, H.F., Peng, H.Y., 2017, “Measurement of wake characteristics of co-and counter-rotating twin H-rotor vertical axis wind turbine”, City University of Hong Kong
[8] Medici, D., Ivanell, S., Dahlberg, J-A, Alfredsson, P.H., 2011, “The upstream flow of a wind turbine: blockage effect”, Wind Energy [9] Iliev, Svetlozar, 2014, “Array Losses and Array Benefits: The
Atmospheric Blockage Effect at Offshore Wind Parks”, Master Thesis, Delft University of Technology
[10] M.O.L. Hansen, 2008, “Aerodynamics of wind turbine, 2nd Ed.”, Earthscan London
[11] Silva, J.E., Danao, L.A.M.D., “VAWT Cluster Parameter Study on Overall Cluster Performance, Part I: Model Development and Rotor Spacing”