The First Multilingual Surface Realisation Shared Task (SR’18):
Overview and Evaluation Results
Simon Mille UPF, Barcelona [email protected]
Anja Belz University of Brighton [email protected]
Bernd Bohnet Google Inc.
Yvette Graham
ADAPT Research Centre, DCU [email protected]
Emily Pitler Google Inc.
Leo Wanner
ICREA and UPF, Barcelona [email protected]
Abstract
We report results from the SR’18 Shared Task, a new multilingual surface realisa-tion task organised as part of the ACL’18 Workshop on Multilingual Surface Reali-sation. As in its English-only predecessor task SR’11, the shared task comprised two tracks with different levels of complexity: (a) a shallow track where the inputs were full UD structures with word order infor-mation removed and tokens lemmatised; and (b) a deep track where additionally, functional words and morphological infor-mation were removed. The shallow track was offered in ten, and the deep track in three languages. Systems were evaluated (a) automatically, using a range of intrin-sic metrics, and (b) by human judges in terms of readability and meaning similar-ity. This report presents the evaluation re-sults, along with descriptions of the SR’18 tracks, data and evaluation methods. For full descriptions of the participating sys-tems, please see the separate system re-ports elsewhere in this volume.
1 Introduction and Task Overview
Natural Language Generation (NLG) is attract-ing growattract-ing interest both in the form of end-to-end tasks (e.g. data-to-text and text-to-text gen-eration), and as embedded component tasks (e.g. in abstractive summarisation, dialogue-based in-teraction and question answering).
NLG research has been given a boost by two recent developments: the rapid spread of neural language generation techniques, and the growing availability of multilingual treebanks annotated with Universal Dependencies1 (UD), to the point
1http://universaldependencies.org/
where as many as 70 treebanks covering about 50 languages can now be downloaded freely.2 UD
treebanks facilitate the development of applica-tions that work potentially across all languages for which UD treebanks are available in a uniform fashion, which is a big advantage for system de-velopers. As has already been seen in parsing, UD treebanks are also a good basis for multilin-gual shared tasks: a method that works for some languages may also work for others.
The SR’18 task is to generate sentences from structures at the level of abstraction of outputs in state-of-the-art parsing, encouraging partici-pants to explore the extent to which neural net-work parsing algorithms can be reversed for gen-eration. SR’18 also addresses questions about just how suitable and useful the notion of univer-sal dependencies—which is in the process of be-coming the dominant linguistic formalism across a wide range of NLP applications, parsing in particular—is for NLG. SR’18 follows the SR’11 pilot surface realisation task for English (Belz et al., 2011) which was part of Generation Chal-lenges 2011 (GenChal’11), the fifth round of shared-task evaluation competitions (STECs) in-volving the language generation tasks.
Outside of the SR tasks, just three ‘deep’ NLG shared tasks focusing on language generation from abstract semantic representations have been organ-ised to date: WebNLG3(Gardent et al., 2017), Se-mEval Task 94 (May and Priyadarshi, 2017), and E2E5(Novikova et al., 2017). What is more, these
2
See the recent parsing shared task based on UDs (Nivre and de Marneffe et al., 2016): http:// universaldependencies.org/conll17/.
3
http://talc1.loria.fr/webnlg/stories/ challenge.html
4
http://alt.qcri.org/semeval2017/ task9/
5http://www.macs.hw.ac.uk/
tasks have only been offered for English.
As in SR’11, the Multilingual Surface Reali-sation shared task (SR’18) comprises two tracks with different levels of difficulty:
Shallow Track: This track starts from genuine UD structures in which word order information has been removed and tokens have been lemma-tised. In other words, it starts from unordered de-pendency trees with lemmatised nodes that hold PoS tags and morphological information as found in the original treebank annotations. The task amounts to determining the word order and inflect-ing words.
Deep Track: This track starts from UD structures from which functional words (in particular, aux-iliaries, functional prepositions and conjunctions) and surface-oriented morphological and syntactic information have been removed. In addition to what is required for the Shallow Track, the task in the Deep Track thus also requires reintroduction of the removed functional words and morphological features.
In the remainder of this paper, we describe the data we used in the two tracks (Section 2), and the eval-uation methods we used to evaluate submitted sys-tems (Sections 3.1 and 3.2). We then briefly in-troduce the participating systems (Section 4), re-port and discuss evaluation results (Section 5), and conclude with some discussion and a look to the future (Section 6).
2 Data
To create the SR’18 training and testing data, we used as data sources ten UD treebanks for which annotations of reasonable qual-ity were available, providing PoS tags and morphologically relevant markup (number, tense, verbal finiteness, etc.): UD Arabic, UD Czech, UD Dutch, UD English, UD Finnish, UD French, UD Italian, UD Portuguese, UD Russian-SynTagRus and UD Spanish-AnCora.6 We created training and test data for all ten languages for the Shallow Track, and for three of the languages, namely English, French and Spanish, for the Deep Track.
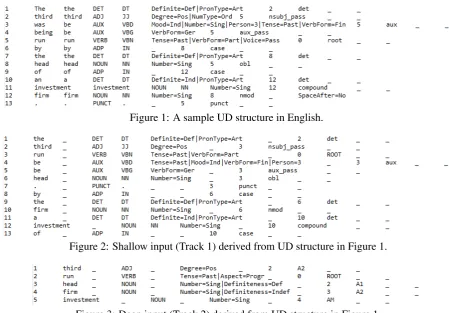
Inputs in both Shallow and Deep Tracks are trees, and are released in CoNLL-U format, with no meta-information.7 Figures 1, 2 and 3 show
6
universaldependencies.org
7http://universaldependencies.org/
a sample original UD annotation for English, and the corresponding shallow and deep input struc-tures derived from it.
To create inputs to the Shallow Track, the UD structures were processed as follows:
1. Word order information was removed by ran-domised scrambling;
2. Words were replaced by their lemmas.
For the Deep Track, the following steps were ad-ditionally carried out:
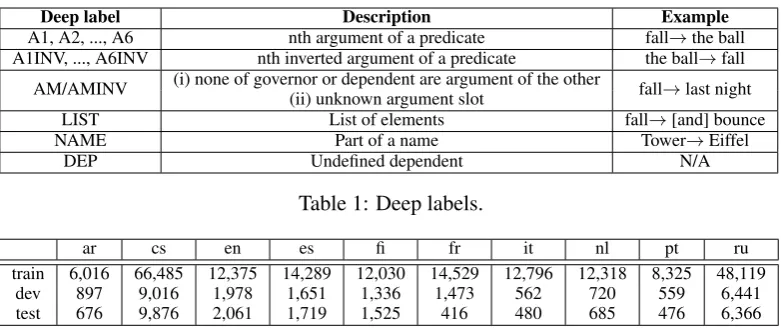
3. Edge labels were generalised into pred-icate/argument labels, in the Prop-Bank/NomBank (Palmer et al., 2005; Meyers et al., 2004) fashion. That is, the syntactic relations were mapped to core (A1, A2, etc.) and non-core (AM) labels, applying the following rules: (i) the first argument is always labeled A1 (i.e. there is no external argument A0); (ii) in order to maintain the tree structure and account for some cases of shared arguments, there can be inverted argument relations; (iii) all modifier edges are assigned the same generic label AM; (iv) there is a coordinating relation; see the inventory of relations in Table 1.
4. Functional prepositions and conjunctions in argument position (i.e. prepositions and con-junctions that can be inferred from other lex-ical units or from the syntactic structure) are removed (e.g.byandof in Figure 2); prepo-sitions and conjunctions retained in the deep representation can be found under a A2INV
dependency; a dependency pathGov AM →
Dep A2INV → Prepis equivalent to a
pred-icate (the conjunction/preposition) with 2 ar-guments:Gov←A1 Prep A2→Dep.
5. Definite and indefinite determiners, auxil-iaries and modals are converted into at-tribute/value pairs, as are definiteness tures, and the universal aspect and mood fea-tures8, see examples in Figure 3.
6. Subject and object relative pronouns directly linked to the main relative verb are removed (and instead, the verb is linked to the an-tecedent of the pronoun); a dummy pronoun
format.html
8http://universaldependencies.org/u/
Figure 1: A sample UD structure in English.
[image:3.595.70.520.58.371.2]Figure 2: Shallow input (Track 1) derived from UD structure in Figure 1.
Figure 3: Deep input (Track 2) derived from UD structure in Figure 1.
node for the subject is added if an originally finite verb has no first argument and no avail-able argument to build a passive; for a pro-drop language such as Spanish, a dummy pronoun is added if the first argument is miss-ing.
7. Surface-level morphologically relevant infor-mation as prescribed by syntactic structure or agreement (such as verbal finiteness or verbal number) is removed, whereas semantic-level information such as nominal number and ver-bal tense is retained.
8. Fine-grained PoS labels found in some tree-banks (see e.g. column 5 in Figure 2) are moved, and only coarse-grained ones are re-tained (column 4 in Figures 2 and 3).
Shallow Track inputs were generated with the aid of a simple Python script from the original UD structures. During the conversion, we filtered out sentences that contained dependencies that only make sense in an analysis context (e.g.
reparan-dum, ororphan). This amounted to around 1.5%
of sentences for the different languages on av-erage; see Table 2 for an overview of the final sizes of the datasets. Deep Track inputs were
then generated by automatically processing the Shallow Track structures using a series of graph-transduction grammars that cover steps 3–8 above (in a similar fashion as Mille et al. (2017)). There is a node-to-node correspondence between the deep and shallow input structures.
Deep label Description Example A1, A2, ..., A6 nth argument of a predicate fall→the ball A1INV, ..., A6INV nth inverted argument of a predicate the ball→fall AM/AMINV (i) none of governor or dependent are argument of the other fall→last night
(ii) unknown argument slot
LIST List of elements fall→[and] bounce NAME Part of a name Tower→Eiffel
[image:4.595.103.494.59.224.2]DEP Undefined dependent N/A
Table 1: Deep labels.
ar cs en es fi fr it nl pt ru
train 6,016 66,485 12,375 14,289 12,030 14,529 12,796 12,318 8,325 48,119 dev 897 9,016 1,978 1,651 1,336 1,473 562 720 559 6,441 test 676 9,876 2,061 1,719 1,525 416 480 685 476 6,366
Table 2: SR’18 dataset sizes for training, development and test sets.
3 Evaluation Methods
3.1 Automatic methods
We used BLEU, NIST, and inverse normalised character-based string-edit distance (referred to as DIST, for short, below) to assess submitted sys-tems. BLEU (Papineni et al., 2002) is a precision metric that computes the geometric mean of the n-gram precisions between generated text and ref-erence texts and adds a brevity penalty for shorter sentences. We use the smoothed version and re-port results forn= 4.
NIST9 is a related n-gram similarity metric weighted in favour of less frequent n-grams which are taken to be more informative.
Inverse, normalised, character-based string-edit distance (DIST in the tables below) starts by com-puting the minimum number of character inserts, deletes and substitutions (all at cost 1) required to turn the system output into the (single) refer-ence text. The resulting number is then divided by the number of characters in the reference text, and finally subtracted from 1, in order to align with the other metrics. Spaces and punctuation marks count as characters; output texts were otherwise normalised as for all metrics (see below).
The figures in the tables below are the system-level scores for BLEU and NIST, and the mean sentence-level scores for DIST.
Text normalisation: Output texts were nor-malised prior to computing metrics by lower-casing all tokens, removing any extraneous whitespace characters.
9 http://www.itl.nist.gov/iad/mig/tests/mt/doc/ngram-study.pdf; http://www.itl.nist.gov/iad/mig/tests/mt/2009/
Missing outputs: Missing outputs were scored 0. Since coverage was 100% for all systems ex-cept one, we only report results for all sentences (incorporating the missing-output penalty), rather than also separately reporting scores for just the in-coverage items.
3.2 Human-assessed methods
We assessed two quality criteria in the human eval-uations, in separate evaluation experiments:
Read-abilityandMeaning Similarity. As in SR’11 (Belz
et al., 2011), we used continuous sliders as rating tools, because raters tend to prefer them (Belz and Kow, 2011). Slider positions were mapped to val-ues from 0 to 100 (best). Raters were first given brief instructions, including instructions to ignore formatting errors, superfluous whitespace, capital-isation issues, and poor hyphenation. The part of the instructions used only in the Readability as-sessment experiments was:
“The quality criterion you need to assess is Readability. This is sometimes called fluency, and your task is to decide how well the given text reads; is it good flu-ent English, or does it have grammatical errors, awkward constructions, etc.
Please rate the text by moving the slider to the position that corresponds to your rating, where 0 is the worst, and 100 is the best rating.”
The corresponding instructions for Meaning Sim-ilarity assessment, in which system outputs were compared to reference sentences, were as follows:
both texts, and then decide how close in meaning the second text (in black) is to the first (in grey).
Please use the slider at the bottom of the page to express your rating. The closer in meaning the second text clipping is to the first, the further to the right (towards 100) you need to place the slider.
In other words, a rating of 100% would mean that the meaning of the two text clippings is exactly identical.”
Slider design: In SR’11, a slider design was used, which had a smiley face at the 100 end and a frowning face at the 0 end, with the pointer starting out at 50. For conformity with what has emerged as a new affordable human evaluation standard over the past two years in the main ma-chine translation shared tasks held at WMT (Bojar et al., 2017a), we changed this design to look as follows, with the pointer starting at 0:
Test data sets for human evaluations: Test set sizes out of the box varied considerably for the different languages. For the human test sets we selected either the entire set or a subset of 1,000, whichever was the smaller number, for a given lan-guage. For subsets, test set items were selected randomly but ensuring a similar sentence length distribution as in the whole set.
Reported scores: Again in keeping with the WMT approach, we report both average raw scores and average standardised scores per system. In order to produce standardised scores we sim-ply map each individual evaluator’s scores to their standard scores (or z-scores) computed on the set of all raw scores by the given evaluator using each evaluator’s mean and standard deviation. For both raw and standard scores, we compute the mean of sentence-level scores.
3.2.1 Mechanical Turk evaluations
For three of the languages in the shallow track (English, Spanish and French), we replicated the human evaluation method from WMT’17, known as Direct Assessment (DA) (Graham et al., 2016), exactly, except that we also ran (separate) experi-ments to assess the Readability criterion, using the same method.
Quality assurance: System outputs are ran-domly assigned to HITs (following Mechanical Turk terminology) of 100 outputs, of which 20 are used solely for quality assurance (QA) (i.e. do not count towards system scores): (i) some are re-peated as are, (ii) some are rere-peated in a ‘dam-aged’ version and (iii) some are replaced by their corresponding reference texts. In each case, a min-imum threshold has to be reached for the HIT to be accepted: for (i), scores must be similar enough, for (ii) the score for the damaged version must be worse, and for (iii) the score for the reference text must be high. For full details of how these ad-ditional texts are created and thresholds applied, please refer to Bojar et al. (2017a). Below we re-port QA figures for the MTurk evaluations (Sec-tion 3.2.1).
Code: We were able to reuse, with minor adap-tations, the code produced for the WMT’17 evalu-ations.10
3.2.2 Google Data Compute Evaluation
In order to cover more languages, and to en-able comparison between crowdsourced and ex-pert evaluation, we also conducted human evalua-tions using Google’s internal ‘Data Compute’ sys-tem evaluation service, where experienced evalua-tors carefully assess each system output. We used an interface that matches the WMT’17 interface above, as closely as was possible within the con-straints of the Data Compute platform.
Everything stated at the beginning of Sec-tion 3.2 also holds for the expert annotator eval-uations with Google Data Compute.
Quality assurance: Because in the Google Data Compute version of the evaluation experiment we were using expert evaluators from a pool of work-ers routinely employed to perform such tasks, we did not replicate the WMT’17 QA techniques pre-cisely, opting for a simpler test of self-consistency, or intra-evaluator agreement (IEA) instead. Test set items were randomly grouped into sets of 100 (which we are also calling HITs here for unifor-mity) and order was again randomised before pre-sentation to evaluators. Each evaluator did at least one HIT. Each HIT contained 5 items which were duplicated to test for IEA which we computed as the average Pearson correlation coefficient per HIT. The average IEA for English was 0.75 on the
raw scores for Meaning Similarity, and 0.66 for Readability.
4 Overview of Submitted Systems
Eight different teams (out of twenty-one regis-tered) submitted outputs to SR’18: the ADAPT Centre (ADAPT, Ireland), AX Semantics (AX, Germany), IIT-BHU Varanasi (IIT-BHU, India), Ohio State University (OSU, USA), University of S˜ao Paulo (NILC, Brazil), Tilburg University (Tilburg, The Netherlands), Universit`a degli Studi di Torino (DipInfo-UniTo, Italy), and Technische Universit¨at Darmstadt (BinLin, Germany).
All teams submitted outputs for at least the En-glish Shallow Track; one team participated in the Deep Track (ADAPT, English), and three teams submitted outputs for all ten languages of the Shal-low Track (AX, OSU, and BinLin). Most submit-ted systems are based on neural components, and break down the surface realisation task into two subtasks: linearisation, and word inflection. De-tails of each approach are provided in the teams’ reports elsewhere in this volume; here, we briefly summarise each approach:
ADAPT uses linearised parse tree inputs to train a sequence-to-sequence LSTM model with copy attention, augmenting the training set with additional synthetic data.
AXis trained on word pairs for ordering and is combined with a rule-based morphology compo-nent.
IIT-BHU uses an LSTM-based encoder-decoder model for word re-inflection, and a Language Model-based approach for word reordering.
OSUfirst generates inflected wordforms with a neural sequence-to-sequence model, and then in-crementally linearises them using a global linear model over features that take into account the de-pendency structure and dede-pendency location.11
NILC is a neural-based system that uses a bottom-up approach to build the sentence using the dependency relations together with a language model, and language-specific lexicons to produce the word forms of each lemma in the sentence.
Tilburg works by first preprocessing an input dependency tree into an ordered linearised string,
11Some of OSU’s outputs were submitted after the start of the human evaluations and are not included in this report; out-puts submitted late, but before the human evaluation started, are included and marked with asterisks in the results tables.
which is then realised using a statistical machine translation model.
DipInfo-UniTo employs two separate neural networks with different architectures to predict the word ordering and the morphological inflection in-dependently; outputs are combined to produce the final sentence.
BinLinuses one neural module as a binary clas-sifier in a sequential process of ordering token lemmas, and another for character-level morphol-ogy generation where the words are inflected to finish the surface realisation.
5 Evaluation results
5.1 Results from metric evaluations
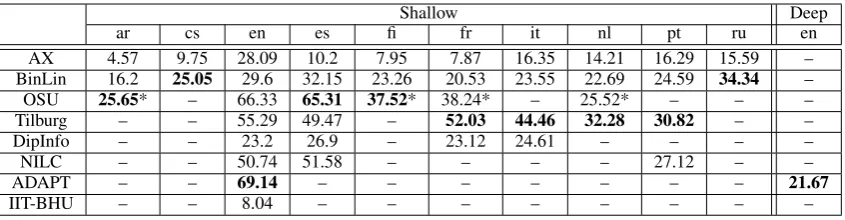
Tables 3–5 show BLEU-4, NIST, and DIST results for both the Shallow and Deep tracks, for all sub-mitted systems; results are listed in order of num-ber of languages submitted for. Best results for each language are shown in boldface.
In terms of BLEU-4, in the Shallow Track, Tilburg obtained the best scores for four lan-guages (French, Italian, Dutch, Portuguese), OSU for three (Arabic, Spanish, Finnish), BinLin for two (Czech, Russian), and ADAPT for one (En-glish). The highest BLEU-4 scores across lan-guages were obtained on the English and Spanish datasets, with BLEU-4 scores of 69.14 (ADAPT) and 65.31 (OSU) respectively.
Results are identical for DIST, except that AX, rather than BinLin, has the highest score for Czech. The picture for NIST is also very similar to that for BLEU-4, except that ADAPT and OSU are tied for best NIST score for English, and Bin-Lin (rather than Tilburg) has the best NIST score for Dutch.
In the Deep Track, only ADAPT submitted sys-tem outputs (English), and as expected, the scores are much lower than for the Shallow Track, across all metrics.
5.2 Results from human evaluations
Shallow Deep ar cs en es fi fr it nl pt ru en AX 4.57 9.75 28.09 10.2 7.95 7.87 16.35 14.21 16.29 15.59 – BinLin 16.2 25.05 29.6 32.15 23.26 20.53 23.55 22.69 24.59 34.34 – OSU 25.65* – 66.33 65.31 37.52* 38.24* – 25.52* – – – Tilburg – – 55.29 49.47 – 52.03 44.46 32.28 30.82 – – DipInfo – – 23.2 26.9 – 23.12 24.61 – – – – NILC – – 50.74 51.58 – – – – 27.12 – –
ADAPT – – 69.14 – – – – – – – 21.67
[image:7.595.88.511.61.171.2]IIT-BHU – – 8.04 – – – – – – – –
Table 3: BLEU-4 scores for the test data. Bold = best score per language. * = late submission.
Shallow Deep
ar cs en es fi fr it nl pt ru en AX 5.13 9.33 9.51 8.26 6.84 6.45 6.83 7.81 6.78 9.93 – BinLin 6.94 10.74 9.58 10.21 9.36 7.21 7.6 8.64 7.54 13.06 – OSU 7.15* – 12.02 12.74 9.56* 8.00* – 7.33* – – – Tilburg – – 10.86 11.12 – 9.85 9.11 8.05 7.55 – – DipInfo – – 8.86 9.58 – 7.72 8.25 – – – – NILC – – 10.62 11.17 – – – – 7.56 – – ADAPT – – 12.02 – – – – – – – 6.95
[image:7.595.88.508.341.448.2]IIT-BHU – – 7.71 – – – – – – – –
Table 4: NIST scores for the test data. Bold = best score per language. * = late submission.
Shallow Deep
ar cs en es fi fr it nl pt ru en AX 38.96 36.48 70.01 21.12 35.59 22.3 40.96 49.65 51.7 34.28 – BinLin 44.37 35.7 65.9 36.95 41.21 28.6 40.74 48.23 51.36 34.56 – OSU 46.49* – 70.22 61.46 58.7* 53.69* – 57.77* – – – Tilburg – – 79.29 51.73 – 55.54 58.61 57.81 60.7 – – DipInfo – – 51.87 24.53 – 18.04 36.11 – – – – NILC – – 77.56 53.78 – – – – 57.43 – –
ADAPT – – 80.42 – – – – – – – 48.69
IIT-BHU – – 47.63 – – – – – – – –
Table 5: DIST scores for the test data. Bold = best score per language. * = late submission.
well as for English in order to enable us to com-pare results obtained with the two different meth-ods. However, most of the latter evaluations are still ongoing and will be reported separately in a future paper. Below, we report Google Data Compute results and comparisons with Mechan-ical Turk results, for English only.
5.2.1 Mechanical Turk results
Tables 6, 7 and 8 show the results of the hu-man evaluation carried out via Mechanical Turk with Direct Assessment (MTurk DA), for English, French and Spanish, respectively. See Section 3.2 for details of the evaluation method. ‘DA’ refers to the specific way in which scores are collected in the WMT approach which differs from what we did for SR’11, and here in the Google Data Com-pute experiments.
English: Average Meaning Similarity DA scores for English systems range from 86.9% to
67% with OSU achieving the highest overall score in terms of both average raw DA scores and corre-sponding z-scores. Readability scores for the same set of systems range from 78.7% to 41.3%, reveal-ing that MTurk workers rate the Meanreveal-ing Simi-larity between generated texts and corresponding reference sentences higher in general than Read-ability. In order to investigate how Readability of system outputs compare to human-produced text, we included the original test sentences as a system in the Readability evaluation (for Meaning Simi-larity the notional score is 100%). Unsurprisingly, human text achieves the highest score in terms of Readability (78.7%) but is quite closely followed by the best performing system in terms of Read-ability, ADAPT (73.9%).
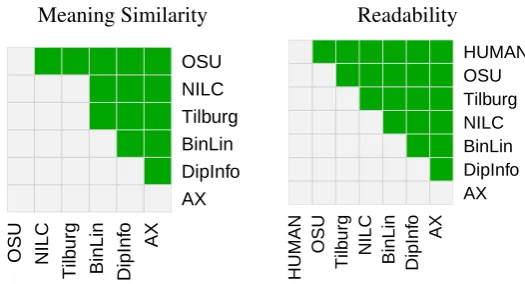
Figure 4 shows significance test results for each pair of systems participating in the English evalu-ation in the form of heatmaps where a green cell denotes a significantly higher average score for the system in that row over the system in that column, with a darker shade of green denoting a conclusion drawn with more certainty. Results show that two entries are tied for first place in terms of Meaning Similarity, OSU and ADAPT, with the small dif-ference in average scores proving not statistically significant. In terms of Readability, however, the ADAPT sentences achieve a significantly higher readability score compared to OSU.
French: Table 7 shows average DA scores for systems participating in the French Shallow Track. Meaning Similarity scores for French sys-tems range from 72.9% to 48.6% with the Tilburg system achieving the highest overall score. In terms of Readability, again Tilburg achieves the highest average score of 65.4%, with a consider-able gap to the next best entry, OSU. Compared to the human results, there is a larger gap than we saw for English outputs.
Figure 5 shows results of tests for statistical sig-nificance between average DA scores for systems in the French Shallow Track. Tilburg achieves a significantly higher average DA score compared to all other systems in terms of both Meaning Sim-ilarity and Readability. All systems are signifi-cantly worse in terms of Readability than the hu-man authored texts.
Spanish: Table 8 shows average DA scores for systems participating in the Shallow Track for Spanish. Meaning Similarity scores range from 77.3% to 43.9%, with OSU achieving the highest score. In terms of Readability, the text produced by the systems ranges from 77.0% to 33.0%, and again OSU achieves the highest score. Figure 6 shows results of the corresponding significance tests: OSU significantly outperforms all other par-ticipating systems with respect to both evaluation criteria. Human-generated texts are significantly more readable than all system outputs.
MTurk DA quality control: Only 31% of workers passed quality control (being able to repli-cate scores for same sentences and scoring dam-aged sentences lower, for full details see Bojar et al., 2017a), highlighting the danger of crowd-sourcing without good quality control measures. The remaining 69%, who did not meet this cri-terion, were omitted from computation of the
of-ficial DA results above. Of those 31% included in the evaluation, a very high proportion, 97%, showed no significant difference in scores col-lected in repeated assessment of the same sen-tences; these high levels of agreement are consis-tent with what we have seen in DA used for Ma-chine Translation (Graham et al., 2016) and Video Captioning evaluation (Graham et al., 2017).
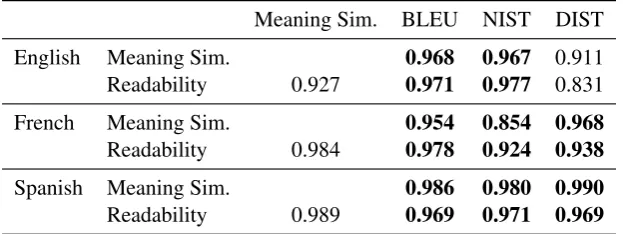
Agreement with automatic metrics: Table 9 shows Pearson correlations between MTurk DA scores and automatic metric scores in the En-glish, French and Spanish shallow tracks. Over-all, BLEU agrees most consistently across the dif-ferent tasks, achieving a correlation above 0.95 in all settings, whereas the correlation of NIST scores with human Meaning Similarity scores is just 0.854 for French, while DIST scores corre-late with human Readability scores at just 0.831 for English.
Conclusions from metric correlations should be drawn with a degree of caution, since in all cases the sample size from which we compute correla-tions is small, 8 systems for English, 5 for French, and 6 for Spanish. We carried out significance tests to investigate to what degree differences in correlations are likely to occur by chance. In order to take into account the fact that we are compar-ing correlations between human assessment and competing pairs of metrics (where metric scores themselves correlate with each other), we apply a Williams test for significance of differences in
de-pendentcorrelations, as done in evaluation of
Ma-chine Translation metrics (Graham and Baldwin, 2014; Bojar et al., 2017b).
Results are shown in Table 9. Correlations be-tween metrics and human assessment in bold are
notsignificantly lower than any other metric. As can be seen from Table 9, there is no signifi-cant difference between any of the three metrics in terms of correlation with human assessment in both the French and Spanish tracks. In the En-glish track, however, the correlation of BLEU and NIST scores with human assessment are signifi-cantly higher than that of DIST.
5.2.2 Google Data Compute results
Table 10 shows the results for the English as-sessment conducted via the Google Data Compute (GDC) evaluation service with expert evaluators.
Meaning Similarity
% z n Assess. System
86.9 0.369 1,249 1,422 OSU 85.5 0.314 1,238 1,429 ADAPT 84.8 0.291 1,294 1,498 Tilburg 84.2 0.280 1,229 1,407 NILC 77.5 0.043 1,256 1,442 AX 75.8 0 1,264 1,462 BinLin 72.6 −0.120 1,244 1,427 DipInfo 67.0 −0.312 1,257 1,412 IIT-BHU
Readability
% z n Assess. System
[image:9.595.84.517.64.225.2]78.7 0.797 831 1,350 HUMAN 73.9 0.638 1,065 1,301 ADAPT 71.2 0.558 1,117 1,374 OSU 62.1 0.258 1,109 1,377 Tilburg 58.1 0.166 1,086 1,342 NILC 52.5 −0.019 1,080 1,343 AX 50.1 −0.102 1,076 1,336 BinLin 42.7 −0.345 1,091 1,355 DipInfo 41.3 −0.376 1,081 1,296 IIT-BHU
Table 6: MTurk DA human evaluation results for English Shallow Track; % = average DA score (0-100); z= z-score;n= number of distinct sentences assessed; Assess. = total number of sentences assessed.
Meaning Similarity
% z n Assess. System
72.9 0.365 416 1,651 Tilburg 69.1 0.237 416 1,570 OSU 58.9 −0.133 416 1,575 BinLin 52.8 −0.32 416 1,648 DipInfo 48.6 −0.444 416 1,592 AX
Readability
% z n Assess. System
89.9 1.525 218 650 HUMAN
[image:9.595.98.505.269.388.2]65.4 0.607 416 1060 Tilburg 54.7 0.179 416 1007 OSU 41.5 −0.26 416 1031 BinLin 38.7 −0.456 416 1094 DipInfo 32.9 −0.659 416 1033 AX
Table 7: MTurk DA human evaluation results for French Shallow Track; % = average DA score (0-100); z= z-score;n= number of distinct sentences assessed; Assess. = total number of sentences assessed.
Meaning Similarity
% z n Assess. System
77.3 0.519 1,255 1,502 OSU 66.8 0.175 1,231 1,439 NILC 65.7 0.136 1,190 1,401 Tilburg 54.9 −0.214 1,202 1,395 BinLin 48.4 −0.445 1,190 1,401 DipInfo 43.9 −0.583 1,225 1,449 AX
Readability
DA z n Assess. System
89.6 1.120 889 1,237 HUMAN 77.0 0.731 1,399 1,691 OSU 63.1 0.265 1,371 1,645 Tilburg 57.2 0.093 1,384 1,631 NILC 45.1 −0.299 1,367 1,625 BinLin 36.9 −0.558 1,370 1,629 DipInfo 33.0 −0.700 1,371 1,657 AX
Table 8: MTurk DA human evaluation results for Spanish Shallow Track; % = average DA score (0-100); z= z-score;n= number of distinct sentences assessed; Assess. = total number of sentences assessed.
Meaning Sim. BLEU NIST DIST
English Meaning Sim. 0.968 0.967 0.911 Readability 0.927 0.971 0.977 0.831
French Meaning Sim. 0.954 0.854 0.968
Readability 0.984 0.978 0.924 0.938
Spanish Meaning Sim. 0.986 0.980 0.990
Readability 0.989 0.969 0.971 0.969
[image:9.595.84.516.431.566.2] [image:9.595.144.456.610.727.2]Meaning Similarity Readability
OSU
AD
APT
Tilb
urg
NILC AX BinLin DipInf
o
IIT
.BHU
IIT−BHU DipInfo BinLin AX NILC Tilburg ADAPT OSU
HUMAN AD APT OSU
Tilb
urg
NILC AX BinLin
DipInf
o
IIT
.BHU
[image:10.595.154.448.62.212.2]IIT−BHU DipInfo BinLin AX NILC Tilburg OSU ADAPT HUMAN
Figure 4: MTurk DA human evaluation significance test results for the English shallow track.
Meaning Similarity Readability
Tilb
urg
OSU
BinLin DipInf
o
AX
AX DipInfo BinLin OSU Tilburg
HUMAN Tilb
urg
OSU
BinLin DipInf
o
AX
[image:10.595.172.425.248.382.2]AX DipInfo BinLin OSU Tilburg HUMAN
Figure 5: MTurk DA human evaluation significance test results for the French shallow track.
Meaning Similarity Readability
OSU NILC
Tilb
urg
BinLin DipInf
o
AX
AX DipInfo BinLin Tilburg NILC OSU
HUMAN
OSU
Tilb
urg
NILC
BinLin DipInf
o
AX
AX DipInfo BinLin NILC Tilburg OSU HUMAN
Figure 6: MTurk DA human evaluation significance test results for the Spanish shallow track.
Meaning Similarity range from 67 to 86.9 for MTurk, compared to 52 to 86.1 for GDC. The lat-ter is a wider range of scores, and expert eval-uators’ scores distinguish between systems more clearly than the crowdsourced scores which place the top four systems very close together.
Readability scores range from 41.3 to 78.7 for MTurk, and from 60.2 to 88.2 for GDC. The ex-pert evaluators tended to assign higher scores over-all, but their range and the way they distinguish between systems is similar. For example, neither evaluation found much difference for the bottom
two systems.
The rank order of systems in the two separate evaluations is identical. Table 11 shows the Pear-son correlation of scores for systems in the evalu-ations, where meaning similarity scores correlate almost perfectly at 0.997 (raw %) and 0.993 (z) and readability at 0.986 (raw %) and 0.985 (z).
6 Conclusion
[image:10.595.165.428.416.558.2]Meaning Similarity
% z n System
86.1 0.479 1000 OSU 83.8 0.394 1000 ADAPT 81.8 0.308 1000 Tilburg 78.8 0.219 1000 NILC 68.7 -0.109 1000 AX 65.4 -0.238 1000 BinLin 59.7 -0.414 1000 DipInfo 52.0 -0.640 1000 IIT-BHU
Readability
% z n System
[image:11.595.138.466.62.211.2]88.2 0.530 1000 ADAPT 86.1 0.459 1000 OSU 81.0 0.276 1000 Tilburg 78.0 0.156 1000 NILC 67.7 -0.194 1000 AX 65.9 -0.299 1000 BinLin 60.7 -0.449 1000 DipInfo 60.2 -0.480 1000 IIT-BHU
Table 10: Google Data Compute human evaluation results for the English shallow track, where % = average score (0-100) for generated sentences;ndistinct sentences assessed per system.
Meaning Similarity Readability
% 0.997 0.986
z 0.993 0.985
Table 11: Pearson correlation between human evaluations carried out using MTurk DA and Google Data Compute.
of a shared task, at least in the Shallow Track, in-dicating that interest is high enough to continue running it again next year to enable more teams to participate.
One important question that needs to be ad-dressed is to what extent UDs are suitable inputs for NLG systems. More specifically, can they reasonably be expected to be generated by other, content-determining, modules in an NLG system, do they provide all the information necessary to generate surface realisations, and if not, how can they be augmented to provide it.
We hope to discuss these and related issues with the research community as we prepare the next in-stance of the SR Task. A goal to aim for may be to make it possible for different NLG components to be connected via standard interface represen-tations, to increase re-usability for NLG compo-nents. However, what may constitute a good inter-face representation for surinter-face realisation remains far from clear.
Acknowledgments
The work reported in this paper has been partly supported by Science Foundation Ireland (sfi.ie) under the SFI Research Centres Pro-gramme co-funded under the European Regional
Development Fund, grant number 13/RC/2106 (ADAPT Centre for Digital Content Technology, www.adaptcentre.ie) at Dublin City University, and by the European Commission in the frame-work of the H2020 Programme under the contract numbers 779962-RIA, 700475-IA, 7000024-RIA, and 645012RIA.
References
Anja Belz and Eric Kow. 2011. Discrete vs. contin-uous rating scales for language evaluation in NLP. In Proceedings of the 49th Annual Meeting of the Association for Computational Linguistics (ACL-HLT’11).
Anja Belz, Michael White, Dominic Espinosa, Eric Kow, Deirdre Hogan, and Amanda Stent. 2011. The first surface realisation shared task: Overview and evaluation results. In Proceedings of the 13th Eu-ropean Workshop on Natural Language Generation, ENLG ’11, pages 217–226, Stroudsburg, PA, USA. Association for Computational Linguistics.
Ondˇrej Bojar, Rajen Chatterjee, Christian Federmann, Yvette Graham, Barry Haddow, Shujian Huang, Matthias Huck, Philipp Koehn, Qun Liu, Varvara Logacheva, Christof Monz, Matteo Negri, Matt Post, Raphael Rubino, Lucia Specia, and Marco Turchi. 2017a. Findings of the 2017 conference on machine translation (WMT’17). In Proceed-ings of the Second Conference on Machine Trans-lation, Volume 2: Shared Task Papers, pages 169– 214, Copenhagen, Denmark. Association for Com-putational Linguistics.
Claire Gardent, Anastasia Shimorina, Shashi Narayan, and Laura Perez-Beltrachini. 2017. Creating train-ing corpora for micro-planners. InProceedings of the 55th Annual Meeting of the Association for Com-putational Linguistics (Volume 1: Long Papers), Vancouver, Canada. Association for Computational Linguistics.
Yvette Graham, George Awad, and Alan Smeaton. 2017. Evaluation of Automatic Video Captioning Using Direct Assessment. ArXiv e-prints.
Yvette Graham and Timothy Baldwin. 2014. Testing for significance of increased correlation with human judgment. InProceedings of the 2014 Conference on Empirical Methods in Natural Language Pro-cessing (EMNLP), pages 172–176, Doha, Qatar. As-sociation for Computational Linguistics.
Yvette Graham, Timothy Baldwin, Alistair Moffat, and Justin Zobel. 2016. Can machine translation sys-tems be evaluated by the crowd alone. Natural Lan-guage Engineering, FirstView:1–28.
Jonathan May and Jay Priyadarshi. 2017. Semeval-2017 task 9: Abstract meaning representation parsing and generation. In Proceedings of the 11th International Workshop on Semantic Evalua-tion (SemEval-2017), pages 534–543, Vancouver, Canada. Association for Computational Linguistics.
Adam Meyers, R. Reeves, C. Macleod, R. Szekely, V. Zielinska, B. Young, and R. Grishman. 2004. The NomBank project: An interim report. In HLT-NAACL 2004 Workshop: Frontiers in Corpus Anno-tation, Boston, MA, May 2004, pages 24–31.
Simon Mille, Roberto Carlini, Ivan Latorre, and Leo Wanner. 2017. Upf at epe 2017: Transduction-based deep analysis. In Shared Task on Extrinsic Parser Evaluation (EPE 2017), pages 80–88, Pisa, Italy.
Joakim Nivre and Marie-Catherine de Marneffe et al. 2016. Universal dependencies v1: A multilingual treebank collection. In Proceedings of LREC, Por-toroˇz, Slovenia.
Jekaterina Novikova, Ondrej Duˇsek, and Verena Rieser. 2017. The E2E dataset: New challenges for end-to-end generation. In Proceedings of the 18th Annual Meeting of the Special Interest Group on Discourse and Dialogue, Saarbr¨ucken, Germany. ArXiv:1706.09254.
Martha Palmer, Daniel Gildea, and Paul Kingsbury. 2005. The proposition bank: An annotated cor-pus of semantic roles. Computational Linguistics, 31(1):71–105.