of Chimeric Enzymes Assembled by Structure-Guided
SCHEMA Recombination
Thesis by Martina N. Carbone
In Partial Fulfillment of the Requirements for the Degree of Doctor of Philosophy
California Institute of Technology Pasadena, California
2010
© 2010
Martina Nini Carbone
Acknowledgments
I would like to begin by thanking my advisor, Dr. Frances Arnold, for encouraging me to pursue my ideas, for her guidance, and for her support.
Throughout my graduate career I received much help from graduate students and postdoctoral fellows in my laboratory. They laid the foundations of much of the work presented in my thesis and none of it would have been possible without their help and advice. I would like to thank Marco Landwehr, Yougen Li, and Chris Otey for my early work with the P450 enzymes (presented in the first chapter of this thesis). This work would not have been possible without Chris Otey who constructed the SCHEMA library of P450s, Yougen Li who reconstituted the monooxygenase P450s from their heme and reducatse domains, and Marco Landwehr who purified the constructs and performed all of the activity assays with me. Midway through my graduate career I began working on a theoretical project on protein evolution (presented in the second chapter of this thesis). I would like to thank Jesse Bloom and Phil Romero for providing me with lattice protein Python scripts to test my ideas. Late in my Ph.D. experience I resumed experimental work to test the theoretical ideas I had developed. This time I worked with cellulases for which I must thank Pete Heinzelman who assembled the SCHEMA cellulase library and provided me with all the genes I needed for my experiments. I would like to give special thanks to Indira Wu who, when I first started the project, guided me through much of the experimental protocols she developed for expressing, screening, and purifying cellulases. I must also address another special thanks to Sabine Bastian who taught me everything I know about manipulating DNA and molecular biology techniques in general.
their interest and advice. I must also thank Chris Snow, who helped me translate a script I had written in Matlab to the much faster Python.
Indira Wu, Phil Romero, and Sabine Bastian have kindly accepted and even offered to review my dissertation and provide comments. I would like to thank them for their generosity and valuable insight.
I would also like to thank the remaining members of my committee, Dr. David Tirrell and Dr. Mark Davis for agreeing to be on my committee and attending to all the responsibilities of this assignment.
Abstract
In nature proteins evolve by a combination of point mutagenesis and recombination. This process has generated hundreds of fascinating and structurally complex protein folds capable of performing a myriad of important and diverse biochemical functions. This has inspired protein engineers to mimic natural protein evolution in the library to construct synthetic proteins with new or improved properties. Here I show that homologous protein recombination can be used in the library to engineer novel enzymes with new catalytic activities and altered substrate specificities. I also propose that homologous
Table of Contents
Introduction____________________________________________________________ 1 1 Diversification of Catalytic Function in a Synthetic Family of Cytochrome P450s_ 7
1.1 Abstract ____________________________________________________________ 7 1.2 Introduction ________________________________________________________ 7 1.3 Results _____________________________________________________________ 9 1.3.1 Cloning and Expression of P450 Heme Domains and Holoenzymes __________________ 9 1.3.2 Activity Assays __________________________________________________________ 10 1.3.3 Activities of Parent Enzymes _______________________________________________ 13 1.3.4 Activities of Chimeras and Identification of Chimera Clusters _____________________ 14 1.3.5 Peroxygenase Versus Monooxygenase Activities _______________________________ 18 1.3.6 Identification of Substrate Groups ___________________________________________ 18 1.4 Discussion _________________________________________________________ 19
1.4.1 SCHEMA Recombination Creates a Family of Functionally Diverse Enzymes ________ 19 1.4.2 Chimeras Can be Clustered by Substrate Specificity _____________________________ 20 1.4.3 Substrates Fall into Groups that Correlate with Chimera Clusters ___________________ 20 1.4.4 Swapping Reductase Domains Consistently Yields Active Monooxygenases and Conserves Key P450-Reductase FMN Domain Interactions _______________________________________ 22 1.5 Conclusions ________________________________________________________ 24 1.6 Experimental Methods _______________________________________________ 25 1.6.1 Nomenclature and Construction of Holoenzymes from Chimeric Heme Domains ______ 25 1.6.2 Protein Expression and Purification __________________________________________ 25 1.6.3 Functional Assays ________________________________________________________ 26 1.6.4 Data Analysis ___________________________________________________________ 26 1.6.5 Cluster Analysis _________________________________________________________ 27 1.7 Acknowledgments___________________________________________________ 27 1.8 Supplementary Material _____________________________________________ 29
2 Evolvability of Evolutionarily Young Enzymes____________________________ 36
2.1 Abstract ___________________________________________________________ 36 2.2 Introduction _______________________________________________________ 36 2.3 Methods ___________________________________________________________ 41 2.3.1 Lattice Proteins __________________________________________________________ 41 2.3.2 Evolutionary Simulations __________________________________________________ 46 2.3.3 Creation of Chimeric Lattice Proteins ________________________________________ 46 2.4 Results ____________________________________________________________ 47
2.5 Discussion _________________________________________________________ 59 2.6 Acknowledgments___________________________________________________ 62 2.7 Supplementary Material _____________________________________________ 63
3 Evolvability of an Evolutionarily young Chimeric Cellobiohydrolase II Derived from Trichoderma reesei, Humicola insolens, and Chaetomium thermophilum __________ 67
3.1 Abstract ___________________________________________________________ 67 3.2 Introduction _______________________________________________________ 67 3.3 Results ____________________________________________________________ 74 3.3.1 Selection of Chimeras_____________________________________________________ 74 3.3.2 Characterization of the mutational neighborhood of the selected chimeras using random mutagenesis. ___________________________________________________________________ 78 3.3.3 Recombination of the mutations in the best five mutants. _________________________ 84 3.4 Discussion _________________________________________________________ 90
3.4.1 Beneficial Mutations within the Reach of the Chimeras from the SCHEMA Cel6A Library are too Rare to be Found __________________________________________________________ 91 3.4.2 Fitness Peaks Taller than the Native Peak are Rare in Sequence Space _______________ 95 3.4.3 Limitations of the High-Throughput Avicel Screen ______________________________ 96 3.5 Experimental Procedures_____________________________________________ 97
3.5.1 Chimeras Construction and Generation of Random Mutagenesis Libraries Using Error-Prone PCR ______________________________________________________________________ 97 3.5.2 Recombination of Best Mutants _____________________________________________ 98 3.5.3 Addition of HIS6 Tags to Best Mutants from the Recombination Library _____________ 99
3.5.4 Protein Expression _______________________________________________________100 3.5.5 Protein Purification _______________________________________________________101 3.5.6 High-throughput Avicel Activity Assays ______________________________________102 3.5.7 Measurement of Avicel Specific Activity______________________________________103 3.5.8 Determination of Initial Rate of Reaction on Avicel _____________________________103 3.5.9 Stability Measurements____________________________________________________104 3.6 Acknowledgments__________________________________________________ 105 3.7 Supplementary Material ____________________________________________ 106
Introduction
The most intricate human-designed machines pale in comparison to the complexity and stunning functionality of the proteins created by evolution. The bewildering complexity of how protein primary sequences encode these remarkable functions, such as catalyzing in a few seconds chemical reactions that would otherwise take millions of years, reveals the extraordinary capability of natural evolution to seek out protein sequences encoding highly functional molecules from an immense sequence space representing mostly unfolded and dysfunctional proteins.
Natural evolution moves about protein sequence space by single mutational steps and by long jumps spanning many mutations via homologous or nonhomologous
recombination. Evidence of the effectiveness of these mutational moves is abundant and ubiquitous in nature: hundreds of different protein folds accounting for an innumerable number of biochemical functions makes up much of our living world. The trophies of natural protein evolution have inspired engineers to borrow nature’s algorithm to create new proteins with novel or improved properties. Here, I focus on homologous
recombination, and I show that it can be exploited in the laboratory to engineer enzymes with novel activities and specificities. Also, I propose that the products of homologous recombination, chimeras, may be more evolvable than their parents with respect to the native activity because their mutational neighborhood has never been searched by evolutionary processes.
from one functional native sequence to the next, however, the likelihood of preserving structure or function follows a parabolic curve whose initial slope is much less steep (Figure 1). With data from chimeric and randomly-mutated ß-lactamases, Drummond et al. showed that recombination is much more conservative than random mutation, leading to a folding probability that is many orders of magnitude greater at the highest mutation levels. By exploiting the conservative nature of mutations introduced into a structure that has already proven to tolerate them, recombination creates chimeric enzymes that are distant from one another in sequence with minimal loss in their probability of folding.
Figure 1: Chimeras occupy a functionally enriched ridge in sequence space. Surface height represents the probability of retaining fold as a function of random and
homologous substitutions. Substituting amino acids that already exist in a homologous protein is much more conservative of structure and function than random substitutions. Figure reproduced from [1].
SCHEMA works). Using structure-guided SCHEMA recombination, Otey et al. [3] partitioned the heme domains of cytochrome P450BM3 (CYP102A1) and homologs sharing 61-64% sequence identity into eight blocks and recombined those to make thousands of chimeric P450s. About 47% of the library encodes a properly folded P450, and of those more than 75% are functional. Functional chimeras differ from any known parent by up to 101 amino acid mutations (out of 466).
The inspiration to use homologous recombination to discover new physical and enzymatic properties comes from the observation that proteins with identical folds can diverge greatly not only in sequence, but also in function. The P450 scaffold represents an excellent system to begin this characterization because they comprise a large family of enzymes known to exhibit great diversity at the sequence and functional level. Thousands of P450 sequences exhibiting nearly identical folds and often only 15-20% sequence identity have been reported. They are known to accept many structurally diverse substrates ranging from flexible linear chain molecules like fatty acids to rigid planar molecules like testosterone. P450s are thus naturally malleable to both sequence and functional alterations.
The high sequence diversity among the folded members of the P450 SCHEMA library made this an excellent system to begin probing the functional diversity accessible by recombination. We measured the ability of the parents and fourteen chimeric P450s to hydroxylate a set of eleven substrates, including four human drugs. In chapter 1 I show that the best enzyme on each compound was always a chimera, and some chimeras accepted substrates not accepted by any of the parents. P450s play a major role in drug metabolism and are known to bind and hydroxylate the majority of the drugs we intake. Soluble, bacterial P450 chimeras that can produce drug metabolites may be useful for drug metabolic profiling and lead diversification.
unexplored. This argument trivially holds true for chimeras that are less fit than their parents but should also hold for chimeras that are as fit as their parents. Since
homologous recombination can introduce many mutations without disrupting folding and function, chimeragenesis may help resolve the problem of improving native activities. The underlying assumption of this theory is that the constraints that prevent the
improvement of native activities are evolutionary rather than biophysical or biochemical (i.e., native enzymes are locally rather than globally optimized). The hypothesis is that chimeragenesis provides a means of escape from these local optima and gives chimeras access to beneficial mutations that are not accessible to their wild-type counterparts. I validate this theory in the context of lattice proteins which are highly simplified models of a protein consisting of a chain of 20 monomers on a two-dimensional lattice, and I discuss the requirements that must be satisfied for these results to hold true in the context of real enzymes.
In chapter 3 I test the theory of chapter 2 on real cellulase chimeras assembled by SCHEMA recombination of the catalytic domains of Cel6A from Trichoderma reesei and its homologs from Humicola insolens and Chaetomium thermophilum. Cellulases
represent a good system to begin testing this theory because while it is extremely desirable to improve their native cellulolytic activity, to date, no one has reported significant enhancements of their specific activity suggesting that the mutational
neighborhood of these enzymes does not contain beneficial mutations. Furthermore, the existence of other glycoside hydrolases performing similar chemistry but exhibiting kcat values that are several orders of magnitude greater than those of cellulases suggests that these enzymes may be locally rather than globally optimized. The SCHEMA library represents a great opportunity to test the theory of chapter 2 because it contains many members that are heavily mutated and yet retain wild-type activities.
The mutational neighborhood of several cellulase chimeras was explored by random point mutagenesis to determine whether beneficial mutations not accessible to their parents could be found. Unfortunately only weakly beneficial mutations
of amino acid conservation in the functionally important regions of the parental enzymes, 3) a low frequency of beneficial mutations in the entirety of sequence space, and 4) a physical limitation to further improvements (i.e., the native enzymes are globally optimized). The various scenarios are discussed in more detail in the discussion of chapter 3.
SCHEMA Background
Proteins are naturally robust to homologous mutations (Figure 1). Computational
methods that exploit structural information can be used to further increase the probability that homologous mutations are tolerated and thus optimize the design of recombination libraries. This is effectively equivalent to raising the ridge connecting the two parents of Figure 1. These algorithms generally aim to simultaneously maximize the sequence diversity and the structural integrity of chimeric proteins.
with lower SCHEMA scores are more likely to function validating the physical significance of the scoring method.
1
Diversification of Catalytic Function in a Synthetic Family of
Cytochrome P450s
A version of the chapter has been published in [6]
1.1
Abstract
We report initial characterization of a synthetic family of more than 3,000 cytochrome P450s made by SCHEMA recombination of three bacterial CYP102s. Sixteen heme domains and their holoenzyme fusions with each of the three parental reductase domains were tested for activity on eleven different substrates. The results show that the chimeric enzymes have acquired significant functional diversity, including the ability to accept substrates not accepted by the parent enzymes. K-means clustering analysis of the activity data allowed the enzymes to be classified into five distinct groups based on substrate specificity. The substrates can also be grouped, such that one can be a
‘surrogate’ for others in the group. Fusion of a functional chimeric heme domain with a parental reductase domain always reconstituted a functional holoenzyme, indicating that key interdomain interactions are conserved upon reductase swapping.
1.2
Introduction
Enzymes with altered activities and specificities can be generated in the laboratory by processes that mimic mechanisms of natural evolution. Directed evolution combining recombination and random point mutation (e.g. DNA shuffling) is effective in generating both genotypic and phenotypic novelty [7-13]. Although recombination can make many mutations with relatively little structural disruption [14], we do not know the degree of functional diversity that is accessible to a process that only explores combinations of mutations already accepted during natural evolution.
recombination of the heme domains of CYP102A1 from Bacillus megaterium (A1) and its homologs CYP102A2 (A2) and CYP102A3 (A3) that exhibit ~65% amino acid identity, the chimeric proteins differ from the parent sequences by 72 out of 463–466 amino acids on average. Our current goal is to understand how this sequence
diversification relates to diversification of function. Initial studies [15,16] demonstrated that recombination, in the absence of point mutations, can generate functional features outside the range exhibited by the parental P450s. For example, a chimeric heme domain significantly more thermostable than any of the parents was identified (T50 = 62°C versus 55°C for the most stable parent) [15]; subsequent analysis of more than 200 chimeric heme domains identified many thermostable proteins [17]. Our previous study of selected chimeras of the A1 and A2 heme domains showed that chimeragenesis could also
generate activities not exhibited by the parents [16], as has also been reported for recombination of mammalian P450s [18,19].
The biological functions of cytochrome P450s include key roles in drug metabolism, breakdown of xenobiotics, and steroid and secondary metabolite biosynthesis [20]; members of the P450 superfamily catalyze hydroxylation and demethylation reactions on a vast array of substrates [21]. Enzymes from the synthetic P450 family could be useful catalysts for synthesis of biologically-active compounds if they have acquired the ability to accept substrates not accepted by the parent enzymes (which are all fatty acid hydroxylases). Identifying particular desired products, however, usually requires protein purification and HPLC and/or MS analysis, methods that are cumbersome when testing hundreds of biocatalysts. Thus, in addition to exploring the range of catalytic activities in the chimeric P450 family, a second goal of the current study is to determine to what extent ‘surrogate’ substrates can be used to identify likely catalyst candidates for a particular reaction in a high-throughput screening mode. Can substrates be grouped in such a way that activity towards one member of a group can be used to predict activity towards another?
Enzymes of the CYP102 family are comprised of a reductase domain and a heme domain connected by a flexible linker [22,23]. With a single amino acid substitution (F87A in A1 and F88A in A2 and A3), the heme domains can function alone as
The synthetic CYP102A family was constructed from parental sequences containing this mutation; all of the chimeric proteins can therefore potentially function as peroxygenases. We are also interested in their ability to be reconstituted into functional monooxygenases, utilizing NADPH and molecular oxygen for catalysis, by fusion to a reductase domain. The reductase domain of CYP102A1 (R1) spans ~585 amino acids and encodes a ~20 amino acid linker and the binding domains for the FMN, FAD and NADPH cofactors [23]. The reductases from CYP102A2 and CYP102A3 (R2 and R3) share 52-55%
sequence identity with R1 and are comparable in size, the only notable difference being a linker region that is extended in R2 by seven amino acids [25]. Because the chimeric heme domains comprise sequences from three different parents, it is not obvious that fusion to wildtype reductase will generate a catalytically active holoenzyme, nor is it clear which reductase, R1, R2 or R3, should be used. For this initial characterization we therefore selected a set of 14 chimeric heme domains, reconstituted them with all three parental reductase domains, and determined peroxygenase and monooxygenase activities on eleven substrates. These activities have been analyzed to 1) assess the functional diversity of the chimeric enzymes, 2) determine whether substrates fall into groups for the purposes of predicting activities, and 3) compare the activities and specificities of the chimeric peroxygenases with those of their reconstituted monooxygenases.
1.3
Results
1.3.1 Cloning and Expression of P450 Heme Domains and Holoenzymes
expressed very poorly, yielding only a very small amount of protein after purification, and were therefore not analyzed further.
The chimeric sequences are reported in terms of the parent from which each of the eight sequence blocks is inherited (Supplemental Table 1.S1). Twelve of the fourteen chimeras were selected because they displayed relatively high activities on substrates in preliminary studies (data not shown). Chimera 23132233 was chosen because it displayed
low peroxygenase activity, while 22312333 was selected because it is more thermostable
than any of the parents (T50 = 62°C) [15]. For the constructs studied here, the reductase identity is indicated as the ninth sequence element, with R0 referring to no reductase (i.e., heme domain peroxygenase).
1.3.2 Activity Assays
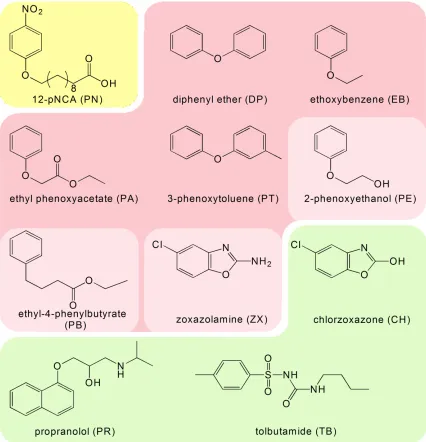
Figure 1.1: Chemical structures and abbreviations. Substrates are grouped according to
the pair-wise correlations (see text for details). Members of a group are highly correlated; intergroup correlations are low.
using absorbance values directly. Protein concentrations were reassayed in 96-well format and determined to be 0.88 µM +/- 13% (SD/average). All samples were prepared and analyzed in triplicate, and outlier data points were eliminated. Supplemental Tables 1.S2 and 1.S3 report the averages and standard deviations for each of the assays. More than 85% of the data for each substrate was retained, and more than 95% was retained for 6 of the 11 substrates (Supplemental Table 1.S4).
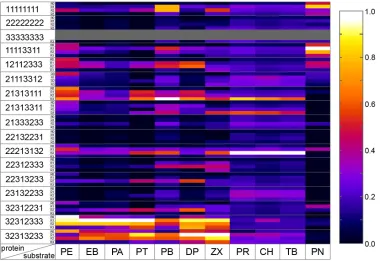
Figure 1.2: Summary of normalized activities for all 56 enzymes acting on 11 substrates.
Activities are shown using a color scale (white indicating highest and black lowest activity), with columns representing substrates and rows representing proteins. Not-analyzed A3, A3-R1 and A3-R2 proteins are shown in grey. Protein rows are ordered by their chimeric sequence first, and then by heme domain (R0) and R1-, R2- and R3-fusions.
1.3.3 Activities of Parent Enzymes
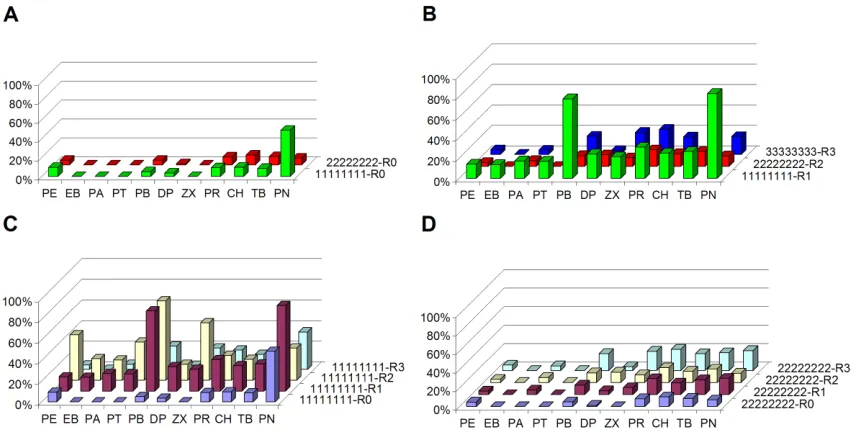
Figure 1.3A shows the normalized substrate-activity profiles of the A1 and A2
activity relative to A2, but did not alter the profile. The A3-R3 holoenzyme exhibits some activity on the drug-like substrates (PR, TB, CH) as well as PN and PB.
Fusion of the A1 and A2 heme domains to other reductase domains yields
[image:21.612.112.539.261.478.2]holoenzymes that are active on some substrates (Figures 1.3C and 1.3D). The A2 fusions have relatively low activities. A1 fusions with R1 and R2, on the other hand, created highly active enzymes with different specificities: the A1-R1 profile has peaks on PN and PB, while that of A1-R2 has peaks on PB, phenoxyethanol (PE) and zoxazolamine (ZX). The A1-R3 fusion is less active on nearly all substrates.
Figure 1.3: Substrate-activity profiles for parent heme domain mono- and peroxygenases.
Panel A shows parent peroxygenases, panel B parent holoenzyme monooxygenases profiles, panel C the A1 protein set and panel D the A2 protein set. In A and B the color indicates the origin of the heme domain (Green = A1; Red = A2; Blue = A3). The protein set in panel C includes the heme domain A1 (blue) or its R1- (purple), R2- (yellow) or R3-fusion (turquoise) protein. Panel D depicts the A2 protein set.
1.3.4 Activities of Chimeras and Identification of Chimera Clusters
holoenzyme, and chimeric peroxygenases consistently outperformed the parent peroxygenases (Figure 1.2 and Supplemental Figure 1.S2). The best enzyme for each substrate is listed in Supplemental Table 1.S5. All the best enzymes are chimeras. Most of the best enzymes are also holoenzymes—only PE has a peroxygenase as the best catalyst.
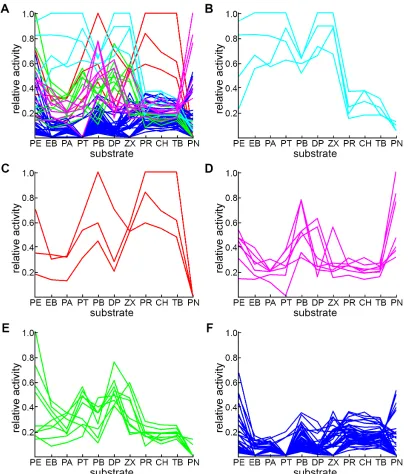
We now show that there exists a discrete set of characteristic substrate-activity profiles to which each chimera can be uniquely assigned. A k-means clustering analysis was applied to the normalized absorbance data to better understand the functional diversity. K-means clustering, a statistical algorithm that partitions data into clusters based on data similarity [30], has been used by Mannervik and co-workers to identify groups of mutants exhibiting similar substrate specificities [31] and by others to identify protein fragments (4-7 residues) of similar structure [32] and interacting nucleotide pairs with similar three dimensional structures [33]. For our analysis, the normalized data were used to ensure that each of the 11 dimensions is given equal weight by the clustering algorithm. The clustering was performed over values of k (number of clusters) ranging from k = 2 to k = 8. The highest silhouette value (see Experimental) was observed at k = 5.
The cluster composition for k=5 is depicted in Figure 1.4. Cluster 1, consisting of chimeras 32312333-R1/R2 and 32313233-R1/R2 (Figure 1.4B), is characterized by low relative activities on CH, TB, PR and PN and high relative activities on all other
substrates. In fact, two of these chimeras are the best enzymes on all the remaining substrates except PB and PE.
Cluster 2 is made up of 22213132-R2, 21313111-R3, 21313311-R3, which are the most active enzymes on TB, CH, and PR (Figure 1.4C). Cluster 2 enzymes are entirely inactive on PN and show low activity on most of the substrates that cluster 1 enzymes accept (PE, DP, PA, and EB). Relative activities on the remaining substrates (i.e., PB, ZX, and PT) are moderate (although lower than cluster 1 chimeras). An exception is 21313111-R3, which is the best enzyme for PB and also fairly good on PE and DP.
activity on PN (on which 11113311-R1/R2 and A1-R1 are the three top-ranking enzymes), and moderate to high relative activity on PB and moderate activity on PE.
Cluster 4 contains 21313111-R1/R2, 22313233-R2, 22312333-R2, 32312231-R2, 32312333-R0, 32312333-R3, 32313233-R0, and 32313233-R3 (Figure 1.4E). This cluster is characterized by having the highest relative activity on PE, in addition to moderate activities on PT, DP and ZX. The remaining chimeras appear in a fifth cluster with relatively low activity on everything except PN and PE (Figure 1.4F). This cluster contains parental sequences A1-R0, A1-R3, A2-R0, A2-R1/R2/R3 and A3-R3. Native sequences are thus only found in two of the clusters. The remaining clusters (1, 2 and 4) are made up of highly active chimeras that have acquired novel profiles.
The partition created by the clustering algorithm shows that the presence and identity of the reductase can alter the activity profile and thus the specificity of a heme domain sequence. For example, the R1 and R2 fusions of 32312333 and 32313233 appear in cluster 1, whereas their R0 and R3 counterparts are in cluster 4. Sequences 22213132 and 21313111 also behave differently when fused to different reductases. 22213132-R2, for example, displays pronounced peaks on substrates TB, CH and PR that are not present in the corresponding peroxygenase and R1/R3 profiles (Supplemental Figure 1.2E) and is thus the only member with this heme domain sequence appearing in cluster 2. 21313111-R3 and 21313111-R2/R1 have nearly opposite profiles
Figure 1.4: K-means clustering analysis separates chimeras into five clusters. All
protein-activity profiles are depicted in A, where the color identifies the cluster. Panels B through F show profiles for sequences within each cluster. Panel B depicts 32312333-R1/R2, 32313233-R1/R2. Panel C depicts 22213132-R2, 21313111-R3, 21313311-R3. Panel D depicts A1-R1/R2, 12112333-R1/R2, 11113311-R1/R2 and 22213132-R1. Panel E depicts 21313111-R1/R2, 22313233-R2, 22312333-R2, 32312231-R2, 32312333-R0, 32312333-R3, 32313233-R0, and 32313233-R3. Panel F depicts the remaining
1.3.5 Peroxygenase Versus Monooxygenase Activities
As shown in Figure 1.2, each of the 14 chimeric heme domains can be fused to a parental reductase to generate a functional monooxygenase. The resulting monooxygenases are generally more active under these conditions than the corresponding peroxygenases (see Supplemental Figure 1.S2). The R1 and R2 fusions tend to outperform R3 fusions. While altering reductase identity never completely deactivates the protein, it does affect
specificity in some cases. To quantify the differences between the profiles of the four different enzymes that can be made from a given chimera, the pair-wise linear
coefficients (R2) of the R0/R1, R0/R2, R0/R3, R1/R2, R1/R3 and R2/R3 profiles were determined for each heme domain sequence (with the exception of A3). The results are shown in Supplemental Table 1.S1. High correlations represent enzyme pairs with similar specificities. The results show that peroxygenase and monooxygenase specificities are usually different, R1/R2 fusions of a chimera are often very similar (five pairs have R2 values above 0.9), and the R1 and R2 fusions are less similar to the R3 enzymes.
1.3.6 Identification of Substrate Groups
ZX, PB and PE show moderate correlation to members of the group A core (R2 = 0.56-0.66, 0.39-0.56 and 0.35-0.61, respectively). These substrates are considered loosely associated with group A since they do not belong to any other group due to poor
correlation with each other and the remaining substrates.
There exists a correspondence between the chimera clusters and the substrate groups. Group A core substrates have cluster 1 chimeras as their top-performing
enzymes, whereas substrates of group B have cluster 2 chimeras as their top-performing enzymes. The top catalysts for group C are three of the cluster 3 chimeras. Members of a substrate group thus share the same best-performing enzymes.
1.4
Discussion
1.4.1 SCHEMA Recombination Creates a Family of Functionally Diverse Enzymes
1.4.2 Chimeras Can be Clustered by Substrate Specificity
We further showed that the chimeric enzymes exhibit distinct specificities and that they can be partitioned into clusters based on their specificity. One cluster contains parent A1-R1 and all chimeras with A1-like profiles. Another cluster contains low activity chimeras and includes all remaining parental sequences. The remaining clusters represent highly active chimeras that have acquired new specificities. Members of a cluster are likely to exhibit common structural, physical or chemical features that account for their similar catalytic properties. If the library is large enough, statistical techniques can be used to determine how sequence elements relate to the observed profiles. In particular, if there are sufficient numbers of chimeras in each cluster, then powerful tools such as logistic regression or machine learning can be used to predict which cluster an untested sequence belongs to [15]. This type of analysis would enable the prediction of substrate profiles of untested chimeras based on sequence information alone. The functionally diverse
enzymes generated by SCHEMA-guided recombination can therefore be used to probe the sequence and structural basis of enzyme specificity. We recently observed the success of such an approach in predicting the thermostabilities of untested chimeras [Yougen Li, et al. unpublished data]. Although the current data set does not contain enough sequences for a comprehensive analysis of sequence-function relationships, anecdotal observations can be used to generate hypotheses for further testing. For example, the chimeras in the library with parent A1 in blocks 1, 3 and 4 are all among the best enzymes for PN. These same enzymes display low relative activity on all the remaining substrates except for PB. This suggests that having parent A1 sequence at one or more of these blocks improves PN activity and specificity.
1.4.3 Substrates Fall into Groups that Correlate with Chimera Clusters
predict with reasonable accuracy the relative activities of a chimera on all the substrates in a group by testing activity on only one. This type of analysis can be expanded to a larger collection of substrates to identify additional groups or additional members of an existing group.
The observed correspondence between the three substrate groups and chimera clusters 1, 2 and 3 illustrates that each group can be associated with a cluster made up of or containing the top-performing enzymes for the substrates in that group. Some degree of correspondence can be expected, given how the partitions were constructed. However, because intra-group correlations are not one and inter-group correlations are not zero, the correspondence is not perfect. For this reason there exist chimeras whose profiles exhibit peaks on only certain members of a group (cluster 4) and others that exhibit peaks on members of different groups (cluster 2 and 3 chimeras). Cluster 4 chimeras have peaks on only certain members of group A and are thus responsible for the lower correlations among group A substrates. Some cluster 2 and cluster 3 chimeras exhibit peaks on PB (on the edge of group A) as well as group B and C, respectively. In fact although PB
correlates mostly with group A core substrates it shares its top-performing enzymes with groups B and C and thus displays a hybrid behavior. This is why PB correlates less with group A than core substrates do and why it has higher correlations with group B and C members than any other substrate not belonging to these groups.
Because chimeras displaying high relative activity have more weight in
1.4.4 Swapping Reductase Domains Consistently Yields Active
Monooxygenases and Conserves Key P450-Reductase FMN Domain Interactions
The literature reports multiple cases in which functional P450s have been reconstituted with new reductase domains. In several studies, swapping reductases improved
mammalian P450 activity [34-36]. A self-sufficient chimeric mammalian P450 2E1 enzyme was constructed by fusing the 2E1 heme domain to the CYP102A1 reductase [37]. Functional chimeras of CYP102A1 and the flavocytochrome nitric oxide synthase (nNOS) have been generated [38]. Another study reported the functional expression of CYP153A genes by incorporating them into a framework consisting of the N- and C- termini of homolog CYP153A13a and fusion to the reductase domain of CYP116B2 [39].
Reconstitution of the chimeric CYP102A heme domains with the three parental reductases generated functional monooxygenases in all cases. Although their specificities were often different (particularly when fused to R3), fusion to a reductase was never detrimental to activity, and swapping the reductase never completely inactivated the enzyme (Supplemental Figure 1.S2). Subtle changes in the structure and coupling behavior that affect total product formation may account for specificity differences. The fact that the parental reductase domains are accepted without loss of function, however, suggests that key domain-domain interactions are conserved upon reductase swapping.
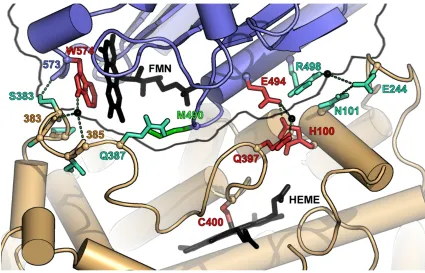
The direct hydrogen bond occurs between the reductase backbone carbonyl of N573 and the side-chain hydroxyl group of heme domain residue S383. N573 is only conserved in R1 and R2, but because the interaction involves the backbone oxygen, the reductase side of the interface is not affected by changes in the side-chain identity. S383 is only conserved in parents A1 and A3. However, the corresponding residue in A2, D385, may also be capable of forming the hydrogen bond. This interaction may therefore be present in all the chimeras.
There are two water-mediated hydrogen bonds between the hydrogen of the indole nitrogen of reductase residue W574 and the backbone carbonyl of S383 and I385. W574 was earlier shown to be crucial for electron transfer from the FMN to the heme [42] and is conserved in R1, R2 and R3. S383 and I385 are conserved in A1 and A3 but not A2, where the corresponding residues are D385 and V387. Because the hydrogen bonds involve the backbone oxygens of these residues, these interactions may be retained upon domain substitution. Also, all possible pair-wise interactions that can be formed at these positions by domain swapping already exist in at least one of the parental sequences and are thus likely not to be destabilizing. Finally, the substitutions that do occur are conservative, replacing a hydrophilic residue with another hydrophilic residue and a hydrophobic residue with another hydrophobic residue. The third water-mediated hydrogen bond between the side chains of reductase residue R498 and heme domain residue E244 (block 5) is conserved in A1-R1, A2-R2 but not A3-R3, where the
corresponding residues are G501 and V246. A3-R3 thus cannot form this interaction nor can any chimera that inherits A3 sequence at block 5 and/or is fused to R3.
domains: as long as key interactions are retained, the remaining sequences can vary extensively.
Figure 1.5: Interface between the FMN (blue backbone) and heme domain (brown
backbone) based on the 1BVY structure redrawn according to Sevrioukova et al. [40]. Residue colors indicate the degree of conservation: red (three parents), turquoise (two parents) and green (not conserved). Hydrogen bonds are shown as dashed lines. The amino acids correspond to CYP102A1 numbering. PyMOL was used to create this figure [43].
1.5
Conclusions
enzymes in this family have acquired the ability to mimic important reactions in human drug metabolism. The grouping of substrates according to likelihood that a given chimera will accept them, as has been demonstrated here, will aid in the identification of useful catalysts from this synthetic family by high-throughput screening of substrate
‘surrogates’. We anticipate that these enzymes will be useful for synthesis of drug metabolites [26], as needed for toxicity testing and drug discovery.
1.6
Experimental Methods
1.6.1 Nomenclature and Construction of Holoenzymes from Chimeric Heme Domains
Details of chimera construction have been reported previously [15]. Sequences are given an eight-digit number, where each digit indicates the parent from which each of the eight blocks was inherited. The identity of the reductase is indicated by R0 (for no reductase) or R1, R2 or R3 for the CYP102A1, A2, or A3 reductases, respectively.
To construct the holoenzymes, the chimeric heme domains were fused to each of the three wild-type reductase domains after amino acid residue 463 when the last block originates from CYP102A1 and 466 for CYP102A2 and CYP102A3. The holoenzymes were constructed by overlap extension PCR [45] and/or ligation and cloned into the pCWori expression vector [46]. All constructs were confirmed by sequencing.
1.6.2 Protein Expression and Purification
Proteins were expressed in E. coli as described previously and purified by anion
Protein concentration was measured by CO absorption at 450 nm as described [48]. A protein concentration of 1 µM was chosen for the activity assays. Protein
concentrations were reassayed in 96-well format and determined to be 0.88 µM +/- 13% (SD/average).
1.6.3 Functional Assays
Proteins were assayed for mono- or peroxygenase activities in 96-well plates as described [15,49]. Heme domains were assayed for peroxygenase activity using hydrogen peroxide as the oxygen and electron source. Reductase domain fusion proteins were assayed for monooxygenase activity, using molecular oxygen and NADPH. Reactions were carried out in 100 mM EPPS buffer pH 8, 1% acetone, 1% DMSO, 1 µM protein in 120 µl volumes. Substrate concentrations depended on their solubility under the assay
conditions. Final concentrations were: 2-phenoxyethanol (PE), 100 mM; ethoxybenzene (EB), 50 mM; ethyl phenoxyacetate (PA), 10 mM; 3-phenoxytoluene (PT), 10 mM; ethyl 4-phenylbutyrate (PB), 5 mM; diphenyl ether (DP), 10 mM; zoxazolamine (ZX), 5 mM; propranolol (PR), 4 mM; chlorzoxazone (CH), 5 mM; tolbutamide (TB), 10 mM; 12-p-nitrophenoxycarboxylic acid (PN), 0.25 mM. The reaction was initiated by the addition of NADPH or hydrogen peroxide stock solution (final concentration of 500 µM NADPH or 2 mM hydrogen peroxide) and mixed briefly. After two hours at room temperature, reactions with substrates 1-10 were quenched with 120 µl of 0.1 M NaOH and 4 M urea. Thirty-six µl of 0.6% (w/v) 4-aminoantipyrine (4-AAP) was then added. The 96-well plate reader was zeroed at 500 nm and 36 µl of 0.6% (w/v) potassium persulfate was added. After 20 min, the absorbance at 500 nm was read [28]. Reactions on PN were monitored directly at 410 nm by the absorption of accumulated 4-nitrophenol. All experiments were performed in triplicate, and the absorption data were averaged.
1.6.4 Data Analysis
in triplicates. All absorbance measurements were done once on three separate samples (triplicate sampling). Data points with a SD/average ! 20% that did not lie within the
average ± 1.1*SD were eliminated. 1.1*SD was chosen so that for each substrate at least 85% of the points were retained. This never resulted in the elimination of more than one point from each triplicate set of measurements. All points with an average absorbance < BG were set to zero, because they are assumed to belong to inactive proteins. The absorbance matrix thus obtained for all 68 proteins on all 11 substrates is displayed in Supplemental Table 1.S2. The SD/average matrix is displayed in Supplemental Table 1.S3. SD/average was calculated ignoring values for inactive enzymes.
1.6.5 Cluster Analysis
K-means clustering is a partitioning method that divides a set of observations into k mutually exclusive clusters. K-means treats each data point as an object having a location in m-dimensional space (m=11 in this analysis) [30]. It then finds a partition such that members of the same cluster are as close as possible to each other and as far as possible to members of other clusters. For this reason, a measure of the meaningfulness of a
partition is given by the silhouette value
( ) ( )
( ) ( )
[
]
!! " # $$ % & ' = i b i a i a i b avg s ,max , where a(i) is the
average distance of point i to all other points in its cluster and b(i) is the average distance of point i to all points in the closest cluster. It is evident that "1#s#1 and the quality of
the clustering increases as s -> 1 [50]. Distances are measured by the square of the Euclidean distance.
1.7
Acknowledgments
1.8
Supplementary Material
Table 1.S1: Pair-wise correlations of normalized activities for monooxygenases (R1, R2,
R3) and peroxygenases (R0) of fourteen chimeras and the A1 and A2 parents. R2 values are reported. Bold and underlined=0.7-1.0; Underlined=0.4-0.7; Regular=0.0-0.4.
Heme sequence R0/R1 R0/R2 R0/R3 R1/R2 R1/R3 R2/R3 11111111 0.49 0.00 0.53 0.21 0.66 0.11
22222222 0.70 0.53 0.49 0.75 0.83 0.66
11113311 0.61 0.65 0.49 0.90 0.59 0.78 12112333 0.11 0.04 0.00 0.91 0.11 0.10
21113312 0.14 0.01 0.00 0.73 0.76 0.77 21313111 0.24 0.19 0.05 0.84 0.15 0.39
21313311 0.25 0.28 0.00 0.41 0.01 0.34
21333233 0.90 0.64 0.87 0.72 0.95 0.66
22132231 0.80 0.85 0.56 0.98 0.64 0.60
22213132 0.46 0.08 0.37 0.11 0.01 0.54
22312333 0.01 0.02 0.00 0.69 0.69 0.25
22313233 0.17 0.01 0.08 0.02 0.85 0.07
23132233 0.96 0.89 0.97 0.90 0.99 0.90 32312231 0.14 0.06 0.02 0.07 0.04 0.21
32312333 0.33 0.41 0.02 0.97 0.40 0.33
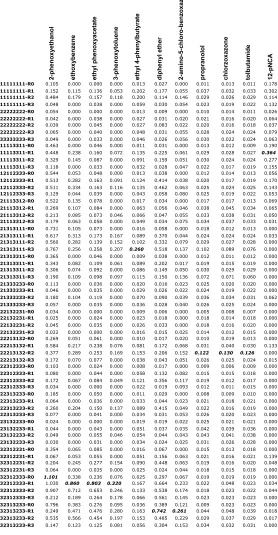
Table 1.S2: Average activity in absorbance units for each substrate-construct pair
(maximal value for each substrate in bold/italic).
2-phenoxyethanol ethoxybenzene ethyl phenoxyacetate 3-phenoxytoluene ethyl 4-phenylbutyrate diphenyl ether 2-amino-5-chloro-benzoxazole propranolol chlorzoxazone tolbutamide 12-pNCA
11111111-R0 0.105 0.000 0.000 0.000 0.013 0.027 0.000 0.011 0.013 0.011 0.178
11111111-R1 0.152 0.115 0.136 0.053 0.202 0.177 0.055 0.037 0.032 0.033 0.302
11111111-R2 0.484 0.179 0.157 0.118 0.200 0.114 0.146 0.029 0.026 0.029 0.114
11111111-R3 0.048 0.000 0.038 0.000 0.059 0.030 0.054 0.023 0.019 0.022 0.132
22222222-R0 0.054 0.000 0.000 0.000 0.013 0.009 0.000 0.010 0.014 0.011 0.026
22222222-R1 0.042 0.000 0.038 0.000 0.027 0.031 0.020 0.021 0.016 0.020 0.064
22222222-R2 0.039 0.000 0.045 0.000 0.027 0.083 0.022 0.020 0.016 0.018 0.037
22222222-R3 0.065 0.000 0.040 0.000 0.048 0.031 0.055 0.028 0.024 0.024 0.079
33333333-R3 0.049 0.000 0.033 0.000 0.046 0.026 0.056 0.030 0.022 0.024 0.063
11113311-R0 0.463 0.000 0.046 0.000 0.011 0.031 0.000 0.013 0.012 0.009 0.190
11113311-R1 0.448 0.238 0.160 0.072 0.135 0.225 0.061 0.029 0.028 0.027 0.364
11113311-R2 0.329 0.145 0.087 0.000 0.091 0.159 0.051 0.030 0.024 0.024 0.277
11113311-R3 0.118 0.000 0.033 0.000 0.032 0.028 0.047 0.022 0.017 0.019 0.155
12112333-R0 0.544 0.053 0.048 0.000 0.013 0.038 0.000 0.012 0.014 0.013 0.056
12112333-R1 0.513 0.282 0.163 0.091 0.124 0.414 0.038 0.020 0.017 0.019 0.170
12112333-R2 0.511 0.334 0.163 0.116 0.135 0.462 0.063 0.025 0.024 0.025 0.143
12112333-R3 0.129 0.044 0.039 0.000 0.043 0.058 0.080 0.025 0.019 0.022 0.053
21113312-R0 0.522 0.135 0.078 0.000 0.017 0.034 0.000 0.017 0.017 0.013 0.069
21113312-R1 0.269 0.107 0.084 0.000 0.063 0.056 0.046 0.038 0.045 0.034 0.065
21113312-R2 0.213 0.085 0.073 0.046 0.066 0.047 0.055 0.033 0.038 0.031 0.050
21113312-R3 0.179 0.063 0.058 0.000 0.049 0.034 0.075 0.034 0.037 0.033 0.031
21313111-R0 0.731 0.105 0.073 0.000 0.016 0.058 0.000 0.018 0.012 0.013 0.000
21313111-R1 0.617 0.313 0.173 0.167 0.089 0.370 0.044 0.024 0.024 0.024 0.033
21313111-R2 0.560 0.282 0.139 0.152 0.102 0.332 0.079 0.029 0.027 0.028 0.000
21313111-R3 0.767 0.256 0.258 0.207 0.260 0.518 0.137 0.102 0.089 0.076 0.000
21313311-R0 0.365 0.000 0.046 0.000 0.009 0.038 0.000 0.012 0.011 0.012 0.000
21313311-R1 0.343 0.082 0.109 0.061 0.089 0.202 0.017 0.019 0.015 0.019 0.000
21313311-R2 0.306 0.074 0.092 0.000 0.086 0.149 0.050 0.030 0.029 0.029 0.000
21313311-R3 0.190 0.109 0.098 0.097 0.115 0.150 0.136 0.072 0.071 0.060 0.000
21333233-R0 0.113 0.000 0.036 0.000 0.020 0.016 0.023 0.025 0.020 0.020 0.000
21333233-R1 0.046 0.000 0.035 0.000 0.029 0.026 0.022 0.024 0.019 0.022 0.000
21333233-R2 0.180 0.104 0.119 0.000 0.070 0.090 0.039 0.036 0.034 0.031 0.062
21333233-R3 0.057 0.000 0.035 0.000 0.036 0.028 0.040 0.026 0.025 0.024 0.000
22132231-R0 0.034 0.000 0.000 0.000 0.009 0.006 0.000 0.005 0.008 0.007 0.000
22132231-R1 0.025 0.000 0.024 0.000 0.023 0.018 0.000 0.018 0.014 0.018 0.000
22132231-R2 0.045 0.000 0.035 0.000 0.026 0.033 0.000 0.018 0.016 0.020 0.000
22132231-R3 0.022 0.000 0.000 0.000 0.016 0.015 0.025 0.014 0.012 0.015 0.000
22213132-R0 0.269 0.051 0.061 0.000 0.010 0.017 0.020 0.010 0.019 0.013 0.000
22213132-R1 0.584 0.217 0.238 0.076 0.081 0.172 0.068 0.031 0.040 0.030 0.133
22213132-R2 0.377 0.289 0.253 0.169 0.153 0.206 0.152 0.122 0.130 0.126 0.000
22213132-R3 0.172 0.070 0.077 0.000 0.038 0.043 0.051 0.026 0.025 0.024 0.015
22312333-R0 0.103 0.000 0.024 0.000 0.008 0.017 0.000 0.009 0.006 0.009 0.000
22312333-R1 0.080 0.000 0.044 0.000 0.058 0.132 0.082 0.015 0.015 0.018 0.000
22312333-R2 0.172 0.067 0.084 0.049 0.121 0.356 0.117 0.019 0.012 0.017 0.000
22312333-R3 0.034 0.000 0.000 0.000 0.022 0.019 0.093 0.012 0.011 0.015 0.000
22313233-R0 0.185 0.000 0.050 0.000 0.011 0.029 0.000 0.008 0.009 0.010 0.000
22313233-R1 0.064 0.000 0.036 0.000 0.033 0.044 0.023 0.021 0.018 0.021 0.000
22313233-R2 0.260 0.204 0.150 0.137 0.089 0.415 0.049 0.022 0.016 0.019 0.000
22313233-R3 0.077 0.000 0.041 0.000 0.034 0.031 0.053 0.026 0.020 0.023 0.000
23132233-R0 0.024 0.000 0.000 0.000 0.019 0.019 0.022 0.025 0.021 0.021 0.000
23132233-R1 0.044 0.000 0.043 0.000 0.051 0.037 0.035 0.042 0.039 0.036 0.000
23132233-R2 0.049 0.000 0.055 0.046 0.054 0.044 0.043 0.043 0.041 0.038 0.000
23132233-R3 0.030 0.000 0.031 0.000 0.034 0.024 0.025 0.031 0.026 0.028 0.000
32312231-R0 0.354 0.065 0.085 0.000 0.016 0.067 0.000 0.015 0.013 0.018 0.000
32312231-R1 0.067 0.053 0.055 0.000 0.051 0.156 0.063 0.021 0.016 0.021 0.139
32312231-R2 0.204 0.245 0.277 0.154 0.090 0.448 0.063 0.019 0.016 0.020 0.048
32312231-R3 0.064 0.000 0.035 0.000 0.025 0.024 0.044 0.018 0.015 0.018 0.000
32312333-R0 1.101 0.338 0.236 0.076 0.025 0.297 0.067 0.019 0.019 0.019 0.000
32312333-R1 1.030 0.860 0.803 0.320 0.167 0.664 0.233 0.022 0.048 0.023 0.034
32312333-R2 0.907 0.712 0.653 0.246 0.133 0.538 0.174 0.018 0.023 0.022 0.044
32312333-R3 0.212 0.189 0.264 0.178 0.066 0.561 0.145 0.023 0.023 0.023 0.000
32313233-R0 0.796 0.383 0.276 0.095 0.036 0.389 0.121 0.009 0.023 0.023 0.000
32313233-R1 0.249 0.471 0.476 0.280 0.163 0.742 0.261 0.044 0.048 0.039 0.018
32313233-R2 0.535 0.566 0.454 0.197 0.153 0.485 0.229 0.029 0.037 0.029 0.017
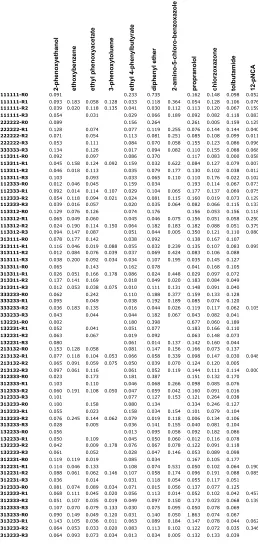
Table 1.S3: Standard deviations/ average of absorbance for each substrate-construct pair.
Blanks indicate where the average absorbance equals zero.
2-phenoxyethanol ethoxybenzene ethyl phenoxyacetate 3-phenoxytoluene ethyl 4-phenylbutyrate diphenyl ether 2-amino-5-chloro-benzoxazole propranolol chlorzoxazone tolbutamide 12-pNCA
11111111-R0 0.091 0.233 0.735 0.162 0.148 0.098 0.052
11111111-R1 0.093 0.183 0.058 0.128 0.033 0.118 0.364 0.054 0.128 0.106 0.076
11111111-R2 0.039 0.020 0.118 0.135 0.041 0.030 0.112 0.113 0.120 0.067 0.159
11111111-R3 0.054 0.031 0.029 0.066 0.189 0.092 0.082 0.118 0.083
22222222-R0 0.089 0.156 0.264 0.261 0.005 0.159 0.125
22222222-R1 0.128 0.074 0.077 0.119 0.255 0.076 0.144 0.144 0.040
22222222-R2 0.071 0.054 0.113 0.081 0.251 0.085 0.108 0.099 0.011
22222222-R3 0.053 0.111 0.084 0.070 0.058 0.155 0.123 0.086 0.096
33333333-R3 0.134 0.126 0.017 0.094 0.082 0.110 0.155 0.088 0.068
11113311-R0 0.092 0.097 0.086 0.370 0.117 0.083 0.000 0.058
11113311-R1 0.045 0.158 0.124 0.092 0.159 0.032 0.622 0.084 0.127 0.079 0.007
11113311-R2 0.046 0.018 0.113 0.035 0.079 0.177 0.130 0.102 0.038 0.012
11113311-R3 0.103 0.093 0.033 0.065 0.110 0.110 0.176 0.022 0.102
12112333-R0 0.012 0.046 0.045 0.159 0.034 0.193 0.114 0.067 0.073
12112333-R1 0.092 0.014 0.114 0.107 0.029 0.104 0.065 0.177 0.137 0.069 0.075
12112333-R2 0.054 0.118 0.094 0.021 0.024 0.081 0.115 0.160 0.019 0.073 0.129
12112333-R3 0.039 0.016 0.057 0.020 0.035 0.064 0.082 0.066 0.115 0.133
21113312-R0 0.129 0.076 0.126 0.074 0.176 0.156 0.053 0.156 0.118
21113312-R1 0.065 0.049 0.060 0.045 0.046 0.075 0.156 0.051 0.058 0.250
21113312-R2 0.024 0.190 0.114 0.150 0.064 0.182 0.183 0.182 0.088 0.051 0.379
21113312-R3 0.094 0.147 0.087 0.051 0.044 0.005 0.350 0.121 0.110 0.080
21313111-R0 0.078 0.177 0.142 0.038 0.092 0.138 0.167 0.107
21313111-R1 0.116 0.046 0.019 0.088 0.055 0.032 0.239 0.135 0.107 0.083 0.095
21313111-R2 0.012 0.084 0.076 0.039 0.037 0.069 0.424 0.083 0.106 0.088
21313111-R3 0.038 0.200 0.092 0.034 0.034 0.107 0.195 0.035 0.145 0.127
21313311-R0 0.065 0.143 0.162 0.078 0.041 0.168 0.105
21313311-R1 0.026 0.051 0.166 0.178 0.086 0.024 0.448 0.029 0.097 0.072
21313311-R2 0.137 0.141 0.169 0.018 0.049 0.020 0.183 0.084 0.049
21313311-R3 0.012 0.053 0.038 0.075 0.010 0.111 0.131 0.148 0.091 0.040
21333233-R0 0.062 0.242 0.110 0.188 0.377 0.159 0.133 0.128
21333233-R1 0.095 0.049 0.038 0.192 0.189 0.085 0.074 0.120
21333233-R2 0.036 0.183 0.135 0.016 0.044 0.026 0.119 0.117 0.062 0.105
21333233-R3 0.043 0.044 0.044 0.182 0.067 0.043 0.082 0.041
22132231-R0 0.002 0.180 0.398 0.677 0.060 0.189
22132231-R1 0.052 0.041 0.051 0.077 0.183 0.166 0.110
22132231-R2 0.063 0.067 0.019 0.092 0.063 0.148 0.073
22132231-R3 0.080 0.061 0.014 0.137 0.142 0.160 0.044
22213132-R0 0.153 0.128 0.058 0.081 0.147 0.156 0.166 0.073 0.137
22213132-R1 0.077 0.118 0.104 0.053 0.066 0.058 0.339 0.098 0.147 0.030 0.048
22213132-R2 0.065 0.091 0.059 0.075 0.050 0.039 0.070 0.124 0.120 0.005
22213132-R3 0.097 0.061 0.116 0.061 0.052 0.119 0.144 0.111 0.114 0.000
22312333-R0 0.023 0.173 0.181 0.387 0.151 0.132 0.170
22312333-R1 0.103 0.110 0.046 0.068 0.266 0.098 0.085 0.076
22312333-R2 0.060 0.191 0.108 0.050 0.047 0.059 0.042 0.160 0.091 0.016
22312333-R3 0.101 0.077 0.127 0.153 0.121 0.264 0.038
22313233-R0 0.100 0.158 0.080 0.134 0.334 0.246 0.127
22313233-R1 0.055 0.023 0.158 0.034 0.154 0.101 0.079 0.104
22313233-R2 0.076 0.245 0.144 0.062 0.079 0.019 0.118 0.006 0.134 0.106
22313233-R3 0.028 0.005 0.036 0.141 0.155 0.040 0.081 0.104
23132233-R0 0.056 0.013 0.095 0.058 0.092 0.182 0.086
23132233-R1 0.050 0.109 0.045 0.050 0.060 0.012 0.116 0.078
23132233-R2 0.042 0.009 0.178 0.076 0.067 0.078 0.122 0.091 0.118
23132233-R3 0.061 0.052 0.028 0.047 0.146 0.053 0.089 0.098
32312231-R0 0.119 0.119 0.019 0.085 0.034 0.167 0.105 0.177
32312231-R1 0.114 0.046 0.133 0.108 0.074 0.531 0.050 0.102 0.064 0.190
32312231-R2 0.088 0.061 0.062 0.146 0.107 0.058 0.174 0.096 0.191 0.088 0.085
32312231-R3 0.036 0.014 0.031 0.118 0.054 0.055 0.117 0.051
32312333-R0 0.081 0.074 0.089 0.034 0.071 0.015 0.056 0.137 0.077 0.125
32312333-R1 0.068 0.111 0.045 0.020 0.056 0.113 0.014 0.052 0.102 0.042 0.457
32312333-R2 0.051 0.107 0.035 0.019 0.049 0.097 0.150 0.173 0.023 0.068 0.139
32312333-R3 0.107 0.070 0.079 0.133 0.030 0.075 0.095 0.050 0.078 0.069
32313233-R0 0.090 0.149 0.049 0.120 0.031 0.140 0.050 1.863 0.074 0.067
32313233-R1 0.143 0.105 0.036 0.011 0.063 0.089 0.184 0.147 0.078 0.044 0.062
32313233-R2 0.064 0.053 0.033 0.020 0.083 0.113 0.102 0.122 0.072 0.035 0.346
Table 1.S4: Summary of error statistics for collected absorbance data sorted by
substrates. The percentage of the standard deviation divided by the average value and the percentage of data points retained for the analysis are measures of data quality. For each substrate, 65 data points were collected. The Triplicates/Duplicates column indicates how many of those data points were used for the analysis performed here.
Substrate % SD/avg
(mean) % points retained Triplicates/ Duplicates
2-phenoxyethanol (PE) 7.1 99 63/2
ethoxybenzene (EB) 10.2 87 39/26
ethyl phenoxyacetate (PA) 8.5 95 56/9
3-phenoxytoluene (PT) 8.0 94 53/12
ethyl 4-phenylbutyrate (PB) 6.7 100 65/0
diphenyl ether (DP) 10.9 95 56/9
zoxazolamine (ZX) 16.0 87 40/25
propranolol (PR) 15.6 90 45/20
chlorzoxazone (CH) 11.2 99 63/2
tolbutamide (TB) 8.5 99 63/2
12-p-nitrophenoxycarboxylic acid (PN) 11.8 87 40/25
Table 1.S5: Summary of most active chimeric proteins for each substrate. Pair-wise
correlation matrix of the activities on all substrates. ). R2 values are reported. Bold and underlined=0.7-1.0; Underlined=0.4-0.7; Regular=0.0-0.4
Protein PE EB PA PT PB DP ZX PR CH TB PN
32312231-R0 PE N.A. 0.61 0.48 0.37 0.18 0.35 0.15 0.01 0.05 0.02 0.01
32312231-R1 EB N.A. 0.92 0.80 0.41 0.73 0.56 0.04 0.13 0.06 0.00
32312231-R1 PA N.A. 0.81 0.39 0.71 0.62 0.04 0.14 0.06 0.00
32312231-R1 PT N.A. 0.56 0.85 0.66 0.14 0.24 0.16 0.00
21313111-R3 PB N.A. 0.49 0.49 0.36 0.37 0.33 0.08
32313233-R1 DP N.A. 0.58 0.05 0.10 0.06 0.00
32313233-R1 ZX N.A. 0.18 0.29 0.21 0.00
22213132-R2 PR N.A. 0.91 0.95 0.00
22213132-R2 CH N.A. 0.94 0.00
22213132-R2 TB N.A. 0.00
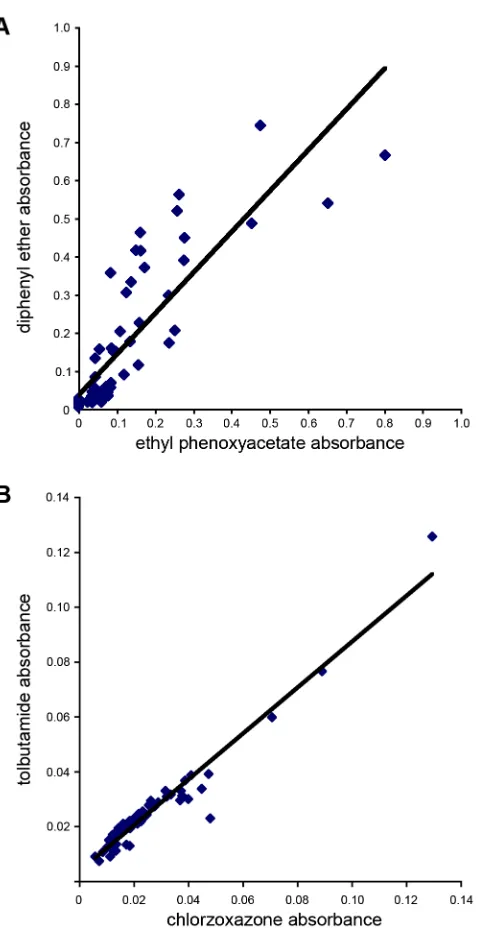
Figure 1.S1: Examples of the correlation of absorbances values measured within
A 0% 20% 40% 60% 80% 100%
PE EB PA PT PB DP ZX PR CH TB PN
23132233-R023132233-R1 23132233-R223132233-R3 B 0% 20% 40% 60% 80% 100%
PE EB PA PT PB DP ZX PR CH TB PN
22222222-R022222222-R1 22222222-R222222222-R3 C 0% 20% 40% 60% 80% 100%
PE EB PA PT PB DP ZX PR CH TB PN
11111111-R011111111-R1 11111111-R211111111-R3 D 0% 20% 40% 60% 80% 100%
PE EB PA PT PB DP ZX PR CH TB PN
32312333-R032312333-R1 32312333-R232312333-R3 E 0% 20% 40% 60% 80% 100%
PE EB PA PT PB DP ZX PR CH TB PN
22213132-R022213132-R1 22213132-R222213132-R3 F 0% 20% 40% 60% 80% 100%
PE EB PA PT PB DP ZX PR CH TB PN
22312333-R022312333-R1 22312333-R222312333-R3 G 0% 20% 40% 60% 80% 100%
PE EB PA PT PB DP ZX PR CH TB PN
12112333-R012112333-R1 12112333-R212112333-R3 H 0% 20% 40% 60% 80% 100%
PE EB PA PT PB DP ZX PR CH TB PN
I 0% 20% 40% 60% 80% 100%
PE EB PA PT PB DP ZX PR CH TB PN
32313233-R032313233-R1 32313233-R232313233-R3 J 0% 20% 40% 60% 80% 100%
PE EB PA PT PB DP ZX PR CH TB PN
21313111-R021313111-R1 21313111-R221313111-R3 K 0% 20% 40% 60% 80% 100%
PE EB PA PT PB DP ZX PR CH TB PN
11113311-R011113311-R1 11113311-R211113311-R3 L 0% 20% 40% 60% 80% 100%
PE EB PA PT PB DP ZX PR CH TB PN
32312231-R032312231-R1 32312231-R232312231-R3 M 0% 20% 40% 60% 80% 100%
PE EB PA PT PB DP ZX PR CH TB PN
22132231-R022132231-R1 22132231-R222132231-R3 N 0% 20% 40% 60% 80% 100%
PE EB PA PT PB DP ZX PR CH TB PN
21313311-R021313311-R1 21313311-R221313311-R3 O 0% 20% 40% 60% 80% 100%
PE EB PA PT PB DP ZX PR CH TB PN
21333233-R021333233-R1 21333233-R221333233-R3 P 0% 20% 40% 60% 80% 100%
PE EB PA PT PB DP ZX PR CH TB PN
22313233-R022313233-R1 22313233-R222313233-R3
Figure 1.S2: Substrate-activity profiles of all chimeras. The columns are color coded as
2
Evolvability of Evolutionarily Young Enzymes
2.1
Abstract
Native enzymes have been highly optimized by natural evolution to perform their
biological function. For this reason, improving the native activities of wild-type enzymes is challenging and often unsuccessful. Yet there are scientific and industrial applications that would benefit from an understanding of how to do this. Here, I propose that proteins with mutational neighborhoods that have never been searched by evolutionary processes are more evolvable than native proteins of equal fitness. I propose that homologous recombination can be used to design proteins with unexplored mutational neighborhoods because it affords the simultaneous incorporation of numerous neutral mutations. I validate this hypothesis in the context of lattice proteins, which are highly simplified models of a protein on a two-dimensional lattice. The underlying assumption of my hypothesis is that the constraints that prevent improving the activities of native enzymes are evolutionary rather than biochemical or biophysical (i.e., native enzymes are locally rather than globally optimized).
2.2
Introduction
Native enzymes are the products of millions of years of evolution. Evolutionary pressure fine-tuned their amino acid sequence to optimize biological function. This may translate to maximizing catalytic activity, resistance to high temperatures or extremely acidic environments, regioselectivity, stereospecificity, and more. As a consequence,
a significant role in the development of an environmentally friendly alternative to gasoline and the attenuation of the energy crisis, but their specific activity is too low [51,52]. Protein engineers have devoted much effort to improving the activities of these enzymes without significant success.
In general we do not know whether the constraints that prevent improving the native activities of wild-type enzymes are physical or evolutionary. In some cases natural evolution has driven native enzymes to be so efficient that they are binding substrate and releasing product as fast as diffusion allows. These enzymes are globally optimized and cannot be engineered to perform better. In most cases, however, there is no evidence of physical limitations constraining the activities of native enzymes. In fact it is not unlikely that many natural enzymes are only locally optimized (i.e., none of the possible single mutational steps lead to an increase in fitness despite the existence of better enzymes) and need many amino acid substitutions to escape the local optima.
In nature recombination may have aided proteins escape local maxima of the fitness landscape (fitness as a function of sequence) by introducing many homologous mutations to which proteins are highly tolerant. With data from chimeric and randomly mutated ß-lactamases, Drummond et al. [1] showed that recombination is much more conservative than random mutation, leading to a probability of folding and retaining function that is many orders of magnitude greater at the highest mutation levels. In fact, Heinzelman et al. recently designed a chimeric library of cellulases containing members with wild-type levels of cellulolytic activity and over 50 mutations relative to their closest parent [53]. Before them, others were able to achieve similar results with ß-lactamases and P450s [3,5]. The dozens of neutral mutations afforded by recombination may allow protein engineers to bypass the local maxima of native enzymes.
argument does not require that native enzymes be strictly locally maximized. Rather, it only requires that their mutational neighborhood be explored by evolution. The
underlying assumption of this argument is that native enzymes are not globally optimized.
Since the building blocks of chimeras are derived from native enzymes, it is unclear whether their mutational neighborhood is effectively unexplored. A mutation is effectively unexplored when the contribution to fitness that it makes in a chimeric background is different from the contribution it makes in a parental background. This occurs when the contribution depends on the amino acid identities of other residues. If it depends on one other residue, the pair forms a second order interaction. If it depends on two other residues the triplet forms a third order interaction and so on. As suggested by Figure 2.1A, mutations must be recruited into locally non-native environments to make different contributions to fitness in a chimera versus a parent, unless they interact with distal residues.
The crossovers of recombination can disrupt native interactions and form new non-native interactions. When a residue interacts with a single other residue, the
formation of a new interaction does not grant access to effectively unexplored mutations. This is because all pair-wise combinations of amino acids that are accessible to the chimera are also accessible to one of their parents (Figure 2.1B). However, when a mutation occurs in a network of three or more interacting residues then, provided the network was disrupted by the crossovers of recombination, chimeras can gain access to combinations of amino acids that are not accessible to their parents (Figure 2.1B). In order for chimeras to be more evolvable than their native parents, there must exist mutations that are beneficial in the background of the former but not in that of the latter. This can occur only when a mutation is recruited into a network of three or more
Figure 2.1: A. Effect of mutations in different chimeric lattice protein backgrounds. The
red and blue segments represent fragments derived from different native proteins and the magenta circle represents a point mutation. When mutations are recruited into locally native environments (left) they interact with the same residues and make the same contributions to fitness as they would in a parental background unless they also interact with distal residues. Instead, when they are recruited into less native environments (right) they are less likely to make the same contribution to fitness in native and chimeric
backgrounds. B. Chimeras can access combinations of residues not accessible to their parents only when third or higher order interactions are disrupted by crossovers. Red and blue circles represent residues from different parents and dotted lines represent
interactions. Magenta circles represent point mutations. When a mutation occurs in the context of a pair-wise interaction that was disrupted by a crossover, it leads to a
Here, I use the lattice protein framework to investigate the relationship between the order of the interactions contributing to fitness and the evolvability of chimeric lattice proteins relative to native ones. Lattice proteins are highly simplified models of a protein consisting of a chain of 20 monomers on a two-dimensional lattice. Lattice proteins have been widely used to address questions of general principle related to protein folding, structure, and evolution. For example, lattice proteins have been used to propose statistical explanations to the marginal stability of real proteins [54] and the apparent anti-correlation between stability and activity [55]. In some cases, the results from lattice protein simulations have been validated by observations made on real proteins and by direct experimentation. For example, lattice protein simulations predict that sequences enriched in consensus amino acids are highly stable and robust to mutations [56,57]. Consensus mutations have been widely used to stabilize proteins [58-61] and Bloom and co-workers showed that stable enzymes are more robust to mutations [62]. A
comprehensive review on lattice proteins can be found in [63].
I show that lattice proteins whose mutational neighborhoods have not been
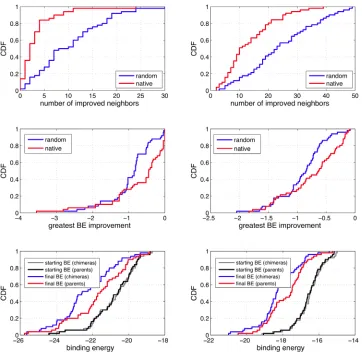
searched by evolutionary processes are more evolvable than native lattice proteins having equal fitness. I show that the mutational neighborhood of chimeric lattice proteins is effectively unexplored only when high order interactions contribute to fitness and are broken by the crossovers of recombination. Here, the evolvability of a lattice protein is evaluated according to three measures: 1) the number of improved single-mutant
neighbors, 2) the greatest improvement in fitness among the improved neighbors, and 3) the fitness attained after a steepest ascent walk. A steepest ascent walk is one in which after each step the fitnesses of all the single-mutant neighbors are enumerated and the walk moves to the sequence bearing the greatest improvement in fitness until a local maximum is reached. To a first approximation, directed evolution is a steepest ascent walk.
by evolution (as is the case for mutations occurring in native proteins). Therefore, on average, I expect proteins with unexplored mutational neighborhoods to have access to a greater number of beneficial mutations than native proteins having equal fitness (first measure of evolvability). Likewise, strongly beneficial mutations are unlikely to be found in the neighborhood of native enzymes because if they existed evolution would have selected them. Thus, I expect proteins with unexplored mutational neighborhoods to have access to more strongly beneficial mutations than native proteins having equal fitness (second measure of evolvability). Finally, after each step of a steepest ascent walk, I expect chimeras to continue encountering more and better beneficial mutations than native proteins (for the same reasons supporting the first two measures of evolvability) and thus attain a higher fitness at the end of the walk (third measure of evolvability). This requires that the mutational neighborhood of native enzymes be searched beyond the one-mutant neighbors.
2.3
Methods
2.3.1 Lattice Proteins
The lattice proteins [55,62-66] used in the simulations are highly simplified models of a protein consisting of a chain of 20 monomers on a two-dimensional lattice that can occupy any one of 41,889,578 possible compact or non-compact conformations. The mono