The X-linked histone demethylase Kdm6a in
CD4
+
T lymphocytes modulates autoimmunity
Yuichiro Itoh, … , Arthur P. Arnold, Rhonda R. Voskuhl
J Clin Invest.
2019;
129(9)
:3852-3863.
https://doi.org/10.1172/JCI126250
.
Multiple sclerosis (MS) is a putative T cell–mediated autoimmune disease. As with many
autoimmune diseases, females are more susceptible than males. Sexual dimorphisms may
be due to differences in sex hormones, sex chromosomes, or both. Regarding sex
chromosome genes, a small percentage of X chromosome genes escape X inactivation and
have higher expression in females (XX) compared with males (XY). Here, high-throughput
gene expression analysis in CD4
+T cells showed that the top sexually dimorphic gene was
Kdm6a
, a histone demethylase on the X chromosome. There was higher expression of
Kdm6a
in females compared with males in humans and mice, and the four core genotypes
(FCG) mouse model showed higher expression in XX compared with XY. Deletion of
Kdm6a
in CD4
+T cells ameliorated clinical disease and reduced neuropathology in the
classic CD4
+T cell–mediated autoimmune disease experimental autoimmune
encephalomyelitis (EAE). Global transcriptome analysis in CD4
+T cells from EAE mice
with a specific deletion of
Kdm6a
showed upregulation of Th2 and Th1 activation pathways
and downregulation of neuroinflammation signaling pathways. Together, these data
demonstrate that the X escapee
Kdm6a
regulates multiple immune response genes,
providing a mechanism for sex differences in autoimmune disease susceptibility.
Research Article
Autoimmunity
Genetics
Find the latest version:
The Journal of Clinical Investigation
R E S E A R C H A R T I C L E
Introduction
Multiple sclerosis (MS) is a putative T cell–mediated autoimmune disease of the CNS. The etiology of MS is not completely under-stood, although genetic and environmental factors have been proposed (1, 2). Activated T lymphocytes in the peripheral blood of MS patients pass through the blood-brain barrier (BBB) to infiltrate the CNS, in turn activating resident microglia and astrocytes, resulting in white matter lesions characterized by inflammation, demyelination, and axonal damage. For many autoimmune diseases, females are more susceptible than males. In MS, the ratio of females to males is approximately three to one, and more robust immune responses have been shown in women compared with men (3–6). Based on investigations using mouse models, sex differences in autoimmune diseases can be caused by differences in sex hormones (estrogen vs. testosterone), sex chromosomes (XX vs. XY), or both (6–10). How differences in sex chromosomes contribute to sex differences in autoimmune dis-eases remains unclear.
In mammals, females (XX) have 2 copies of X genes, while males (XY) have only 1 copy. This 2-fold difference in genomic dose of X chromosome genes could potentially be deleterious. However, in females, this dosage difference is compensated for
by random inactivation of 1 X chromosome, resulting in simi-lar expression levels of X genes in both sexes (11). Kdm6a (lysine demethylase 6A, also known as Utx) is an X-linked gene, but unlike the majority of X genes, it escapes from X inactivation, potentially leading to higher expression of Kdm6a in immune cells of females as compared with males (12–15).
Histone demethylase KDM6A specifically mediates the removal of repressive trimethylation on histone H3 lysine 27 (H3K27me3) to expose a region of chromatin for transcription. KDM6A associates with the methyltransferase KMT2D in the same protein complex (16), and KMT2D adds the activating H3 lysine 4 (H3K4me3) histone mark (17). As a result, this complex activates gene expression by histone modifications that make the chromatin transcriptionally permissive in a cell lineage–specific way (18, 19). Whether sexually dimorphic expression of Kdm6a could be a causal factor in the female predominance of auto-immune diseases is unknown.
In this study, we examined Kdm6a expression in CD4+ T lym-phocytes of female versus male mice, as well as in XX versus XY mice of the four core genotypes (FCG) model (20, 21). Then, the role of Kdm6a in autoimmune disease was determined by deleting Kdm6a in CD4+ T cells to ascertain the effect on the classic CD4+ T cell–mediated autoimmune disease experimental autoimmune encephalomyelitis (EAE), with subsequent global transcriptome analysis in mice devoid of Kdm6a in CD4+ T cells.
Results
Females (XX) have higher expression of Kdm6a RNA. Previously, we used the FCG model to show that XX mice were more susceptible than XY, irrespective of gonadal type, to both EAE and lupus (6, 8), Multiple sclerosis (MS) is a putative T cell–mediated autoimmune disease. As with many autoimmune diseases, females
are more susceptible than males. Sexual dimorphisms may be due to differences in sex hormones, sex chromosomes, or both. Regarding sex chromosome genes, a small percentage of X chromosome genes escape X inactivation and have higher expression in females (XX) compared with males (XY). Here, high-throughput gene expression analysis in CD4+ T cells showed that the top sexually dimorphic gene was Kdm6a, a histone demethylase on the X chromosome. There was higher expression of Kdm6a in females compared with males in humans and mice, and the four core genotypes (FCG) mouse model showed higher expression in XX compared with XY. Deletion of Kdm6a in CD4+ T cells ameliorated clinical disease and reduced neuropathology in the classic CD4+ T cell–mediated autoimmune disease experimental autoimmune encephalomyelitis (EAE). Global transcriptome analysis in CD4+ T cells from EAE mice with a specific deletion of Kdm6a showed upregulation of Th2 and Th1 activation pathways and downregulation of neuroinflammation signaling pathways. Together, these data demonstrate that the X escapee Kdm6a regulates multiple immune response genes, providing a mechanism for sex differences in autoimmune disease susceptibility.
The X-linked histone demethylase
Kdm6a
in CD4
+
T lymphocytes modulates autoimmunity
Yuichiro Itoh,1 Lisa C. Golden,1,2 Noriko Itoh,1 Macy Akiyo Matsukawa,1 Emily Ren,1 Vincent Tse,1 Arthur P. Arnold,3
and Rhonda R. Voskuhl1
1Department of Neurology, David Geffen School of Medicine, UCLA, Los Angeles, California, USA. 2Molecular Biology Institute, UCLA, Los Angeles, California, USA. 3Department of Integrative Biology and
Physiology, UCLA, Los Angeles, California, USA.
Related Commentary: p. 3536
Conflict of interest: The authors have declared that no conflict of interest exists. Copyright: © 2019, American Society for Clinical Investigation.
Submitted: November 19, 2018; Accepted: June 11, 2019; Published: August 12, 2019. Reference information: J Clin Invest. 2019;129(9):3852–3863.
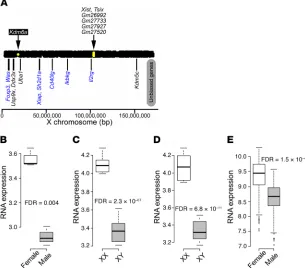
Expression Omnibus database [GEO] GSE94671) (Figure 1, A and B, and Supplemental Figure 1A; supplemental material available online with this article; https://doi.org/10.1172/JCI126250DS1). This sex difference of KDM6A gene expression was confirmed in human naive CD4+ T cells (Figure 1E). That other genes thought to escape X inactivation do not appear when comparing female versus male CD4+ T cell data sets may be due to a variety of factors, such as the tissue type, cell type, or hormonal status (28).
We then used the FCG mouse model (20, 21), which allows comparison of XX and XY‾ mice of the same gonadal sex (Y‾ denotes lack of the testis-determining Sry gene on the Y chromo-some). In addition, XX and XY‾ gonadal females were ovariectomized to remove activational effects of ovarian hormones. In autoantigen-stimulated CD4+ T cells from C57BL/6J and SJL mice, there was higher expression of Kdm6a and Kdm5c in XX compared with XY‾ mice (Figure 1, C and D, and Supplemental Figure 1, B and C). In contrast, other genes thought to escape X inactivation, namely, Ddx3x, Eif2s3x, Uba1, and Usp9x, were not differentially expressed between XX and XY‾ CD4+ T cells (Supplemental Figure 1, B and C).
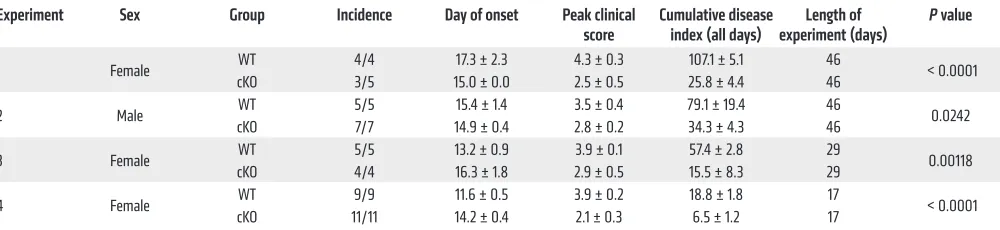
cKO mice are protected from EAE. Since Kdm6a was the most differentially expressed X escapee, we next investigated to determine whether Kdm6a expression in CD4+ T cells influ-ences autoimmune disease. We crossed mice containing homozygous floxed Kdm6a alleles with mice expressing Cre under the CD4 pro-moter to produce a conditional KO of Kdm6a only in CD4+ T cells (cKO). Deletion of Kdm6a in CD4+ T cells was confirmed with genomic PCR (Figure 2A). As expected, expression of Kdm6a was decreased in cKO compared with WT in the CD4+ T cells from EAE mice that were stimu-lated with autoantigen (Figure 2B, FDR = 0.07). To examine the functional significance of Kdm6a expression in CD4+ T cells on disease, active EAE was induced in female cKO and WT (littermate controls; CD4-Cre negative) mice (Figure 2C). EAE clinical scores of cKO mice were lower than those in WT mice (P < 0.0001), demonstrating that deletion of Kdm6a in CD4+ T cells was protective. This protective effect of Kdm6a deletion in CD4+ T cells was further confirmed with 3 additional EAE experiments, including 1 experiment in males (Table 1). Together, these data show that the presence of Kdm6a in CD4+ T cells is disease promoting in the classic CD4+ T cell– mediated autoimmune disease EAE.
Consistent with an amelioration of clinical EAE scores, immunohistochemistry of spinal cord white matter showed a reduction of CD3+ T lymphocytes and Iba1+ globoid macro-phages in cKO compared with WT mice (Figure 2, D and E). Assessment of neurodegeneration in spinal cord white matter showed reduction of βAPP+ injured axons and an increase in indicating that a sex difference in X and/or Y gene expression can
[image:3.585.45.350.61.329.2]contribute to the sex difference in autoimmune diseases. Here, we focused on X genes over Y genes because of the much higher gene content of the X chromosome, including genes related to immune function, as compared with the Y chromosome, which during evo-lution has lost many genes not related to reproduction. First, we determined which X genes have sexually dimorphic gene expres-sion in CD4+ T lymphocytes. Since the majority of X genes are ran-domly inactivated, here we focused on genes that escape X inac-tivation (X escapees). Possible sex differences in RNA expression of 6 known X escapees in mice (Ddx3x, Eif2s3x, Kdm5c, Kdm6a, Uba1, and Usp9x) (22–27) were examined in CD4+ T cells using high-throughput RNA-Seq data sets. In C57BL/6J naive CD4+ T cells, expression of the Kdm6a gene was higher in females than in males and Kdm5c showed a trend of difference, while the other 4 X escapees were not significantly different (NCBI’s Gene
Figure 1. Differentially expressed X chromosome genes in mouse CD4+ T cells. (A) Using
the high-throughput sequencing approach, sexually biased X chromosome genes in CD4+ T
cells were determined for C57BL/6J naive CD4+ T cells from spleen (GSE94671; 3 males and
3 females). Yellow dots within the bar representing the X chromosome indicate genes with higher expression in females than in males (threshold for significance was FDR < 0.1). Kdm6a showed increased expression in CD4+ T cells from females as compared with males. Xist and
Tsix, which regulate X inactivation, and 4 predicted genes with unknown functions (Gm26992, Gm27733, Gm27927, and Gm27520) also showed increased expression in females. Shown below the bar representing the X chromosome are previously reported X escapees found in other tissues (black text) as well as X genes not thought to escape X inactivation, but involved in immunity (blue text) (58, 59). None had significantly different expression. (B–E) Expression of Kdm6a in (B) naive CD4+ T cells from C57BL/6J spleen (GSE94671; 3 males and 3
females); (C) stimulated CD4+ T cells from C57BL/6J lymph nodes (GSE121292; FCG: 6 XX and
6 XY‾); (D) stimulated CD4+ T cells from SJL lymph nodes (GSE121705; FCG: 6 XX and 5 XY‾);
and (E) human naive CD4+ T cells from healthy control blood (GSE56033; 205 males and 294
The Journal of Clinical Investigation
[image:4.585.37.439.56.709.2]R E S E A R C H A R T I C L E
Figure 2. Deletion of Kdm6a in CD4+ T cells protects
mice from EAE. (A) Genomic PCR for isolated CD4+ T cells
from EAE mice showed successful deletion of Kdm6a in cKO mice homozygous for the KO allele. (B) In cKO mice, RNA expression of Kdm6a was downregulated in CD4+ T
cells. RNA expression levels of Kdm6a were graphed with log2-transformed TPM normalization. In box-and-whisker plot, thick lines inside the boxes represent the median of the data. The lower and upper ends of boxes show quan-tiles (25% and 75%), and whiskers show the minimum and maximum values. FDR was calculated using edgeR. (C) cKO mice showed decreased EAE severity scores compared with WT littermates. n = 4 WT; n = 5 cKO. P < 0.0001, repeated measures 1-way ANOVA. Additional EAE experiments are shown in Table 1. (D) Representative ×10 images of the ventral spinal cord of EAE in WT and cKO stained with antibodies for CD3 (green), Iba1 (red), βAPP (red), and NF200 (red) costained with DAPI (blue). Scale bars: 100 μm. (E) Dot plots show a decrease in cKO for CD3+ cell count (P = 0.03276), globoid Iba1+ cell count
(P = 0.02593), and βAPP+ percentage area for axonal
dam-age (P = 0.01207), and show an increase in cKO for NF200+
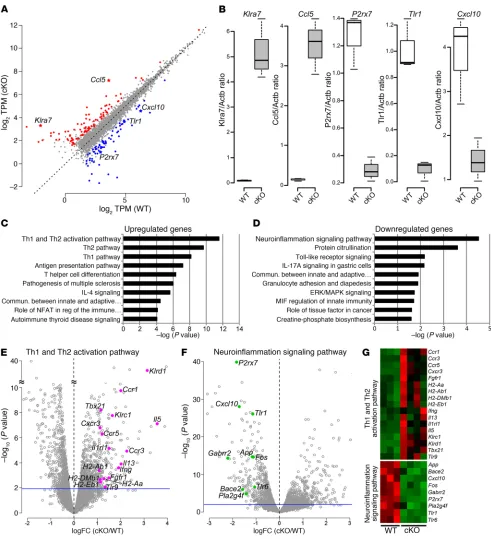
the other hand, the top pathway for downregulated genes was the neuroinflammation signaling pathway (Figure 3D). Differentially expressed genes in the top up- and downregulated pathways were visualized for their fold changes (x axis, logFC) and significance levels (y axis, –log10[P value]) using volcano plots (Figure 3, E and F, respectively). A heatmap shows differential expression of indi-vidual genes within top pathways in CD4+ T cells from Kdm6a cKO versus WT mice (Figure 3G).
Deletion of Kdm6a affects the transcriptome in CD4+ T cells in
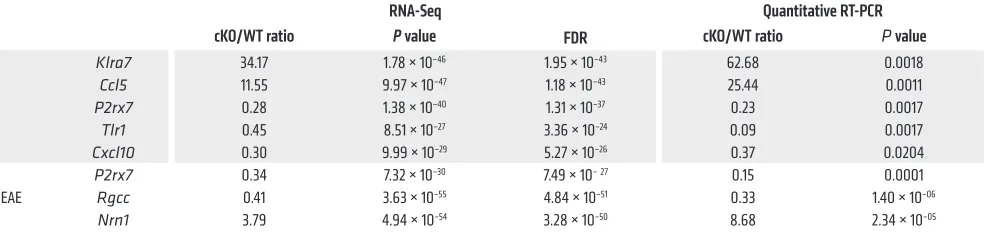
healthy mice. CD4+ T cells from healthy (non-EAE) mice were stim-ulated with anti-CD3/CD28 antibodies, followed by RNA-Seq. Expression differences of 3 genes were validated with quantitative RT-PCR using an independent set of samples (Table 2). Approxi-mately 70% of differentially expressed genes in the healthy group showed small fold changes (–0.5 < logFC < 0.5); thus differences between Kdm6a cKO and WT mice were less robust in healthy mice than differences observed in EAE mice (Supplemental Fig-ure 3, A and B). We then performed pathway analysis for RNA-Seq data from healthy mice. We used the same filtration threshold (FDR < 0.1, logCPM > 1, logFC > 1 or logFC < –1) as described for EAE data. However, in order to have enough genes to perform pathway analysis in the healthy group, we assessed enrichment of all genes in the cKO group (both up- or downregulated). Gene expression changes in the pathways shown in Supplemental Fig-ure 3, C and D, show enrichment of both up- and downregulated pathways in cKO compared with WT in healthy mice. In both healthy and EAE mice, Th1 and Th2 cell–related pathways were top enriched pathways, although the enrichment in healthy mice was less robust than in EAE. We then compared the differentially expressed genes in cKO versus WT that were in common between healthy and EAE mice (Supplemental Figure 3E). The majority of differentially expressed genes changed in the same directions in both healthy and EAE mice; however, a small number of genes showed changes in opposite directions (Supplemental Figure 3E).
Deletion of Kdm6a decreases CD44 expression in CD3+CD4+ T
cells in healthy mice. To ascertain whether the conditional KO of Kdm6a in CD4+ cells changed the composition of T cell subpop-ulations, we examined T cell populations in spleens from healthy (non-EAE) cKO and WT mice. While the percentage of CD3+ cells was unchanged, CD3+CD4+ T cells were decreased, while NF200+ intact axons, each as compared with those in WT
litter-mates (Figure 2, D and E).
Since CD4-Cre deletion of Kdm6a could affect CD4+CD8+ cells during thymic development of CD8+ cells, CD8+ T cells were isolated and assessed for whether Kdm6a was deleted. Indeed, Kdm6a was deleted in CD8+ T cells as well (Supplemental Figure 2). This warrants further study of CD8+ T lymphocytes in EAE, but here we focused on CD4+ T lymphocytes in EAE.
Deletion of Kdm6a changes the transcriptome in CD4+ T cells in
EAE mice. We next investigated downstream genes regulated by Kdm6a in CD4+ T cells. We induced EAE in cKO mice and their WT littermate controls. On EAE day 17, lymph node cells were isolated and cultured with autoantigen before CD4+ T cell sort-ing. Whole-transcriptome analyses for CD4+ T cells from cKO and WT mice with EAE were performed using RNA-Seq. Princi-pal component analysis of the transcriptomes showed clear sep-aration of cKO and WT genotypes (data not shown). We found that 1728 genes were significantly different between cKO mice and WT controls (FDR < 0.1; Supplemental Table 1): 859 genes were upregulated, and 869 genes were downregulated in cKO cells. Within these 1728 differentially expressed genes, 531 genes showed more than 2-fold difference: 349 upregulated and 182 downregulated genes (Figure 3A). Expression differences of sev-eral genes were validated with quantitative reverse-transcription PCR (RT-PCR) using an independent set of cKO and WT mice to generate samples (Figure 3B and Table 2).
[image:5.585.44.544.82.197.2]To determine the biological relevance of differentially expressed genes between cKO and WT mice, canonical pathway analysis was performed. Genes with low expression were elim-inated from this analysis using an additional threshold of log2 scale counts per million greater than 1 (FDR < 0.1, logFC > 1 or logFC < –1, logCPM > 1), with the remaining 364 differentially expressed genes proceeding to pathway analysis (235 up- and 130 downregulated genes). Figure 3 shows the top 10 enriched canonical pathways for upregulated (Figure 3C) and downregu-lated (Figure 3D) genes, with levels of significance of enrichment in each pathway represented by –log(P value). The top pathway for upregulated genes in CD4+ T cells of mice with a selective deletion of Kdm6a, as compared with WT, was the Th1 and Th2 activation pathway, with the Th2 pathway second (Figure 3C). On Table 1. EAE scores for WT and Kdm6a cKO mice
Experiment Sex Group Incidence Day of onset Peak clinical
score Cumulative disease index (all days) experiment (days)Length of Pvalue
1 Female WT 4/4 17.3 ± 2.3 4.3 ± 0.3 107.1 ± 5.1 46 < 0.0001
cKO 3/5 15.0 ± 0.0 2.5 ± 0.5 25.8 ± 4.4 46
2 Male WT 5/5 15.4 ± 1.4 3.5 ± 0.4 79.1 ± 19.4 46 0.0242
cKO 7/7 14.9 ± 0.4 2.8 ± 0.2 34.3 ± 4.3 46
3 Female cKOWT 5/54/4 13.2 ± 0.916.3 ± 1.8 2.9 ± 0.53.9 ± 0.1 57.4 ± 2.815.5 ± 8.3 2929 0.00118
4 Female cKOWT 11/119/9 11.6 ± 0.514.2 ± 0.4 3.9 ± 0.22.1 ± 0.3 18.8 ± 1.86.5 ± 1.2 1717 < 0.0001
A protective effect of Kdm6a deletion in CD4+ T cells was observed in 4 independent EAE experiments. Experiments 1 (shown in Figure 2B) and 2 were
The Journal of Clinical Investigation
[image:6.585.43.534.53.592.2]R E S E A R C H A R T I C L E
Figure 3. Differences in Th1/Th2 activation and neuroinflammation signaling pathways in CD4 Kdm6a KO mice. (A) Scatterplot shows upregulated (red) and downregulated (blue) genes in CD4+ T cells in cKO as compared with WT. Differentially expressed genes were identified with edgeR (FDR < 0.1, logFC >
1 or logFC < –1, logCPM > 1). Other genes filtered out with this threshold are shown as gray dots. (B) The expression difference of 5 genes was validated with RT- PCR using biological replicates of 3 WT and 3 cKO: increased in cKO (Klra7: P = 0.0018, Ccl5: P = 0.0012), decreased in cKO (P2rx7: P = 0.0017, Tlr1: P = 0.0017, Cxcl10: P = 0.0204, t tests). In box-and-whisker plots, thick lines inside boxes represent the median of the data. Lower and upper ends of boxes show quantiles (25% and 75%), and whiskers show minimum and maximum values. P values were determined by t test. (C and D) Top 10 canonical pathways for the differentially expressed genes between WT and cKO CD4+ T cells. Significantly expressed genes (FDR < 0.1, logCPM > 1) were classified into 2 groups, and
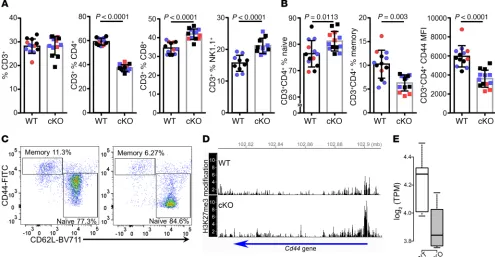
CD3+CD8+ T cells and CD3+NK1.1+ cells were each increased in the cKO compared with WT (Figure 4A). There was no difference in CD4+CD25+FOXP3+ T regulatory cells between WT and cKO (not shown, WT, 11.51% ± 0.2700%, cKO, 10.91% ± 0.2270%, P = 0.1075, t test). We further characterized T cells in Kdm6a cKO mice by analyzing the populations of naive and memory CD3+CD4+ T cells. The naive CD3+CD4+ population was increased, while the memory CD3+CD4+ population was decreased in the cKO com-pared with the WT (Figure 4B). Also, within the CD3+CD4+ T cell population, there was a decrease in CD44 expression in the cKO as measured by MFI (Figure 4, B and C). Together, these results were consistent with a shift toward more naive and fewer memory T cells in the cKO as compared with WT.
To ascertain whether the decreased expression of CD44 in CD3+CD4+ T cells from cKO mice could be due to direct effects of KDM6A’s histone demethylase activity on the Cd44 gene, we examined H3K27me3 ChIP-Seq data from CD4 Kdm6a cKO mice (GSE70795) and found more H3K27me3 modification near the transcriptional start site of the Cd44 gene in the cKO compared with WT (Figure 4D), suggesting direct regulation of Cd44 expres-sion by KDM6A. Further, we analyzed the expresexpres-sion of Cd44 mRNA in healthy WT versus cKO CD4+ T cells stimulated with anti-CD3/CD28 antibodies and found lower expression of Cd44 in the cKO as compared with WT (Figure 4E). These results are con-sistent with previous reports that CD44 depletion promotes a Th2 phenotype upon stimulation (29), with decreased IL-2 production (30) and decreased T cell–mediated inflammatory responses in several animal models, including EAE (31).
Influence of Kdm6a on CD4+ T cell proliferation and cytokine
production. We assessed proliferation of naive CD4+ T cells stim-ulated with anti-CD3/CD28. The proliferation index was no dif-ferent between WT and cKO, but the division index was lower in the cKO (Figure 5, A and B) and the percentage of undivided cells was higher in the cKO, each as compared with WT (Fig-ure 5, C–E). Next, we determined whether the cKO of Kdm6a affects cytokine levels. In healthy CD4+ T cells stimulated with anti-CD3/CD28, there was a decrease in IL-2 and IL-17A, and an increase in IFN-γ, in the cKO compared with WT, while IL-5 was no different between the two (Figure 5F). Finally, when we ana-lyzed cytokine production from lymph node cell cultures of EAE
mice stimulated with autoantigen (Figure 5G), again there was a decrease in IL-2 and IL-17A in the cKO. However, in EAE, there was also a decrease in IFN-γ as well as an increase in IL-5. This was consistent with RNA-Seq data showing a shift to more of a Th2 phenotype during EAE.
Discussion
We hypothesized that an X chromosome gene that escapes X inac-tivation would have higher expression in females and may contrib-ute to the sex difference in autoimmune disease susceptibility. By analyzing several high-throughput RNA-Seq data sets, we iden-tified Kdm6a as the top sexually dimorphic gene that escapes X inactivation in CD4+ T cells in humans and mice. When Kdm6a was deleted in CD4+ T cells, EAE was ameliorated. Further, the CD4+ T cell transcriptome was altered. High-throughput RNA-Seq and canonical pathway analysis showed upregulation of T helper cell–related pathway genes and downregulation of neuroinflam-mation pathway genes. Since the expression of Kdm6a in CD4+ T cells is disease promoting in EAE, higher expression of Kdm6a from 2 alleles in females is consistent with increased female sus-ceptibility to MS.
Since Kdm6a is an X-linked gene, there are 2 copies of Kdm6a in females (XX) and 1 copy in males (XY). In males, the Y chro-mosome has a homologous gene, Uty, that evolved from the same ancestor as the Kdm6a gene; however, the functionality of the UTY protein is controversial. It was suggested that there was no histone demethylase activity of UTY (18, 32–35). On the other hand, Walport et al. reported that UTY possesses histone demeth-ylase activity, albeit with lower activity than that of KDM6A (36). Thus, UTY function in EAE may be similar to that of KDM6A, but the effect of UTY may be of a lesser degree. While mechanisms for balance and compensation between the sexes occur, absolute balance is often not the case (37). Also, a difference in the overall histone methylation state between males and females would not merely reflect sexually dimorphic expression of histone demethy-lases. For example, histone demethylases, as well as other histone modifiers, play a role in X inactivation in females, but not males.
[image:7.585.55.547.84.202.2]KDM6A is a histone modifier that affects whole genome expression by removing the suppressive histone mark H3K27me3. Removal of H3K37me3 increases expression of genes regulated Table 2. Validation of RNA-Seq results using quantitative RT-PCR in samples from EAE and non-EAE (healthy) mice
RNA-Seq Quantitative RT-PCR
cKO/WT ratio Pvalue FDR cKO/WT ratio P value
EAE
Klra7 34.17 1.78 × 10–46 1.95 × 10–43 62.68 0.0018
Ccl5 11.55 9.97 × 10–47 1.18 × 10–43 25.44 0.0011
P2rx7 0.28 1.38 × 10–40 1.31 × 10–37 0.23 0.0017
Tlr1 0.45 8.51 × 10⁻²⁷ 3.36 × 10⁻²⁴ 0.09 0.0017
Cxcl10 0.30 9.99 × 10⁻²⁹ 5.27 × 10⁻²⁶ 0.37 0.0204
non-EAE
P2rx7 0.34 7.32 × 10⁻³⁰ 7.49 × 10⁻²⁷ 0.15 0.0001
Rgcc 0.41 3.63 × 10–55 4.84 × 10–51 0.33 1.40 × 10–06
Nrn1 3.79 4.94 × 10–54 3.28 × 10–50 8.68 2.34 × 10–05
The Journal of Clinical Investigation
R E S E A R C H A R T I C L E
by this mark. Therefore, by deleting Kdm6a, the H3K27me3 mark remains and the expression of target genes is lowered. In our RNA-Seq data comparing cKO and WT, we observed both up- and downregulated genes in the cKO, which indicates that Kdm6a deficiency in CD4+ T cells has both direct (downregulation) and indirect (upregulation) effects. Genes that are upregulated in response to Kdm6a deletion may include an intermediate gene, such that KDM6A directly regulates a gene that inhibits expression of the target gene.
The most enriched pathways upregulated in cKO CD4+ T cells were the Th1 and Th2 activation pathway, followed by the Th2 pathway. Downregulated pathways included neuroinflammation signaling, Toll-like receptor signaling, and IL-17 signaling. This is consistent with EAE being a Th1/Th17-mediated disease. At the single gene level, the Th2 cytokine, Il5, had increased RNA expression in CD4+ T cells in the cKO. While a Th1 chemokine receptor, Cxcr3, had higher expression in cKO CD4+ T cells, there was a decrease of the CXCR3 ligand Cxcl10 in the cKO. The mas-ter Th17 transcription factor Rorc was also downregulated in cKO CD4+ T cells. Together, these data show broad immunomodula-tion in cKO mice with consistent alteraimmunomodula-tion in histone modifica-tion across the genome in mice with a specific delemodifica-tion of Kdm6a in CD4+ T cells in EAE.
KDM6A has a JmjC domain that is evolutionarily conserved in the jumonji family of transcription factors and has a function in the histone demethylation mechanism. KDM6A and other JmjC domain–containing proteins are known to play a role in the immune response (38). In macrophages, knockdown of Kdm6a inhibited the production of IL-6 and IFN-β, and the regulation of IL-6 production was JmjC domain dependent (39). Another JmjC domain–containing protein, JMJD3 (also known as KDM6B), which is an autosomal paralog of Kdm6a, regulates CD4+ T cell differentiation. Deletion of Jmjd3 promoted Th2/Th17 differenti-ation in the small intestine and colon and suppressed Th1 differ-entiation (40). In an in vitro differdiffer-entiation experiment of CD4+ T cells from spleen and lymph node, Jmjd3 deficiency selectively reduced Th17 differentiation. Additionally, cKO of Jmjd3 in CD4+ T cells reduced EAE disease severity, likely due to decreased Th17 differentiation (41). Furthermore, another JmjC protein fam-ily gene, Mina (also called Riox2), binds to the Il4 promoter and represses its expression, modulating Th2 differentiation (42).
[image:8.585.36.531.60.317.2]Recently, KDM6A was identified as the molecular target of metformin. Metformin is an FDA-approved drug for the treatment of diabetes; it inhibits the histone demethylase activity of KDM6A to increase the global level of H3K27me3 histone modifications (43). Thus, in the context of this study, metformin could be viewed Figure 4. A shift toward a naive phenotype in CD3+CD4+ T cells from Kdm6a cKO as compared with WT healthy mice. Spleens were collected from
healthy female WT and Kdm6a cKO mice for flow cytometry analysis of single-cell suspensions in 3 separate experiments (Exp1, red; Exp2, purple; Exp3, black). (A) There was no significant difference in the percentage of CD3+ cells. However, there was a decrease in CD3+CD4+ and an increase in CD3+CD8+
and CD3+NK1.1+ T cells in the cKO. (B) Within the CD3+CD4+ population, there was an increase in naive T cells (CD44loCD62Lhi), a decrease in memory T cells
(CD44hiCD62Llo), and a decrease in CD44 MFI in the cKO. P values were calculated by unpaired 2-tailed t test. Error bars represent SD. (C) Representative
dot plots show CD3+CD4+ naive and memory T cell populations in WT (left) and cKO (right). (D) cKO mice have more repressive H3K27me3 modifications on
Cd44 compared with WT. ChIP-Seq data for H3K27me3 modification in mature CD4 single-positive thymocytes from WT and cKO were obtained from the GEO database (GSE70795; ref. 38). Without Kdm6a (cKO), the amount of H3K27me3 modification was increased around the transcription start site. (E) In healthy CD4+ T cells, RNA expression of Cd44 was downregulated in cKO (FDR = 0.009, edgeR), consistent with the increase of repressive histone marks,
and 5 XY‾) were obtained from the GEO database. R package QuasR (47) was used for the read alignment to the mouse genome (mm10) followed by counting at the gene level. Significance of differences between male and female (or XX and XY‾) mice was determined using R package edgeR (48). FDR of 0.1 was used as the threshold of differentially expressed genes.
A microarray data set for human naive CD4+ T cells from healthy controls (GSE56033; 205 males and 294 females) was obtained from the GEO database. Statistical analyses and production of figures were performed in R (R Core Team, 2018, http://www.R-project. org/). The microarray data sets were quantile normalized before running any analysis. Differentially expressed genes were identified using 1-way ANOVA.
Animals. Mice of the FCG model were generated from males
lack-ing the testis-determinlack-ing Sry gene on the Y chromosome, called the Y‾ chromosome, but with an Sry transgene on chromosome 3 (20). XY‾
mice (gonadal females) were compared with XX (gonadal females) to assess the effect of XX vs. XY sex chromosomes in mice without a con-found of differences in gonadal hormones (49). Conditionally targeted
Kdm6a mice were generated from “KO-first” mice containing the
allele Kdm6atm2a(EUCOMM)Wtsi (50–52). To remove the lacZ reporter cas-sette and generate a floxed Kdm6a allele, KO-first Kdm6a mice were crossed with B6.129S4-t(ROSA)26Sortm1(FLP1)Dym/RainJ mice (Jack-son Laboratory), which have global expression of the FLP1 recom-binase, including expression in germline cells. This cross generated
Kdm6afl/WT mice with 1 floxed Kdm6a allele and 1 WT allele. Kdm6afl/WT
XX mice were backcrossed onto the C57BL/6J background for at least 13 generations. Then, Kdm6afl/fl female mice were crossed with
as a pharmacologic Kdm6a knockdown that is not cell specific. Metformin has been used in EAE studies in which it attenuated clinical disease scores and was immunomodulatory (44, 45). This supports our finding that deficiency of Kdm6a in CD4+ T cells is protective in EAE. While our study shows cell specificity, both studies support an important role of Kdm6a in EAE. Thus, met-formin as a treatment for MS warrants investigation. Consistent with the importance of sex as a biological variable in therapeutic dosing, since Kdm6a is an X chromosome gene that has higher expression in females, the effective dose of metformin in MS may be different in females versus males.
Previous research indicated that sex differences in the MS mouse model EAE are caused both by gonadal hormones and by sex chromosomes. In this study, we determined the role of the X inactivation escapee gene Kdm6a in this sex difference. Kdm6a in CD4+ T cells plays a disease-promoting role in EAE and is immuno-modulatory. Thus, expression of KDM6A from 2 alleles in women versus 1 allele in men may contribute to the higher susceptibility of women to MS. Modulation of KDM6A in CD4+ T cells is a therapeu-tic target for MS and potentially other autoimmune diseases with a female preponderance (46).
Methods
High-throughput gene expression analysis for X chromosome genes.
[image:9.585.52.509.57.380.2]RNA-Seq data sets for C57BL/6J naive CD4+ T cells from spleen (GSE94671; 3 males and 3 females), C57BL/6J stimulated CD4+ T cells from lymph nodes (GSE121292; FCG: 6 XX and 6 XY‾), and SJL stimulated CD4+ T cells from lymph nodes (GSE121705; FCG: 6 XX
Figure 5. T cell proliferation and cytokine production in
Kdm6a cKO and WT mice. (A–E) Healthy female CD4+ T
cells from WT (n = 5) and cKO (n = 5) mice were stained with CFSE and then cultured with anti-CD3/CD28 for 4 days, followed by flow cytometric analysis. (A) The proliferation index was similar between WT and cKO CD4+ T cells. (B) The
division index of cKO CD4+ T cells was lower than that of
WT. (C) There was a higher percentage of undivided CD4+ T
cells in cKO than WT. (D-E) Representative CFSE histograms of viable CD4+ T cells in WT (D) and cKO (E). (F) Healthy
female CD4+ T cells from WT (n = 5) and cKO (n = 5) were
The Journal of Clinical Investigation
R E S E A R C H A R T I C L E
as well as from female EAE day 29 lymph node cultures stimulated with autoantigen were analyzed for cytokine production using the Mouse Th1/Th2/Th17 Cytokine Kit (catalog 560485, BD Biosciences) and the Mouse IL-5 Flex Set (catalog 558302, BD Biosciences) following the manufacturer’s instructions. Samples were run in duplicate, and the average for each sample was reported. Data were analyzed on a SORP BD LSRII Analytic Flow Cytometer using BD FACSDiva 8.0 and FCAP Array Software (version 3.0, BD Biosciences).
Immunofluorescence staining. After exposure to a lethal dose of
isoflurane and subsequent lymph node collection, the mice were per-fused transcardially with ice-cold 1× PBS for 8–15 minutes, followed by ice-cold 10% buffered formalin for 10 to 15 minutes. Spinal cords were dissected and submerged in 10% buffered formalin overnight at 4°C, followed by 30% sucrose in 1× PBS for 24 hours. Tissues were embed-ded in 75% gelatin/15% sucrose solution for cryostat sectioning, then post-fixed overnight in 10% buffered formalin and cryoprotected in 30% sucrose. The embedded tissues were flash frozen in dry ice and stored at –80°C. Tissues were cryosectioned at –25°C into 40 μm thick sections using a cryostat (Leica CM1860) and stored in 1× PBS with 0.1% sodium azide at 4°C before immunofluorescence staining.
Thoracic spinal cord sections were washed thoroughly using 1× PBS to remove residual sodium azide. Tissue sections were incubated with 5% glacial acetic acid, 95% ethanol solution for 15 minutes at room temperature (RT) and then washed with 1× PBS before block-ing. For blocking, tissues were incubated in blocking solution (10% goat serum, 0.1% Tween 20) for 1 hour at RT. Primary and secondary antibody stainings were done at appropriate concentrations with 2% NGS, 1× PBS with 0.1% Tween-20 (1× PBST) overnight at 4°C and 2 hours at RT, respectively. After serial washes, sections were mounted onto slides (SuperfrostPlus, VWR), allowed to semidry, and covers-lipped (Fisher Scientific) with Fluoromount-G (SouthernBiotech) for confocal microscopy as described (56). The following primary anti-bodies were used: rabbit anti-NF200 (Sigma Aldrich, catalog N4142, 1:250), rabbit anti-βAPP (Life Technologies, catalog 51-2700, 1:200), rabbit anti-Iba1 (Wako Chemicals, catalog 019-19741, 1:1000), and rat anti-CD3 (BD Pharmingen, catalog 555273, 1:750). The follow-ing secondary antibodies were used: goat anti-rabbit IgG-cy5 con-jugated (Invitrogen, catalog A32733, 1:500), goat anti–rat IgG-cy3 conjugated (Jackson Immunoresearch Laboratories Inc., catalog 112-165-167, 1:500).
Quantification of immunostaining results was performed on 3 sec-tions of spinal cord (levels T1–T5) per animal. Images of immunostained sections were obtained using an OlympusBX51 fluorescence microscope with a DP50 digital camera, and 10× images were taken at 8 to 10 μm thickness with 2 μm stacks. Identical light intensity and exposure times were applied to all photographs from each set, and images were processed using the integrated software program Slidebook4.2 (Intelligent Imaging Innovations). ImageJ (NIH) was used for image analysis. The images for NF200 and βAPP were converted to binary images with fixed threshold and analyzed for the area fraction in ventral white matter of spinal cord. Globoid Iba1+ cells and CD3+ cells were each manually counted in ven-tral white matter, and the number was normalized by averaging with area size. All analyses were done in a blinded fashion.
RNA isolation, high-throughput sequencing, and statistical anal-ysis. RNA purification was performed using the Direct-zol RNA
MicroPrep Plus Kit following the manufacturer’s instructions (Zymo Research). The RNA-Seq library was made using the KAPA Stranded B6.Cg-Tg(CD4-cre)1Cwi/BfluJ (Jackson Laboratory) male mice to
generate CD4-Cre+/–-Kdm6afl/fl female mice. CD4-Cre+/–-Kdm6afl/fl
female mice were then crossed with Kdm6afl/y males to generate
CD4-Cre+/–-Kdm6afl/fl females, CD4-Cre+/–-Kdm6afl/y males, and their
litter-mate controls without CD4-Cre (CD4-Cre–/–). These mice were used for the experiments in this study.
Active EAE induction. cKO mice and WT littermate C57BL/6 mice
were induced with active EAE using standard methods for induction of disease with myelin oligodendrocyte glycoprotein (MOG) amino acids 35–55 peptide (MOG35–55) (53). Briefly, EAE was induced in female and male mice at 12 to 16 weeks of age by subcutaneous injec-tion of MOG35–55 (200 μg/animal, Mimotopes) emulsified in CFA sup-plemented with mycobacterium tuberculosis H37Ra (200 μg/animal, Difco Laboratories) over 2 sites drained by left inguinal and auxiliary lymph nodes on day 0 (0.1 ml/mouse). A booster immunization was applied subcutaneously on day 7 over contralateral lymph nodes. Per-tussis toxin (500 ng/mouse) (List Biological Laboratories) was injected intraperitoneally on days 0 and 2 (54). The animals were monitored daily and scored based on a standard EAE 0–5 scale scoring system: 0, healthy; 1, complete loss of tail tonicity; 2, loss of righting reflex; 3, partial paralysis; 4, complete paralysis of one or both hind limbs; and 5, premoribund state, as described (55). EAE scores were performed blinded for cKO versus WT status.
CD4+ T cell or CD8+ T cell isolation. Mice were euthanized with a
lethal dose of isoflurane. Auxiliary, brachial, and inguinal draining lymph nodes were collected from female (CD4+) and male (CD8+) WT and Kdm6a cKO EAE mice (8 to 12 weeks old) and passed through 40
μm cell strainers to obtain single-cell suspensions. Lymphocytes were isolated via Lymphoprep density gradient (Axis-Shield) and subse-quently washed with 1× PBS. CD4+ T cells or CD8+ T cells were isolated by negative selection using the EasySep Mouse CD4+ T Cell Isolation Kit or EasySep Mouse CD8+ T Cell Isolation Kit, respectively, follow-ing the manufacturer’s instructions (STEMCELL Technologies).
Lymphocyte culture. Healthy CD4+ T cells from the lymph nodes were cultured in cRPMI medium 24-well plates at a concentration of 1 × 10⁶ cells per well with Mouse T-Activator CD3/CD28 Dynabeads (Gibco, Life Technologies) following the manufacturer’s instructions at 37°C with 5% CO2 for 36 hours. Cells were harvested, spun down at 300 g, 4°C for 7 minutes, then resuspended in 600 μL TriReagent (Zymo Research) and stored at –80 °C until RNA isolation.
Single-cell lymphocytes from EAE-induced mice were resus-pended in complete RPMI media: cRPMI; RPMI-1640 (Lonza), 5% FBS, 1% l-glutamine (200 mM, Gibco, Thermo Fisher Scientific), 1% penicillin-streptomycin (Gibco, Thermo Fisher Scientific), 1% NEAA (×100, Lonza), 1% Na pyruvate (100 mM, Lonza), 1.25% 1M HEPES (Lonza), and 0.1% 2-merceptoethanol (55 mM, Gibco, Thermo Fisher Scientific). Cells were plated in 96-well plates at a concentration of 5 × 10⁵ cells/100 μL with 25 μg/mL of MOG
35–55 autoantigen and were cultured at 37°C with 5% CO2 for 36 hours. Cells were spun down at 350 g for 10 minutes at 4°C. Cells were harvested, washed with cRPMI media, resuspended in RoboSep Buffer (0.5 mL for up to 1 × 10⁸ cells, STEMCELL Technologies), and sorted for CD4+ T cells by negative selection using the manufacturer’s instructions (STEMCELL Tech-nologies). Isolated CD4+ T cells were homogenized in 600 μL of Tri-Reagent (Zymo Research) and stored at –80°C for RNA isolation.
CACCTTTCAGA AG-3′, nested: 5′-TCCGGAATCTAAGACCATCAA-3′
and 5′-GAGGCTCTCTGCTGTCCATC-3′), Ccl5 (outer: 5′ -CCCTCAC-CATCATCCTCACT-3′ and 5′-AGCAAGCAATGACAGGGA AG-3′, nest-ed: 5′-GTGCCCACGTCAAGGAGTAT-3′ and 5′ -CCACTTCTTCTCT-GGGTTGG-3′), Klra7 (outer: 5′-GAACCTGGCTCCTTCAGACA-3′
and 5′-TTGCAGGAAACAAATGTGAG-3′, nested: 5′ -GATTGACAAT-GGCCCATCTA-3′ and 5′-TGATTTATCACAGTCCCCATTG-3′), and
Actb (outer: 5′-TTGCTGACAGGATGCAGAAG-3′ and 5′ -GGGTGTA-AAACGCAGCTCAG-3′, nested: 5′-GGCTCCTAGCACCATGAAGA-3′
and 5′-ACTCCTGCTTGCTGATCCAC-3′). For the quantitative PCR validation for non-EAE (healthy) mice, primers were as follows: P2rx7 (5′-CAGCTGCTTGGGAAAAGTCT-3′ and 5′ -CGTGGAGAGATAGGG-ACAGC-3′), Rgcc (5′-TCGGAAAGCCAAATTAGGTG-3′ and 5′ -TAGTAG-CCGATTTGCCAGGT-3′), Nrn1 (5′-TGGACGACAAGACGAACATC-3′
and 5′-CACATATCTTTCGCCCCTTC-3′), and Actb (5′ -GGCTCCTAG-CACCATGAAGA-3′ and 5′-ACTCCTGCTTGCTGACCAC-3′).
Flow cytometry for T cell subpopulations. Mice were euthanized by
a lethal dose of isoflurane. Spleens were collected from adult female mice (8 to 12 weeks old) that were either WT or Kdm6a cKO. The spleens were passed through a 100 μm followed by 40 μm cell strainer to obtain single-cell suspensions. Lymphocytes were resuspended in FACS buffer (1× PBS + 2% FBS) to a concentration of 1 × 10⁶ cells/100
μL, and 16/32 blocking antibody (BioLegend, 101302) was added at 1:100 dilution and incubated at RT for 10 minutes. Surface proteins were stained with anti–CD3-BV421 (catalog 100227), anti–CD4-APC (catalog 100412), anti–CD8-PE (catalog 100707), anti–CD44-FITC (catalog 103006), and anti–CD62L-BV711 (catalog 104445), anti– NK1.1-PerCP (catalog 108725) (BioLegend 1:100), or the isotype con-trols; BV421 rat IgG2b,κ (catalog 400639), APC rat IgG2b,κ (catalog 400612), PE rat IgG2a,κ (catalog 400508), FITC rat IgG2b,κ (cata-log 400506), BV711 rat IgG2a,κ (catalog 400551), or PerCP mouse IgG2a,κ (catalog 400250) (BioLegend 1:100) for 20 minutes at RT in the dark. Data are representative of 3 replicate experiments. NK1.1 staining was included in only the last 2 experiments.
For FOXP3 staining, surface proteins were stained with anti–CD4-FITC (catalog 130308) and anti–CD25-PE (catalog 102008), or anti–CD4-FITC rat anti-IgG2a,κ (catalog 400506), and PE rat anti-IgG1,γ (catalog 401906) (1:100, BioLegend) for 20 minutes at RT. The cells were fixed and perme-abilized overnight at 4°C in the dark using the FoxP3 Transcription Factor Staining Buffer Kit (Thermo Fisher Scientific) following the manufactur-er’s instructions. Intracellular proteins were stained by anti–FOXP3-APC (17-5773-82, 1:100, Thermo Fisher Scientific) for 30 to 60 minutes at RT in the dark. Data are representative of 2 replicate experiments.
For all flow cytometric experiments, each animal was analyzed in triplicate and average values were reported per animal. Flow cytometric analyses were performed on the SORP BD LSRII Ana-lytic Flow Cytometer using BD FACSDiva 8.0 and FlowJo (version 10.5.3) software. Positive gates were determined based on positive and isotype controls.
H3K27me3 ChIP-Seq analysis. ChIP-Seq data for H3K27me3
mod-ification in mature CD4 single-positive thymocytes from WT and cKO were obtained from the GEO database (GSE70795; ref. 38). R pack-age QuasR (47) was used for the read alignment to the mouse genome (mm10) followed by the visualization of H3K27me3 modification along the genome location.
CD4+ T cell proliferation assay. Healthy CD4+ T cells from the lymph nodes were resuspended at 1 × 10⁶ cells/ml in prewarmed RNA-Seq Kit (Kapa Biosystems), which consists of mRNA
enrich-ment, cDNA generation, end repair, A-tailing, adaptor ligation, strand selection, and PCR amplification. Barcoded adaptors were used for multiplexing samples in 1 lane. Sequencing was performed on Illumina HiSeq3000 for a single end 1 × 50 run. Data quality check was done on Illumina SAV. Demultiplexing was performed with the Illumina Bcl2fastq2 v 2.17 program. These procedures were performed at the UCLA Technology Center for Genomics and Bio-informatics core facility.
Statistical analyses and production of figures were performed in R (R Core Team, 2018). Qualities of raw sequence data were exam-ined using FastQC (http://www.bioinformatics.babraham.ac.uk/ projects/fastqc/), and Trimmomatic (57) was used for cleaning. R package QuasR (47) was used for the read alignment to the mouse genome (mm10), followed by counting at the gene level. We assumed read counts followed a negative binomial distribution and constructed generalized linear models based on this negative binomial distribution assumption. To visualize the relationship of samples, principal com-ponent analysis was performed using transcripts per kilobase million (TPM). The genes with count numbers less than 1 in more than 3 sam-ples were filtered out. Differentially expressed genes between cKO and WT mice were identified with R package edgeR (48). Heatmaps were created using the R package gplots. An FDR of 0.1 was used as the threshold of differentially expressed genes. Canonical pathway enrichment analysis was performed for the differentially expressed genes (FDR < 0.1, logFC > 1 or logFC < –1, logCPM > 1) using Ingenuity Pathway Analysis software (QIAGEN).
Quantitative nested RT-PCR. To validate the RNA-Seq result, we
used quantitative nested RT-PCR, which is advantageous over stan-dard quantitative RT-PCR in that it better amplifies the genes from a small amount of RNA and increases the gene specificity.
RNAs were treated with RNase-Free DNase (Promega) to elimi-nate possible genomic DNA contamination, followed by first-strand cDNA synthesis with SuperScript III (Invitrogen) using a mixture of oligo dT and random hexamers. The first round of PCR was carried out in a 15 μL mixture containing 0.2 mM dNTPs, 2 mM MgCl2, 0.4 μM of each primer (outer primers), 5 ng cDNA, 0.075 μL of Ex Taq DNA Polymerase (Takara), and one-tenth volume of ×10 Ex Taq Buffer (Mg2+ free) (Takara). The PCR reaction was held at 94°C for 4 minutes before the cycling reaction of 15 cycles of 94°C for 45 seconds/60°C for 30 seconds/72°C for 60 seconds, followed by a single 7-minute period at 72°C. To maintain the ratio between target and internal con-trol (Actb) genes, this first round of amplification was performed as a multiplex PCR of each target (P2rx7, Tlr1, Cxcl10, Ccl5, or Klra7) and control (Actb) primers. PCR products were purified with DNA Clean &
Concentrator-5 -Capped Columns (Zymo Research).
Quantitative PCR was carried out on the purified DNA from first amplification with nested primers using PowerUp SYBR Green Master Mix (Applied Biosystems) in Applied Biosystems 7300 Real-Time PCR System. The differences between cKO and WT littermate RNAs were analyzed by t test. Primers were as follows: P2rx7 (outer: 5′ -CCCTG-CACAGTGAACGAGTA-3′ and 5′-CTTAGGGGCCACCTCTTCAT-3′, nested: 5′-CAGCTGCTTGGGAAAAGTCT-3′ and 5′ -CGTGGAGAGA-TAGGGACAGC-3′), Tlr1 (outer: 5′-ATGCACAGCTCCTTGGTTTT-3′
-GGCTGGT-The Journal of Clinical Investigation
R E S E A R C H A R T I C L E
Study approval. The present studies in animals were reviewed
and approved by the Chancellor’s Animal Research Committee of the UCLA Office for the Protection of Research Subjects. Human data were from the GEO database; thus, no approval is necessary.
Author contributions
YI and RRV contributed to the study design. YI and NI contributed to the induction of EAE and scoring. LCG contributed to CD4+ T cell isolation and immune phenotyping. NI, MAM, ER, and VT contributed to tissue collection and processing, immunostaining, and histological analysis. YI contributed to mouse breeding, RNA isolation, quantitative RT-PCR, data mining and analysis of out-sourced data sets, and high-throughput sequencing analysis. YI, NI, LCG, APA, and RRV wrote the manuscript. All authors read and accepted the final version of the manuscript.
Acknowledgments
We would like to thank Ai Ohno, Terri Shi, Michelle Nguyen, and Haley Hrncir for technical assistance on this project. Flow cytom-etry was performed in the UCLA Jonsson Comprehensive Cancer Center (JCCC) and Center for AIDS Research Flow Cytometry Core Facility, which is supported by NIH grants P30 CA016042 and 5P30 AI028697 and by the JCCC, the UCLA AIDS Institute, the David Geffen School of Medicine at UCLA, the UCLA Chancellor’s Office, and the UCLA Vice Chancellor’s Office of Research. We thank the Wellcome Trust Sanger Institute Mouse Genetics Project (Sanger MGP) and its funders for providing the mutant mouse line (Allele:Kdm6atm2a(EUCOMM)Wtsi). Funding and associated primary phe-notypic information may be found at www.sanger.ac.uk/mouse-portal. This work was supported by NIH grants RO1NS096748 and RO1NS109670 (to RRV) and HL131182 (to APA), Conrad N. Hilton Foundation grants 20130232 and 20150232 (to RRV), the Tom Sherak MS Hope Foundation, the Yvette and Eric Edidin Founda-tion, the Rhoda Goetz Foundation for Multiple Sclerosis, the Jewish Community Foundation, and the Dunk MS Foundation.
Address correspondence to: Rhonda R. Voskuhl, Neuroscience Research Building 1, Room 475D, 635 Charles E. Young Drive South, Los Angeles, California 90095, USA. Phone: 310.206.4636; Email: [email protected].
(37°C) PBS with 5 % FBS. A CFSE (5-[and-6]-carboxyfluorescein dia-cetate succinimidyl ester) stock solution (5 mM) was prepared fresh by dissolving lyophilized CFSE (catalog C34554, Thermo Fisher Sci-entific) in DMSO. Freshly prepared CFSE was immediately added to the cell suspension at a final concentration of 5 μM, and the cells were incubated for 5 minutes at RT in the dark. Excess CFSE was quenched by adding at least 5 volumes of prewarmed cRPMI and then washed 2 times with cRPMI and cultured with or without stimulation as described above. Cells were harvested on day 4, washed once in PBS after removal of stimulation beads, resuspended at 1 × 10⁶ cells/ml in 1× PBS, and stained for viability with Aqua amine-reactive dye (catalog L34957, 1:1000, Thermo Fisher Scientific) for 30 minutes in the dark at RT. After washing twice with 1× PBS, surface protein was stained with anti–CD4-APC (BioLegend, catalog 100412, 1:100) after block-ing by 16/32 blockblock-ing antibody (BioLegend, catalog 101302, 1:100) as described above. Proliferation analyses were acquired on a Attune NxT Flow Cytometer (Thermo Fisher Scientific). CFSE intensity for viable (Aqua amine-reactive negative) CD4+ T cells was determined using Attune NxT software (version 3.1) and FlowJo (version 10.0.7r2) software. The undivided peak was determined using unstimulated CSFE-stained CD4+ T cells.
Genotyping PCR. Genotypes of samples were determined by
standard genotyping PCR method using the following primers: CD4-Cre (5′-CATGTCCATCAGGTTCTTGC-3′, 5′ -CCAGGGTCGGAGA-CAATAAC-3′), Kdm6a WT/floxed (5′ -GGAAATGTGAGAGCAAGG-GTA-3′, 5′-CAGCATAAATGTCTTTCCCATT-3′), and Kdm6a floxed/ KO (5′-GCCTGTCCTCGA ACTCAGAA-3′, 5′ -TTGGTCTAATTTG-GCACCTT-3′). For regular breeding processes, genomic DNA from a small piece of ear was used for the genotyping PCR using CD4-Cre and Kdm6a WT/floxed primer sets.
Data availability. Data sets generated during this study were
deposited in the NCBI’s Gene Expression Omnibus database (GEO GSE121703 and GSE128615).
Statistics. Differences of EAE scores between WT and cKO were
measured by repeated measures 1-way ANOVA. Quantitative differ-ences of CD3+ cell count, globoid Iba1+ cell count, βAPP+ percentage area for axonal damage, and NF200+ intact axonal count were exam-ined by Mann-Whitney U test. The statistical tests for microarray and RNA-Seq were separately described in the each section. P values of less than 0.05 were considered significant.
1. International Multiple Sclerosis Genetics Con-sortium, et al. Risk alleles for multiple sclerosis identified by a genomewide study. N Engl J Med. 2007;357(9):851–862.
2. International Multiple Sclerosis Genetics Con-sortium, et al. Genetic risk and a primary role for cell-mediated immune mechanisms in multiple sclerosis. Nature. 2011;476(7359):214–219. 3. Shibasaki H, Kuroiwa Y. Sex difference of multiple
sclerosis in Japan. Neurology. 1976;26(9):821–824. 4. Dunn SE, Gunde E, Lee H. Sex-based differences
in multiple sclerosis (MS): Part II: rising inci-dence of multiple sclerosis in women and the vulnerability of men to progression of this dis-ease. Curr Top Behav Neurosci. 2015;26:57–86. 5. Du S, Itoh N, Askarinam S, Hill H, Arnold AP, Voskuhl RR. XY sex chromosome complement, compared with XX, in the CNS confers greater neurodegeneration during experimental
auto-immune encephalomyelitis. Proc Natl Acad Sci
U S A. 2014;111(7):2806–2811.
6. Smith-Bouvier DL, et al. A role for sex chromosome complement in the female bias in autoimmune disease. J Exp Med. 2008;205(5):1099–1108. 7. Voskuhl RR, Gold SM. Sex-related factors in
mul-tiple sclerosis susceptibility and progression. Nat
Rev Neurol. 2012;8(5):255–263.
8. Sasidhar MV, Itoh N, Gold SM, Lawson GW, Voskuhl RR. The XX sex chromosome comple-ment in mice is associated with increased spon-taneous lupus compared with XY. Ann Rheum Dis. 2012;71(8):1418–1422.
9. Teuscher C, et al. Evidence that the Y chromo-some influences autoimmune disease in male and female mice. Proc Natl Acad Sci U S A. 2006;103(21):8024–8029.
10. Voskuhl R, Klein S. Sex is a biological variable - in the brain too. Nature. 2019;568(7751):171.
11. Penny GD, Kay GF, Sheardown SA, Rastan S, Brockdorff N. Requirement for Xist in X chromosome inactivation. Nature. 1996;379(6561):131–137.
12. Greenfield A, et al. The UTX gene escapes X inactivation in mice and humans. Hum Mol
Genet. 1998;7(4):737–742.
13. Disteche CM, Filippova GN, Tsuchiya KD. Escape from X inactivation. Cytogenet Genome
Res. 2002;99(1-4):36–43.
14. Xu J, Deng X, Watkins R, Disteche CM. Sex- specific differences in expression of histone demethylases Utx and Uty in mouse brain and neurons. J Neurosci. 2008;28(17):4521–4527. 15. Yang F, Babak T, Shendure J, Disteche CM.
Global survey of escape from X inactivation by RNA-sequencing in mouse. Genome Res. 2010;20(5):614–622.
reveals ALR target genes and leads to alter-ations in cell adhesion and growth. Mol Cell Biol. 2007;27(5):1889–1903.
17. Dhar SS, et al. Trans-tail regulation of MLL4- catalyzed H3K4 methylation by H4R3 symmetric dimethylation is mediated by a tandem PHD of MLL4. Genes Dev. 2012;26(24):2749–2762. 18. Hong S, Cho YW, Yu LR, Yu H, Veenstra TD, Ge K.
Identification of JmjC domain-containing UTX and JMJD3 as histone H3 lysine 27 demethylases. Proc
Natl Acad Sci U S A. 2007;104(47):18439–18444.
19. Seenundun S, et al. UTX mediates demethylation of H3K27me3 at muscle-specific genes during myogenesis. EMBO J. 2010;29(8):1401–1411. 20. Itoh Y, et al. Four core genotypes mouse model:
localization of the Sry transgene and bioassay for testicular hormone levels. BMC Res Notes. 2015;8:69.
21. Arnold AP, Chen X. What does the “four core genotypes” mouse model tell us about sex differ-ences in the brain and other tissues? Front
Neuro-endocrinol. 2009;30(1):1–9.
22. Disteche CM, Filippova GN, Tsuchiya KD. Escape from X inactivation. Cytogenet Genome
Res. 2002;99(1-4):36–43.
23. Berletch JB, Yang F, Disteche CM. Escape from X inactivation in mice and humans. Genome Biol. 2010;11(6):213.
24. Yang F, Babak T, Shendure J, Disteche CM. Global survey of escape from X inactivation by RNA-sequencing in mouse. Genome Res. 2010;20(5):614–622.
25. Xu J, Burgoyne PS, Arnold AP. Sex differences in sex chromosome gene expression in mouse brain. Hum Mol Genet. 2002;11(12):1409–1419. 26. Xu J, Taya S, Kaibuchi K, Arnold AP. Sexually
dimorphic expression of Usp9x is related to sex chromosome complement in adult mouse brain.
Eur J Neurosci. 2005;21(11):3017–3022.
27. Berletch JB, Yang F, Xu J, Carrel L, Disteche CM. Genes that escape from X inactivation. Hum
Genet. 2011;130(2):237–245.
28. Berletch JB, et al. Escape from X inactiva-tion varies in mouse tissues. PLoS Genet. 2015;11(3):e1005079.
29. Guan H, Nagarkatti PS, Nagarkatti M. Role of CD44 in the differentiation of Th1 and Th2 cells: CD44-deficiency enhances the development of Th2 effectors in response to sheep RBC and chicken ovalbumin. J Immunol. 2009;183(1):172–180. 30. Hegde VL, Singh NP, Nagarkatti PS, Nagarkatti
M. CD44 mobilization in allogeneic dendritic cell-T cell immunological synapse plays a key role in T cell activation. J Leukoc Biol.
2008;84(1):134–142.
31. Guan H, Nagarkatti PS, Nagarkatti M. CD44 Reciprocally regulates the differentiation of encephalitogenic Th1/Th17 and Th2/regulatory T cells through epigenetic modulation involving DNA methylation of cytokine gene promoters, thereby controlling the development of experi-mental autoimmune encephalomyelitis. J
Immu-nol. 2011;186(12):6955–6964.
32. Shpargel KB, Starmer J, Wang C, Ge K, Magnuson T. UTX-guided neural crest function underlies craniofacial features of Kabuki syndrome. Proc
Natl Acad Sci U S A. 2017;114(43):E9046–E9055.
33. Shpargel KB, Starmer J, Yee D, Pohlers M, Mag-nuson T. KDM6 demethylase independent loss of histone H3 lysine 27 trimethylation during early embryonic development. PLoS Genet. 2014;10(8):e1004507.
34. Faralli H, et al. UTX demethylase activity is required for satellite cell-mediated muscle regen-eration. J Clin Invest. 2016;126(4):1555–1565. 35. Lan F, et al. A histone H3 lysine 27 demethylase
regulates animal posterior development. Nature. 2007;449(7163):689–694.
36. Walport LJ, et al. Human UTY(KDM6C) is a male-specific Nϵ-methyl lysyl demethylase.
J Biol Chem. 2014;289(26):18302–18313.
37. De Vries GJ. Minireview: Sex differences in adult and developing brains: compensation, compensation, compensation. Endocrinology. 2004;145(3):1063–1068.
38. Manna S, et al. Histone H3 Lysine 27 demethylases Jmjd3 and Utx are required for T-cell differentia-tion. Nat Commun. 2015;6:8152.
39. Li X, et al. Demethylase Kdm6a epigenetically promotes IL-6 and IFN-β production in macro-phages. J Autoimmun. 2017;80:85–94. 40. Li Q, et al. Critical role of histone demethylase
Jmjd3 in the regulation of CD4+ T-cell differenti-ation. Nat Commun. 2014;5:5780.
41. Liu Z, et al. The histone H3 lysine-27 demethy-lase Jmjd3 plays a critical role in specific regula-tion of Th17 cell differentiaregula-tion. J Mol Cell Biol. 2015;7(6):505–516.
42. Okamoto M, et al. Mina, an Il4 repressor, controls T helper type 2 bias. Nat Immunol. 2009;10(8):872–879.
43. Cuyàs E, et al. Metformin directly targets the H3K27me3 demethylase KDM6A/UTX. Aging
Cell. 2018;17(4):e12772.
44. Nath N, Khan M, Paintlia MK, Singh I, Hoda MN, Giri S. Metformin attenuated the auto-immune disease of the central nervous system in animal models of multiple sclerosis. J Immunol.
2009;182(12):8005–8014.
45. Sun Y, et al. Metformin ameliorates the develop-ment of experidevelop-mental autoimmune encephalo-myelitis by regulating T helper 17 and regulatory T cells in mice. J Neuroimmunol. 2016;292:58–67. 46. Whitacre CC, Reingold SC, O’Looney PA.
A gender gap in autoimmunity. Science. 1999;283(5406):1277–1278.
47. Gaidatzis D, Lerch A, Hahne F, Stadler MB. QuasR: quantification and annotation of short reads in R. Bioinformatics. 2015;31(7):1130–1132. 48. Robinson MD, McCarthy DJ, Smyth GK. edgeR: a
Bioconductor package for differential expression analysis of digital gene expression data.
Bioinfor-matics. 2010;26(1):139–140.
49. Burgoyne PS, Arnold AP. A primer on the use of mouse models for identifying direct sex chromo some effects that cause sex differences in non-gonadal tissues. Biol Sex Differ. 2016;7:68. 50. Skarnes WC, et al. A conditional knockout
resource for the genome-wide study of mouse gene function. Nature. 2011;474(7351):337–342. 51. Pettitt SJ, et al. Agouti C57BL/6N embryonic
stem cells for mouse genetic resources. Nat
Meth-ods. 2009;6(7):493–495.
52. Bradley A, et al. The mammalian gene function resource: the International Knockout Mouse Consortium. Mamm Genome. 2012;23 (9-10):580–586.
53. Spence RD, et al. Neuroprotection mediated through estrogen receptor-alpha in astrocytes.
Proc Natl Acad Sci U S A. 2011;108(21):8867–8872.
54. Liu HB, Loo KK, Palaszynski K, Ashouri J, Lubahn DB, Voskuhl RR. Estrogen receptor alpha medi-ates estrogen’s immune protection in autoimmune disease. J Immunol. 2003;171(12):6936–6940. 55. Itoh N, et al. Cell-specific and region-specific
transcriptomics in the multiple sclerosis model: Focus on astrocytes. Proc Natl Acad Sci U S A. 2018;115(2):E302–E309.
56. Kim RY, et al. Oestrogen receptor &beta; ligand acts on CD11c&plus; cells to mediate protection in experimental autoimmune enceph-alomyelitis. Brain. 2018;141(1):132–147. 57. Bolger AM, Lohse M, Usadel B. Trimmomatic:
a flexible trimmer for Illumina sequence data.
Bioinformatics. 2014;30(15):2114–2120.
58. Bianchi I, Lleo A, Gershwin ME, Invernizzi P. The X chromosome and immune associated genes. J Autoimmun. 2012;38(2-3):J187–J192. 59. Libert C, Dejager L, Pinheiro I. The X