© 2019, IRJET | Impact Factor value: 7.211 | ISO 9001:2008 Certified Journal | Page 3231
Consumer Complaint Data Analysis
P. Rupesh
1, P. Gunasekhar
2, T.M.Achyuth
3, Y. Venkata Krishna
41,2,3,4
R.M.K Engineering College, Chennai, Tamilnadu
---***---Abstract:-
Each week, the thousands of consumer's complaints about financial protection, services or crash databases of banks to companies for response. Those complaints are published here after the company responds or after 15 days, whichever comes first. By submitting a complaint, consumers can be heard by financial companies, get help with their own issues, and help others avoid similar ones. Every complaint provides insight into problems that people are experiencing, helping us identify inappropriate practices and allowing us to stop them before they become major issues. The analysis highlights how text mining analysis can help unlock the wealth of information contained in consumer complaint databases. The aim is betteroutcomes for consumers, and a better financial marketplace for everyone.
1. Introduction:
Previous studies define a complaint as a conflict between a consumer and a business organization in which the fairness of the resolution procedures, the interpersonal communication and behavior, and the outcome of the complaint resolution process are the principal evaluative criteria used by the customer. In our opinion, a complaint is not necessary a conflict, however, it can create a conflict between a customer and a business organization, when the answer to the consumer’s complaint is not satisfactory. The consumer complaint data set handles all complaints according to states, products, zip codes, company and sub product categories. Our analysis is primarily focused on Mortgage complaints as maximum complaints are registered for this sector. Followed by debit collection and credit reporting complaints.
2. Background Work:
Our dataset is available as Consumer Complaint data on www.data.gov. Data is in Comma Separated File (.csv) format of size 290mb. Dataset contains complaints from 2011 to June 2016. We used “Cloud Berry” explorer- an online storage service provided by Amazon Web Service. We uploaded our data on cloud berry which helps to move data from local computer and cloud. Cloud Berry allows accessing and managing azure accounts. We graphically represented our analysis using Tableau software and IBM Watson analytics.
2.1 Data Storage:
The Unstructured Data is stored in Hadoop Distributed File System (HDFS). The Hadoop Distributed File System (HDFS) is designed to store very large data sets reliably, and to stream those data sets at high bandwidth to user applications. In a large cluster, thousands of servers both host directly attached storage and execute user application tasks. We worked on 2.40GHz CPU Speed Computer, windows operating system and 2 nodes. Any processor higher than this speed can be used for more effective performance.
2.2 Data Analysis:
Our dataset consists of 5,23,471 rows in the Comma Separated Values (.CSV) file format. The dataset consists of the date for which complaints were received ie. Products, sub- products, issues, responses for those issues, locations, companies against which complaint is registered. In our analysis, we f o u n d that majority of the complaints were submitted for Mortgage category. After analyzing we concluded that from 2011 to June 2016 complaints are constantly increasing. With more investigating data, we found the states having maximum complaints along with c ompany names. It came to our knowledge that California followed by Florida and Texas are prime locations where complaints are in maximum numbers.
2.3 Data Visualization:
© 2019, IRJET | Impact Factor value: 7.211 | ISO 9001:2008 Certified Journal | Page 3232
2.4 Graphical Representations:
The data was raw which is analyzed and with suitable queries in Hive. We used following queries to analyze our dataset and prepared graphs using Tableau software.
1) DROP TABLE IF EXISTS CC;
CREATE EXTERNAL TABLE CC (Date Received string, Product string, Sub Product string, Issue string, Sub Issue string, Consumer complaint string, Company public response string, Company string, State string,ZIPcode string, Tags string, Consumer consent string, Submitted via string, Date sent string, Company response string, Timely response string, Consumer disputed string, Complaint ID string)
ROW FORMAT DELIMITED FIELDS TERMINATED BY ',' STORED AS TEXTFILE;
LOAD DATA INPATH 'wasb://[email protected]/Consumer_Complaints.csv/' OVERWRITE INTO TABLE CC;
2) State Query
DROP TABLE IF Exists CCS; CREATE TABLE CCS AS SELECT State, COUNT(State) FROM CC
GROUP BY State;
3) Product Query
DROP TABLE IF EXISTS CCP; CREATE TABLE CCP AS
SELECT Product, COUNT(Product) FROM CC
GROUP BY Product;
4) Company Query
DROP TABLE IF EXISTS CCC; CREATE TABLE CCC AS
SELECT Company, COUNT(Company) FROM CC
GROUP BY Company;
5) Issue Query
DROP TABLE IF EXISTS CCIM; CREATE TABLE CCIM AS SELECT Issue, COUNT(Issue) FROM CC
WHERE Product = 'Mortgage' GROUP BY Issue;
6) DROP TABLE IF EXISTS CCIDC;
CREATE TABLE CCIDC AS SELECT Issue, COUNT(Issue) FROM CC
WHERE Product = 'Debt collection' GROUP BY Issue;
7) Daterecieved Query
DROP TABLE IF EXISTS CCY; CREATE TABLE CCY AS
SELECT Datereceived, COUNT(Daterecieved) FROM CC
© 2019, IRJET | Impact Factor value: 7.211 | ISO 9001:2008 Certified Journal | Page 3233
8) TimelyResponse Query
DROP TABLE IF EXISTS CCTR; CREATE TABLE CCTR AS
SELECT Timelyresponse, COUNT(Timelyresponse) FROM CC
GROUP BY Timelyresponse;
9) Submittedvia Query
DROP TABLE IF Exists CCSV; CREATE TABLE CCSV AS
SELECT Submittedvia, COUNT(Submitted via) FROM CC
GROUP BY Submittedvia;
Graphs for the analysis:
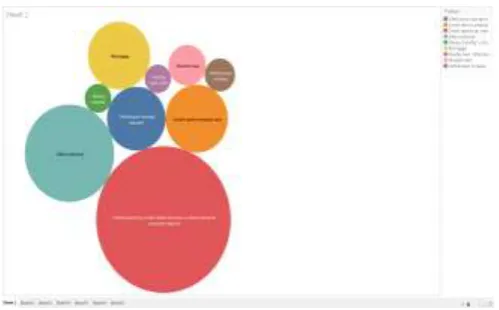
1) Product wise analysis:
Figure (i): Product which is popularly being complained about
The figure (i) depicts which product category was reported maximum for issues.
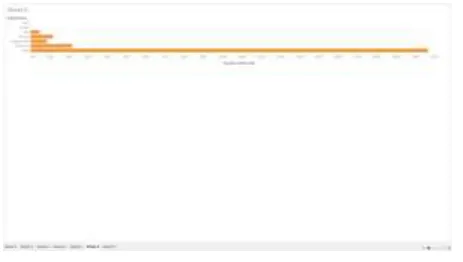
2) Timely response from authority:
[image:3.596.174.424.281.436.2]© 2019, IRJET | Impact Factor value: 7.211 | ISO 9001:2008 Certified Journal | Page 3234 3) Company wise analysis:
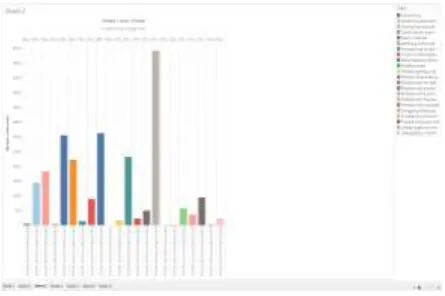
Figure (iii): Company wise analysis
The above Figure (iii) shows from which Company is reported maximum for complaints.
4) Complaints According to Year:
Figure (iv): credit card Complaints-year wise growth
The Figure (iv) represents the complaints registered every year.
We can see from the graph above that the number of complaints has a significant growth from year 2011 till date.
5) Means used for registering Complains:
Figure (v): Means for complains
[image:4.596.185.413.109.231.2] [image:4.596.176.422.309.454.2] [image:4.596.181.413.550.681.2]© 2019, IRJET | Impact Factor value: 7.211 | ISO 9001:2008 Certified Journal | Page 3235 6) States where most issues are arising:
Figure (vi): States where most issues are arising
7) Credit card analysis:
Figure (vii): Complaints Submitted viaWeb, Referral, Postal media for credit card category
The above Figure (vii) represents the Complaints submitted via which medium for credit card category as it reported highest for complaints.
3.Conclusions:
1. From the above mentioned analysis, it is seen that the credit card complaints are increasing since the year
2011. From the business point of view, the home loan objections can be decreased to a degree if the banks' records are frequently checked by the powers and the banks ought to be advised to deliver and submit reports of their exercises all the time barring the clients' private and classified information. Steps should be taken to verify all documents and avoid customers dissatisfaction.
2. During this project we learned and improved our analytical skills. Working on Hadoop Distributed File System
helped us gain knowledge on Hive Query Language. Meanwhile we were able to represent queries into graphical form.
3. In our detailed analysis, we were able to analyze and represent the maximum number of complaints in California
with the majority of complaints being of credit card Complaints. Also, through our analysis, we found which banks are complained about the most and via which web are the complaints recorded. Also it came to our notice that all complaints were timely responded.
4. This brought us to conclusion providing useful giving important aspects in regards to recurrence of complaints,
complaints from different places, about diverse products, sub-products and companies which make us aware and take necessary steps to avoid them.
[image:5.596.173.421.119.263.2] [image:5.596.187.410.320.468.2]© 2019, IRJET | Impact Factor value: 7.211 | ISO 9001:2008 Certified Journal | Page 3236 GitHub Code:
https://github.com/khushbudesai/CIS-520/upload/master
4.References:
1. http://hadoop.apache.org/ https://azure.microsoft.com/en-us/services/hdinsight/
https://azure.microsoft.com/en-
2. us/documentation/articles/hdinsight-hadoop-tutorial-get- started-windows/
3. http://hortonworks.com/hadoop/