Uncertainty-driven Ensemble Forecasting of QoS
in Software Defined Networks
Kostas Kolomvatsos
∗, Christos Anagnostopoulos
†, Angelos K. Marnerides
‡Qiang Ni
‡, Stathes Hadjiefthymiades
§and Dimitrios P. Pezaros
†∗Department of Computer Science, University of Thessaly, 35100, Lamia, Greece †School of Computing Science, University of Glasgow, G12 8QQ, UK
‡InfoLab21, School of Computing & Communications, Lancaster University, LA1 4WA, UK
§Department of Informatics and Telecommunications, National and Kapodistrian University of Athens, 15784, Greece
Email:∗[email protected],†{christos.anagnostopoulos, dimitrios.pezaros}@glasgow.ac.uk, ‡{angelos.marnerides, q.ni}@lancaster.ac.uk
Abstract—Software Defined Networking (SDN) is the key technology for combining networking and Cloud solutions to provide novel applications. SDN offers a number of advantages as the existing resources can be virtualized and orchestrated to provide new services to the end users. Such a technology should be accompanied by powerful mechanisms that ensure the end-to-end quality of service at high levels, thus, enabling support for complex applications that satisfy end users needs. In this paper, we propose an intelligent mechanism that agglomerates the benefits of SDNs with real-time ‘Big Data’ forecasting analytics. The proposed mechanism, as part of the SDN controller, supports predictive intelligence by monitoring a set of network perfor-mance parameters, forecasting their future values, and deriving indications on potential service quality violations. By treating the performance measurements as time-series, our mechanism employs a novel ensemble forecasting methodology to estimate their future values. Such predictions are fed to a Type-2 Fuzzy Logic system to deliver, in real-time, decisions related to service quality violations. Such decisions proactively assist the SDN controller for providing the best possible orchestration of the virtualized resources. We evaluate the proposed mechanism w.r.t. precision and recall metrics over synthetic data.
I. INTRODUCTION
Software Defined Networks (SDNs) management is an emerging network paradigm that has proven to confront a number of constrained topics, e.g., static configuration of network components, in the context of Traffic Engineering (TE) [1]. Since their emergence, SDNs have been applied to a variety of network environments, e.g., large-scale data center networks [1], and they are witnessed to overcome limitations posed by other methods such as ATM, MPLS and IP-based TE [1].
A core objective behind any TE task is to ensure the provi-sion of end-to-endQuality of Service(QoS) and further accom-modate policies that enable the overall resilience, reliability and availability of a given underlying network infrastructure. SDNs have received a considerable level of use for enabling quality-aware mechanisms that are adaptive as instrumented by real-time policies initiated by SDN controllers over the OpenFlow protocol [2].
Nonetheless, the unexpectedly rapid growth of Internet applications has naturally led SDN-based QoS methods to be extremely dependent on the real-time processing of immense volumes of monitored network packets. Regardless of the benefits offered by SDN deployments, there is still a number of issues related with the actual instrumentation of TE and particularly quality-driven and pro-active decision making. This is due to the limitations on real-time network monitoring and processing capabilities residing in current SDN controllers and the OpenFlow protocol [1], [2], [4]. Hence, the com-position of novel SDN-based quality of service management methods needs to greatly consider the incorporation of real-time forecasting analytics to construct flexible, scalable and self-managing networks [4].
In this paper we introduce an intelligentuncertainty-driven SDN-based QoS mechanism in which volumes of monitored network packets are processed, analysed and the future behav-ior of the network is predicted through the use of ensemble forecasting. Quality-related decisions are initiated by aFuzzy Logic (FL) system that we introduce and involve in the whole process. Our results demonstrate the applicability of our mechanism towards the efficacy of real-time predictive and adaptive QoS assurance that, in parallel, ensures the appropriate dimensioning of the underlying network resources. The structure of the paper is as follows: Section II describes related work in the context of SDN-based QoS mechanisms, Section III discusses preliminaries behind our work, whereas Section IV reports on the proposed intelligent mechanism. Section V presents performance evaluation of our mechanism and Section VI concludes this work.
II. RELATEDWORK
application scenarios, e.g. [4], [5]. Overall, the list for QoS-related mechanisms is quite long, however, the agglomeration of SDNs for improving QoS is comparably a quite recent trend in TE.
In fact, the work in [7] was one of the first to address the aspect of QoS-aware routing under the instrumentation of an SDN controller over the OpenFlow protocol. Subsequently, the work in [6] introduced a scheme that leveraged a cen-tralized SDN controller for gaining significant improvements in network utilization as well as to reduce packet losses and delays. Their novel work was addressing both the scenario of a complete SDN deployment over a networked infrastructure as well as the scenario of a partial deployment.
Nonetheless, the above solutions as also many other tech-niques described in [1] were mainly concerned with the utilization of SDNs for enabling QoS and the majority did not consider the aspect of ’Big Data’ and more specifically ’large-scale forecasting analytics’. As reported in [4] there has been minimal work on exploiting the properties of SDNs in order to firstly confront the high volume of monitored network packets and secondly to enable ’Big Data’ technologies and predictive analytics for improving the aspect of QoS. Hence, the blending of SDNs and ’Big Data’ for enabling QoS-related intelligent mechanisms is considered as a quite new topic. However, the use of SDNs for improving ’Big Data’ applications over a networked infrastructure without explicitly looking at QoS has been addressed on a more frequent scale in recent years (e.g. [8], [9]).
To the best of our knowledge, there is a small number of studies that aimed to exploit the synergy of SDNs and ’Big Data’ technologies for improving the aspect of QoS. For instance, the work in [4] suggested tensor-based models for formalizing the networking functions of the data plane and for routing path recommendations that coexist with a transition tensor model in charge of traffic prediction and QoS provisioning. In parallel, with the aforementioned study, the work in [11] introduced a QoS provisioning scheme that was instrumented by a centralized controller that run traffic classification modules based on Support Vector Machine (SVM) [10]. In general, our work is aligned with the latter two pieces of work in [4] and [11] w.r.t. the objectives and the generic merging of the benefits from SDNs and Big Data forecasting analytics for achieving quality of service provisioning. However, we do argue that the solution reported herein is more suitable for real-time QoS provisioning due to its explicit efficient uncertainty-driven ensemble forecast-ing that is less computationally expensive than tensor-based models or SVMs.
III. PRELIMINARIES& RATIONALE
Consider an SDN controller being responsible to perform various network tasks. The SDN controller is connected to the applications through the northbound interface and devices through the southbound interface. The controller incorporates a monitoring mechanism responsible to collect time-series network performance data like latency, link utilization, switch
buffer occupancy, etc. During the functioning, the amount of streaming data collected by the network becomes huge. The controller wants, on top of these streams, to derive predictive analytics and adopt them, in real time, to secure a high QoS. For instance, the controller can incorporate new extensions in its functionality and support more advanced capabilities, such as running algorithms to perform analytics and orchestrating new rules throughout the network.
SDN Management and Orchestration. Instrumenting legacy networks with monitoring capability to facilitate always-on and timely measurement of network-wide perfor-mance metrics in short timescales has been particularly chal-lenging due to the high overhead incurred and associated cost. In SDN however, several features of the controller-to-switch communication can be exploited for measuring diverse perfor-mance parameters while only incurring minimal overhead to the decoupled control plane. We have used readily available options of the Openflow protocol [20] to enable a centralized controller to collect and measure operating network-wide metrics including topology, latency, utilization and switches’ buffer sizes.
Switch buffer size and node-local queuing delay. Buffer oc-cupancy in the switches is the primary contributor to variable queuing delays impacting packet transmission. A bound on the switch-internal queuing delay can be calculated using the max-imum buffer occupancy of each switch together with the egress link rate. If queues have been assigned to the switch ports, the OpenFlow controller can send a ofp queue get config packet to retrieve the queue characteristics, including length (in bytes), and minimum and maximum data-rate (since Open-Flow 1.2). The switch-local queuing delay can be bound by dividing the maximum buffer size by the corresponding egress link rate.
Network-wide, switch-to-switch link latency. Accurate la-tency measurements have been taken using theOpenFlow Dis-covery Protocol (OFDP) which allows custom Type-Length-Value (TLV) structures to be inserted in the packet payload. Through storing a node-local timestamp in the TLV payload, OFDP can be used for both topology discovery and latency measurement. The controller generates an OFDP packet and issues a ofp packet out command to every switch which in turn floods the packet to its neighbors. On reception, each neighbor forwards the OFDP packet back to the controller using ofp packet in, as shown in Fig. 1. This measurement gives the 3-hop round-trip latency of the controller through switchesSj andSi(orSk), which includes both management and data network latency components, and also the time to encapsulate/decapsulate the OFDP message [21]. The control plane processing time (controller-to-switch latency) is mea-sured using OpenFlowofpt echo requestandofpt echo reply messages which are typically used by the switch as a keep-alive signal. Using these two measurements, we can deduce the latency from Si toSj. Generalizing on this method, the latency between any two arbitrary switchesSiandSk through routeR is calculated as follows:LSi→Sk=
P
Ri→k
OFDP ofp_echo ofp_packet_out ofp_packet_in
controller
Sj
Sk
[image:3.612.348.529.52.183.2]Si
Fig. 1. Measuring latency at the SDN controller using OpenFlow.
Average link utilization. The FlowSense approach can be adopted to measure inter-switch link utilization [19], through monitoringPacketInandFlowRemovedmessages triggered by each switch upon flow arrival and entry expiry, respectively. By timestamping the reception ofFlowRemoved, the controller can calculate the duration of the flow, the amount of traffic matched against it, and the input port of traffic matching that entry, therefore being able to infer the amount of bytes con-tributed by this entry to the utilization of the link terminating at this input port. Using information from PacketIn messages of other flows sharing the same link at a given time window, Flowsense can estimate the total average utilization percentage of every link in the network topology. However, it can only do so when these flows expire (i.e., upon reception and timestamping of their correspondingFlowRemovedmessages), and therefore a delay is incurred in estimating overall link utilization. Flowsense produces accurate estimates of link utilization but is only able to do so on the order of a few seconds (on par with typical flow duration), hence making forecasting even more relevant for QoS assurance [19].
A. Rationale
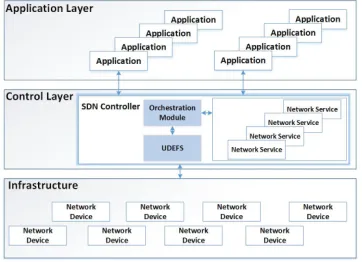
We focus on an intelligent scheme that introduces an ensem-ble forecasting model for deriving future insights on network performance. We cope with the management of various Net-work Performance Parameters(NPPs) by proposing a module that supports, in real-time, the decision making of the SDN controller (see Figure 2). The proposed module relies on a federation of data streams partitions and corresponding query processors that return representative data related to each NPP. On top of these data, the forecasting module derives future insights for each NPP. Our module also involves anuncertainty management model for deriving alerts related to the update of the orchestration process. A Type-2 Fuzzy Logic System (T2FLS) processes the outputs of the forecasting scheme and takes decisions whether it should update the manage-ment of the underlying devices towards the maximization of QoS. Our solution combines responses derived through large-scale predictive analytics with multiple aggregated time series forecasting and uncertainty management to enhance the functionality of the SDN controller.
Example 1: Consider that a SDN controller monitors the NPPs:average link utilization(m1) andaverage latency(m2) of the network. Historical values form1 andm2 are fed into a set of estimators (time-series forecasters) resulting a vector of estimated values. On top of these estimations, we produce future (short-term) estimated values form1andm2, notated by
ˆ
[image:3.612.123.235.52.109.2]m1,mˆ2.mˆ1,mˆ2 are fed to the T2FLS to derive thePotential
Fig. 2. The architecture of the proposed scheme.
of Violation (PoV). PoV is an indication whether the QoS could be violated in the near time. When PoV exceeds a pre-defined threshold, the proposed scheme issues an ‘alert’ to the SDN controller, thus, making it to update the virtualized resources management to secure a high QoS.
Goal: Our goal is to provide forecasting analytics to the SDN controller over a huge amount of performance data streams. Assume a set ofM NPPs of interest. For each NPP, we observe ad-dimensional time-series. Each dimension cor-responds to the very specific monitored source of the network. Hence, we cope with forecasting analytics over a huger M d-dimensional space. Obviously, this does not scale w.r.t.dgiven the M NPPs. We invoke an aggregation operator over all d time-series for each NPP. This operator is a ‘representative’ foralltime-series of a NPP. We adopt thecurrent averageover dtimes series per NPP. Then, an aggregated time-series for a NPP is generated. In turn, we obtainM aggregated time-series instead of M d, taken into account for forecasting analytics. The idea is to adopt a universal approximation system, e.g., a FL system, that‘fuses’ M aggregated streams into a ‘PoV stream’. This FL-based decision making, not only scales with dandM but, also, incorporates the human expert knowledge through inference rules that deliver the PoV to the SDN controller.
IV. THEINTELLIGENTMECHANISM
A. The Ensemble Forecasting Scheme
Consider a set of time-series estimators E =
e1, e2, . . . , e|E| , e.g., auto-regressive predictor, double
and triple exponential smoothing, weighted and cumulative moving average [13]. Specifically, we adopt the estimators discussed in [14] (adopting |E| = 28 estimators). In many cases, we adopt the same estimator with different parameter values, e.g., the cycle estimator with window size equal to W ∈ {2,5,7}. Every ei exploits the historical data for each NPP mk, k = 1,2, . . . ,|M| and estimates their future values. We envisage the estimator ei as a mapping ei : Hmk → R, where Hmk represents historical data for
terms of accuracy) than a single estimator in the average [17]. Different estimators exhibit different characteristics and performance related to prediction error.
The proposed ensemble forecasting scheme consists of the integration of multiple estimators. The integration concerns the estimated values for the same NPP. Based on historical values, we introduce an ensemble forecasting that derives the final aggregated value. The ensemble scheme is an aggregation function: ˆe = f(e1, . . . , e|E|) where eˆ is the aggregated
estimated value while f(·) is the function applied on the estimators results ei. For instance, f(·) could be a linear combination of ei, i.e., eˆ = P|E|
i=1wiei, with P
iwi = 1. The linear ensemble forecasting model is characterized by simplicity, however, it conveys the limitations related to the methodology adopted to derivewi’s. We take into considera-tion the behavior of estimators in therecentpast to determine the corresponding weights wi. As eˆ is related to a specific performance parameter mk, our model produces a vector of estimated values, one per NPP, i.e.,ˆe= [ˆe1, . . . ,ˆe|E|]. Without
loss of generality, we re-scale eiˆ ∈ [0,1]. Weights for each estimator are determined by their performance, i.e., by the forecasting error. Att, let ˆet
i denote the estimation derived by the i-th estimator ei and rkt is the real observation for NPP mk. The absolute forecast error is then: |ˆet
i−rtk|.
LetW(h)be a sliding window specified by a fixed temporal extent h >0. When h→ ∞, the model considers the entire historical NPP time-series for ei. We propose a methodology for determining the weightwiofei based on the performance of ei within W(h), i.e., in the last h rounds with respect to the estimation error. The weights are based on the average forecasting error µi in the pasthprediction rounds. Whenµi is low (i.e., close to 0),ei exhibits the best performance, thus, it should enjoy a high weight. A high weight will lead ei to contribute more, compared to the remaining estimators, to the final aggregated value.
We define a convex combination rule for deriving the weight for each estimator, i.e., wi = 1−µi
P|E| j=11−µj
. Evidently, the
ensemble mechanism assigns high weight on the value that corresponds to an estimator ei having a lowµi.
B. The Uncertainty Management Mechanism
No matter how accurate is a single forecast or an ensemble forecasting scheme, it is valuable only when its results are well accepted by end users / applications. The means for ‘transferring’ the aggregated forecast to the SDN controller, thus, to ‘fire’ an update in the orchestration process is crit-ical. As the SDN controller is an autonomous component that automatically updates the orchestration of the virtualized resources, a ‘probabilistic’ approach on top of the aggregated estimations is not appropriate. The reason is that the SDN controller cannot efficiently handle probabilistic information being sure when the aggregated estimation depicts a high potential of QoS violation. Uncertainty is present on how the final aggregated estimation should be ‘translated’ to a decision related to the initiation of the update of the orchestration process. Uncertainty can be defined as the measure of belief
to QoS violation associated with inaccuracies in forecasting or boundary conditions, adequacy of adopted estimation models, and extrapolation of process in time.
In our model, we adopt FL for the uncertainty management present in very dynamic environments like the behavior of SDN controllers. We propose a T2FLS, which is responsible for defining the SDN controller’s reaction to the incoming NPP measurements. We do not rely on a Type-1 FLS as those models have specific drawbacks when applied in very dynamic environments. Two fundamental differences between Type-2 and Type-1 FLSs are [18]: (i) adaptiveness, meaning that the Type-1 fuzzy sets change as input changes; and (ii) novelty, meaning that the upper and lower membership functions of the same Type-2 fuzzy set may be used simultaneously in computing each bound of the type-reduced interval. Research efforts have shown that there are limitations in typical Type-1 FL systems when handling uncertainties [12], [15].
Our T2FLS is a non-linear mapping betweenl inputsui ∈ Ui⊂R, i= 1, . . . , lcorresponding to the aggregated value for NPP mk, andz outputs vi ∈Vi, i= 1, . . . , z corresponding, e.g., to the PoV. The proposed T2FLS is based on a set of rules, a.k.a. the FL rule base, that combines the available inputs. The adopted FL rules have the following structure:
Rj: Ifu1j isA1j and/oru2j isA2j and/or ... and/orulj is Alj Thenv1j isB1j and ... andvzj isBzj
whereRj is thejth fuzzy rule,uij are the inputs of thejth rule,vkj are the outputs of thejth rule and Aij andBkj are membership functions. Membership functions are adopted to represent the fuzzy subsets for each input and output variables. The structure of the FL rules is the same as in Type-1 systems, however, a Type-2 FL rule base involves Type-2 fuzzy sets in the antecedents and consequents (i.e., the combination of inputs and outputs). Membership functions in Type-2 FLSs are intervals defining the upper and the lower bounds for each fuzzy set [16]. The area between the two bounds is referred to asFootprint of Uncertainty (FoU).Aij are interval Type-2 fuzzy sets and Bij are the centroids of a consequent Type-2 fuzzy set. The following steps are followed when activating a T2FLS: (i) Calculate the membership functions for each fuzzy set based on the input crisp values of the NPPs; (ii) Calculate the firing interval of each fuzzy rule; (iii) Perform type reduction to combine the firing interval of each rule and the corresponding consequent. The final step produces the interval of the consequent, and accordingly, the defuzzification phase defines the final output. The most common method for type reduction is the center of sets type reducer [15].
experts define the upper and the lower limit for the Type-2 fuzzy sets. For simplicity, we consider triangular membership functions as they are widely adopted in the literature. Due to space limitations, we omit the full list of the adopted FL rules.
Example 2:Consider a FL rule liaised with Example 1: IF m1 isLowANDm2 isHighTHENPoV isHigh. Recall that m1 and m2 depict the link utilization and latency, respectively. This specific rule indicates that when the available link utilization is low (close to zero) and the average latency is high (close to unity), the PoV should be high. In this case, an ‘alert’ should be fired to the SDN controller to make it update the management process and keep the QoS at high levels.
V. PERFORMANCEEVALUATION
We report on the performance of the proposed model i.e., the Uncertainty Driven Monitoring Scheme (UDMS) trying to identify its performance concerning the accurate andearly identification of any potential QoS violation event. We ex-periment with synthetic traces (time-series) derived by: the Uniform (U) and the Exponential (E) distributions. We adopt the Uniform to represent dynamic environments where data change continually and the Exponential to focus on low or high values depending on the experimental scenario. The adopted simulator is written in Java. Our experimental scenarios in-volve three NPPs: link utilizationβ, average switches’ buffer size , and average latencyα.
A. Experimental Setup & Performance Metrics
We consider that β, and α take values derived by the two distributions (Uniform and Exponential). When adopting the Uniform, we assume a very dynamic environment where NPPs change continually. When the Exponential is adopted, we consider two scenarios: (i) the first involves the rate of the exponential λ= 0.5 paying attention on an environment where NPPs are mainly considered as high (close to unity); (ii) the second scenario involvesλ= 2.0 forcing the Exponential to derive low values close to zero. We also consider three decision thresholds; one per each NPP, i.e., βT, T, αT. When NPPs are above/below (it depends on the type of the parameter) the threshold, it indicates that, probably, QoS will be violated in the near future.
We adopt the widely known metrics precisionπandrecall ρ. We also adopt the accuracymetric ψ and the F-measure φ. The following equations stand true: π = T P
T P+F P, ρ = T P
T P+F N,φ= 2 π·ρ π+ρ,ψ=
T P+T N
T P+T N+F P+F N. Note: T refers to ’true’, P refers to ’positive’, F refers to ’false’, and N refers to ’negative’.
We run 1,000 simulations and for 1,000 rounds per simu-lation, i.e., t∈ {1,2, . . . ,1000}. Att, we collect the realiza-tion of NPPs and execute the proposed monitoring scheme. When NPPs are above/below the pre-defined thresholds, we consider an event of possible QoS violation. The aim is to have the UDMS to correctly identify all the events present into our time-series dataset. Our simulations involve three (3) scenarios: (i) Scenario A: βT = T = αT = 0.5; (ii)
Scenario B: βT = 0.3, T = αT = 0.7; (iii) Scenario C: βT = 0.7, T = αT = 0.3; With these scenarios, we try to simulate three different strategies concerning the identification of events. The Scenario A interprets that QoS could be violated when performance is above/below a value that is half of the interval (i.e., [0,1]). The Scenario B interprets a more relaxed strategy where the controller ‘foresees’ QoS violation only when the switches’ buffer size is limited, the link utilization and the latency are very high. The Scenario C depicts a case where the controller wants to keep the performance of the network at high levels, thus, even a low decrease/increase of the link utilization, latency, and switches’ buffer size will fire a QoS violation event. Finally, in our simulations, we consider sliding windows of lengthh= 50for all NPPs.
B. Performance Assessment
In Table I, Columns 2-4, we report on simulations results for the Scenario A. We observe thatπis high, close to unity. This means that the UDMS is capable of identifying potential QoS violation events according to the synthetic time-series with limited false positive events. The aforementioned results stand for the Uniform distribution. Similar results are observed when the Exponential is adopted to produce the synthetic time-series. Additionally, ρ is high when the Uniform is adopted while is very low when the rate of the Exponential is high (i.e., λ= 2.0). This means that the proposed mechanism tends to miss some true events when the dataset involves low values for NPPs (as derived by the Exponential when λ= 2.0). In such cases, the UDMS cannot derive a number of events when it receives continuous low values concerning the NPPs reducing ρ.φandψare at high levels except the case of the Exponential and more specifically when the distribution derives low values for NPPs. In Table I, Columns 5-7, we present our simulation results for the Scenario B. We observe thatπis lower than in the Scenario A whileρis higher. Scenario B depicts a ‘relaxed’ scenario where the performance parameters should approach their lowest value to ‘represent’ a high risk of QoS violation. φandψare at similar levels as in the Scenario A. In Table I, Columns 8-10, we present our results concerning the Scenario C.πis observed at the highest possible value (i.e., the unity) depicting that no false positive events are identified. ρ is at similar levels as in the Scenario A. In general, the strength of the proposed mechanism is in stohastic traces where the fluctuations of the NPPs are high.
TABLE I
UDMS PERFORMANCE RESULTS
Scenario A Scenario B Scenario C Uniform Exponential Uniform Exponential Uniform Exponential
λ=0.5 λ=2.0 λ=0.5 λ=2.0 λ=0.5 λ=2.0
π 0.96 0.95 0.93 0.79 0.77 0.72 1.00 1.00 1.00
ρ 0.76 0.69 0.45 0.83 0.75 0.46 0.71 0.64 0.42
φ 0.85 0.80 0.61 0.81 0.76 0.56 0.83 0.78 0.59
ψ 0.76 0.70 0.50 0.74 0.70 0.54 0.72 0.65 0.44
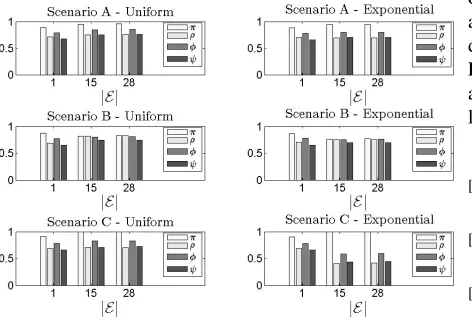
Fig. 3. UDMS results for different number of estimators|E|.
for different |E| (i.e., |E| ∈ {1,15,28}). With this set of experiments, we reveal the effect of the estimators number into the performance of the UDMS. For Scenarios A and C, the lower the|E|is the lower theπbecomes. In the Scenario B, π decreases as |E|increases. Recall that Scenario B assumes potential QoS violations when β is close to zero and and α are close to unity. When |E| = 1, the performance of the UDMS is bounded by the performance of the single estimator. Similar results are observed for the remaining metrics i.e., ρ, φ, ψ. In Scenarios A and C, those metrics increase as |E| increases. Especially, for the Exponential, we observe, in the Scenario C, similar values for ρ, φ and ψ no matter the |E| value. It should be noted that in this set of experiments, we consider λ = 0.5, thus, we pay attention on high values for NPPs. In the Scenario B, we observe an increase for ρ, φ and ψ when |E| increases in contrast to the decrease of π. The reason is that in the Scenario B as |E|increases the false positives increase while the false negative events decrease.
VI. CONCLUSIONS
We propose the adoption of a monitoring mechanism into an SDN controller responsible to manage multiple virtualized resources. The monitoring mechanism builds on top of large scale data related to the performance of the underlying infras-tructure. We rely on multiple forecasting techniques forming an ensemble scheme and on an uncertainty driven decision model for delivering insights on potential future QoS violation events. We propose a fusion scheme for multiple estimations involving the past behavior of each estimator. This behavior is depicted by a weight that affects each estimated value when aggregated into a final one. The outputs of the forecasting scheme are fed into the proposed uncertainty driven model where a Type-2 Fuzzy Logic system delivers the potential of QoS violation. Based on this potential, the mechanism is capable of resulting if the QoS will be, possibly, violated in the near future. We provide the description of the proposed scheme and results for a set of simulations. Our simulations, realized over synthetic traces, show that our mechanisms is capable
of identifying potential events as depicted by high precision and recall values. Future extensions of our scheme involve the definition of an intelligent model for the aggregation process. For instance, the system could excluded some of the estimators and derive insights for the future values that are related to the long-term prediction.
REFERENCES
[1] Ian F. Akyildiz, Ahyoung Lee, Pu Wang, Min Luo, Wu Chou, ’A roadmap for traffic engineering in SDN-OpenFlow networks’, Computer Networks, 71(4), 2014, pp. 1-30.
[2] H. E. Egilmez and A. M. Tekalp, ’Distributed QoS Architectures for Mul-timedia Streaming Over Software Defined Networks’, IEEE Transactions on Multimedia, 16(6), 2014, pp. 1597-1609.
[3] J. L. Marzo, E. Calle, C. Scoglio and T. Anjah, ’QoS online routing and MPLS multilevel protection: a survey’, IEEE Communications Magazine, 41(10), 2003, pp. 126-132.
[4] L. Kuang, L. T. Yang, X. Wang, P. Wang and Y. Zhao, ’A tensor-based big data model for QoS improvement in software defined networks’, IEEE Network, 30(1), 2016, pp. 30-35.
[5] M. Mu et al., ’A Scalable User Fairness Model for Adaptive Video Streaming Over SDN-Assisted Future Networks’, IEEE Journal on Se-lected Areas in Communications, 34(8), 2016, pp. 2168-2184.
[6] S. Agarwal, M. Kodialam, T. Lakshman, ’Traffic engineering in software defined networks’, INFOCOM’13, 2013, pp. 2211–2219.
[7] C. Rothernberg, C. N. A. Correa, R. Raszuk, ’Revisiting Routing Control Platforms with the Eyes and Muscles of Software-Defined Networking’, ACM-SIGCOMM HotSDN Workshop, 2012.
[8] G. Wang, T.S. Eugene Ng, and A. Shaikh, ’Programming your network at run-time for big data applications’, Workshop on Hot topics in software defined networks, in Proceedings of the first workshop on Hot topics in software defined networks, 2012.
[9] P. Costa, A. Donnelly, A. Rowstron, and G. O’Shea, ’Camdoop: Exploit-ing in-network aggregation for big data applications’, USENIX NSDI’12, 2012.
[10] C. Cortes, V. Vapnik (1995). ’Support-vector networks’, Machine Learn-ing, 20(3), pp. 273-297.
[11] P. Wang, S. C. Lin and M. Luo, ’A Framework for QoS-aware Traffic Classification Using Semi-supervised Machine Learning in SDNs,’ 2016 IEEE SCC, pp. 760-765.
[12] Hagras, H., ‘A hierarchical type-2 fuzzy logic control architecture for autonomous mobile robots’, IEEE TFS, 12, 2004, pp. 524–539. [13] G. Edward, G. Jenkins. 1990, ’Time Series Analysis, Forecasting and
Control’, Holden-Day, Incorporated.
[14] Kolomvatsos, K., Panagidi, K., Hadjiefthymiades, S., ’A Load Balancing Module for Post Emergency Management’, Elsevier Expert Systems with Applications, 42(1), pp. 657 - 667, 2015.
[15] Mendel, J. M., ‘ Uncertain Rule-Based Fuzzy Logic Systems: Introduc-tion and New DirecIntroduc-tions’, Upper Saddle River, NJ: Prentice-Hall, 2001. [16] Mendel, J. M., ‘Type-2 Fuzzy Sets and Systems: An Overview’, IEEE
Computational Intelligence Magazine, vol. 2(2), 2007.
[17] Wichard, J., Ogorzalek, M., ’Time Series Prediction with Ensemble Models’, Neurocomputing, vol. 70(13-15), 2007, pp. 2371-2378. [18] Wu, D., ‘On the Fundamental Differences Between Inerval Type-2 and
Type-1 Fuzzy Logic Controllers’ IEEE Transaction on Fuzzy Systems, vol. 20(5), 2012, pp. 832-848.
[19] C. Yu, C. Lumezanu, Y. Zhang, V. Singh, G. Jiang and H.V. Madhyastha, ’FlowSense: monitoring network utilization with zero measurement cost’, Passive and Active Measurement Conference, 2013, pp. 31-41. [20] N. McKeown, T. Anderson, H. Balakrishnan, G. Parulkar, L. Peterson,
J. Rexford, S. Shenker, and J. Turner, ’OpenFlow: Enabling innovation in campus networks’, ACM SIGCOMM Computer Communication Review, 38(2), 2008, pp. 69-74.