warwick.ac.uk/lib-publications
Original citation:
Moss, Roger, Shire, G. S. F., Eames, P. C., Henshall, P., Hyde, T. and Arya, F. (2018) Design
and commissioning of a virtual image solar simulator for testing thermal collectors. Solar
Energy, 159. pp. 234-242. ISSN 0038-092X
Permanent WRAP URL:
http://wrap.warwick.ac.uk/95264
Copyright and reuse:
The Warwick Research Archive Portal (WRAP) makes this work of researchers of the
University of Warwick available open access under the following conditions.
This article is made available under the Creative Commons Attribution 4.0 International
license (CC BY 4.0) and may be reused according to the conditions of the license. For more
details see:
http://creativecommons.org/licenses/by/4.0/
A note on versions:
The version presented in WRAP is the published version, or, version of record, and may be
cited as it appears here.
Contents lists available atScienceDirect
Solar Energy
journal homepage:www.elsevier.com/locate/solener
Design and commissioning of a virtual image solar simulator for testing
thermal collectors
R.W. Moss
a,⁎, G.S.F. Shire
a, P.C. Eames
b, P. Henshall
c, T. Hyde
d, F. Arya
d aSchool of Engineering, University of Warwick, UKbCentre for Renewable Energy Systems Technology, Loughborough University, UK
cOxford Institute for Sustainable Development, Oxford Brookes University, Formerly Centre for Renewable Energy Systems Technology, Loughborough University, UK dSchool of the Built Environment, University of Ulster, UK
A R T I C L E I N F O
Keywords:
Simulator Spectrum Collector Black body
A B S T R A C T
A solar simulator has been designed and built for testing prototype (0.5 × 0.5 m)flat plate thermal collectors. An internally reflecting light tube generates multiple virtual images of the four halogenfloodlights to ensure uniform illumination. Ray-tracing simulations were used to choose the tube dimensions and maximum allowable clearance. Illumination measurements agree well with these predictions.
The visible & near IR spectrum appears to follow a black body curve. In the absence of a“cold sky”IRfilter there is a secondary, long wavelength IR spectral component that causes heating of the cover glass on a solarflat plate collector. The cover glass temperature can be maintained at typical outdoor levels using a cooling fan. The design would be well suited to LED illumination.
Simulation of solar collector response to this spectrum shows that an efficiency based on pyranometer readings is approximately 1% higher than would be obtained with an AM1.5 spectrum.
1. Introduction
Solar panels are frequently tested indoors under a solar simulator that provides control of illumination levels and allows these to be maintained in a stable environment. When testing PV cells the illumi-nation spectrum is important since the conversion efficiency is spec-trally-dependent; this typically requires the use of specialised lamps, for instance high-pressure xenon discharge bulbs (Dibowski and Eber, 2017), metal halide (Meng et al., 2011; Dong et al., 2015) or LEDs (Kohraku and Kurokawa, 2006; Bliss et al., 2009; Jang and Shin, 2010; Bazzi et al., 2012; Kolberg et al., 2012; Plyta, 2015). A combination of quartz-halogen lamps and blue LEDs is a cost-effective way of gen-erating a spectrum covering the IR and visible spectrum (Grandi et al., 2014). Interest in the potential of small, high efficiency PV cells illu-minated using concentrating optics has led to the development of high-flux solar simulators (Codd et al., 2010; Kreuger et al., 2013; Sarwar et al., 2014; Ekman et al., 2015).Schubert and Spinner (2016) com-pares the spectral accuracy of a number of light sources.
The requirements for testing thermal collectors are however much less stringent. Absorbers typically use a selective emissivity coating having high absorbance, over a wide spectral range, for wavelengths present in sunlight and then low absorbance for wavelengths
characteristic of black-body radiation at the absorber temperature. The exact spectral distribution is of little interest. The illumination for a thermal panel simulator can therefore be provided by low-cost quartz-halogen bulbs (Shatat et al., 2013). Typically these produce a spectrum with a lower colour temperature than sunlight i.e. a larger infra-red component.
The illumination should be sufficiently uniform that the mean power over the panel area can be easily and accurately determined from a number of point measurements.
Traditionally this has been achieved using an array of lamps cov-ering an area considerably larger than the test section (Simon, 1976). This is inefficient in terms of the laboratory space requirement and heat input in what should ideally be a temperature-controlled area; there is also a risk of a bright spot under each bulb if the bulb to panel distance is small. The simulator described here overcomes these difficulties by using a reflecting light tube.
2. Simulator design
A highly uniform illuminatedfield may be obtained with a small number of bulbs by using a reflecting light tube that generates multiple virtual images,Fig. 1. The virtual images simulate the appearance of a
http://dx.doi.org/10.1016/j.solener.2017.10.044
Received 3 July 2017; Accepted 11 October 2017
⁎Corresponding author.
E-mail address:r.moss@warwick.ac.uk(R.W. Moss).
0038-092X/ © 2017 The Author(s). Published by Elsevier Ltd. This is an open access article under the CC BY license (http://creativecommons.org/licenses/BY/4.0/).
much larger lamp array.
A ray-tracing program was written in Matlab to predict the illumi-nation at every points X Y( , )on a 41 × 41 node grid covering the target area. The program input parameters are defined inFig. 2and include a limit on the maximum number of reflections for each ray.
For each lamp in the lamp plane the program calculates the distance to the target point, the number of reflections and the elevation and altazimuth angles of the beam relative to the lamp axis. The process is the same both for“real”lamps providing direct illumination and their reflected (virtual) images. The light tube reflective surface was made from aluminium foil to minimise the weight of the assembly; the foil was attached to the plywood using Spray Mount™ adhesive. The re-flectivity of the foil’s more reflective side was assumed to be the nominal level for aluminium (0.88). No correction was applied for variation in reflectivity with angle: it seemed likely that at low angles the reflectivity would increase towards total reflection but that this would be at least partially offset by increased scattering due to roughness of the plywood underneath the foil.
The illumination distribution for afloodlight was measured using a Kipp & Zonen CMP11 pyranometer (Fig. 3). For simplicity the mean of the two profiles was adopted as a radially-symmetric distribution and characterised as a fourth-order curve fit. The power was assumed to follow an inverse square law with distance. The data was obtained over a plane and then (Fig. 3b) scaled to represent illumination on the sur-face of a sphere of radius 1 m.
Fig. 4 models the illumination achieved when each of the four floodlights is angled to face a collector centreline (vertical or hor-izontal). This was the configuration chosen for collector testing. The sharp drop-offat the edges demonstrates the effect of the vertical gap between the target and the lower extent of the light tube. Some gap here is desirable for ventilation, for ease of access and viewing the collector whilst testing. The light tube width was made 40% larger than the solar panel so that the panel could sit within the uniformfield. The light tube length was constrained by the laboratory ceiling height: a longer light tube would produce greater uniformity.
The mechanical design of the simulator is intended to allow the light tube to be rapidly swung to one side. The tube is mounted on hinges and has a pair of counter-balance weights,Fig. 5. For panel installation
it can be raised to a horizontal position,Fig. 5b. The solar collector is typically mounted at an angle of 11° to the horizontal to avoid any risk of bubbles collecting internally against the upper surface.
3. Simulator commissioning and calibration
The mean power and uniformity of illumination was determined by reading the pyranometer at 25 locations on a 5 × 5 grid. This was done at full power and for various combinations of bulbs: all four, then three, two or just one bulb; for brevity only the four-bulb data is presented here. When reducing power it is preferable to reduce the number of lamps in use instead of running the bulbs at a lower temperature. The latter option can result in reduced bulb life as well as changes to the spectrum.
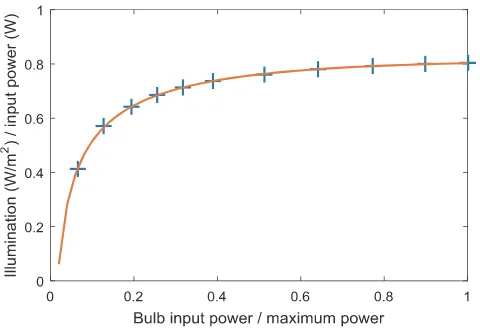
The illumination over a 0.5×0.5 m grid with all four bulbs is shown inFig. 6. A 4th order surface,Fig. 6(a), wasfitted through all 25 data points:
∑ ∑
== = G x y( , ) p x y
j i
ij i j 0
4
0 4
The area-averaged mean power was then found by integration. Cross-sections through the central region,Fig. 6(b), are less uniform than was expected from the simulation. This may be due to small errors in the angular alignment of the lights. The degree of uniformity is however sufficient to enable the mean power to be accurately de-termined when testing solar collectors. The predicted mean illumina-tion is 2.3% lower than measured; the simulaillumina-tion would match the measured illumination if the reflectivity value used were r= 0.894 instead of the nominal 0.88.
The observed non-dimensional standard deviation for the data in Fig. 6isσ =0.053
μ , very close to predicted levels for the lamp tilt angle
= − °
α 5.5,Fig. 7. Subsequent analysis indicated that a more uniform illumination could have been achieved with a tilt angleα≈ + °8.
The fourfloodlights are powered by a variable transformer. The maximum illumination is 1340 W/m2; typically solar collectors are tested up to 1000 W/m2, with lower powers being achieved by reducing either the voltage or the number of lamps in use. The transformer output power is measured by a Hameg HM115 power meter. To avoid any possible error due to variation in mains voltage over the duration of a test the instantaneous power signal from the Hameg is recorded along with all the solar collector data. The instantaneous power signal (100 Hz) passes through a full-wave operational amplifier rectifier and low-pass filter to provide a recordable DC level. Subsequent testing revealed the 100 Hz signal to be almost entirely positive so the rectifier was not strictly necessary.
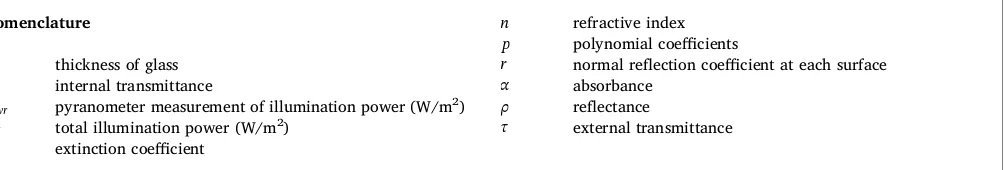
Measurements over a wide power range led to an empirical corre-lation between electrical power and mean illumination,Fig. 8.
4. Investigation into solar collector cover glass temperatures
The simulator has been used to test evacuatedflat plate solar col-lectors: full experimental results will be published in due course. The internal pressure is in the evacuated collectors is typically less than 0.2 Pa and an array of pillars (Fig. 9) supports the cover glass against atmospheric pressure, Henshall et al. (2016). The absorber is black
Nomenclature
d thickness of glass
f internal transmittance
Gpyr pyranometer measurement of illumination power (W/m2)
GT total illumination power (W/m2) k extinction coefficient
n refractive index
p polynomial coefficients
r normal reflection coefficient at each surface
α absorbance
ρ reflectance
τ external transmittance
[image:3.595.56.558.56.141.2]x
Fig. 1.Cross-section through the lamp array plane, showing one lamp within the light tube area (shaded) and the virtual images of this lamp when reflected in one or more sides of the light tube. Dotted lines show actual (yellow) and virtual (mauve) light path from bulb to a target point X.
R.W. Moss et al. Solar Energy 159 (2018) 234–242
[image:3.595.45.284.564.702.2]chrome plated (McDonald, 1975) and the cover is a low iron glass, 4 mm thick, without any anti-reflection or low emissivity coatings. In-itial testing showed that the cover glass temperature rose to over 50 °C
under the solar simulator. This was unexpected because high trans-parency, low iron glass had been used. To assess the absorbance of this glass a 6 mm thick sample was inserted above the pyranometer: the overall transmittance was found to be 91.75%. The glass was uncoated and the reflectance at each surface may therefore be calculated from Snell’s law, r=0.0417. The external transmittance is given by
= −
− τoverall
f r
fr (1 ) 1 ( )
2
2 where f is the internal transmittance. To achieve the observedτoverall=0.9175requiresf=0.9973; within the accuracy of the experiment the internal absorbance of order 0.27% is scarcely mea-surable at these wavelengths and cannot explain the observed tem-perature rise.
Two explanations were considered. One possibility was that the thermocouples, being opaque, were locally absorbing a large fraction of the illumination and generating a hot-spot on the glass; alternatively, since the simulator did not have a“cold sky”IRfilter, the glass could have been absorbing infra-red radiation at wavelengths too long to be detectable by the pyranometer.
4.1. Transient testing: Thermocouple data
A transient heating test was performed to investigate whether the
Virtual
image
Lamp
Fig. 2.Simulation parameters for optimisation of lamp positions and light tube dimensions. The fourflood lights have rotational symmetry about the light tube axis. Dimensions are defined as multiples of the half-widths, with lamp non-dimensional positionsgx,gy, lengthsk,n [image:4.595.40.346.57.638.2]and anglesαandrotused as input to the ray-tracing al-gorithm.
[image:4.595.45.283.272.643.2]Fig. 3.Floodlight characterisation. (a) Brightness distribution over a plane surface 1 m from thefloodlight bulb, (b) Brightness distribution on horizontal (x, H) and vertical (y, V) axes, scaled to a nominal 420 W power and on a spherical shell of radius 1 m. This calibration is for a used bulb: a new bulb was approximately 1.5% brighter (on-axis) at the same power.
Fig. 4.Prediction of illumination levels achieved during solar collector tests (four lamps, non-dimensional proportions n= 4.94, k= 0.57, (gx, gy) = (0.54, 0.43),α= −5.5°,
rot= 90°). X- and y-axis units are multiples of the tube half-widths. Mean power over 0.5 × 0.5 m target area 1306 W/m2based on nominal reflectivityr= 0.88, input power
[image:4.595.314.552.308.450.2]thermocouple readings were a valid indication of glass temperatures. Two thermocouples were glued to the outer surface of the upper glass pane using Rapid Epoxy: one over a support pillar, the other (“distant from pillars”) midway between four pillars,Fig. 9. The pattern was repeated on the bottom glass. The thermocouples were halfway along the flow path through the collector so that the coolant temperature could be estimated without making detailed assumptions about theflow distribution.
The experiment was run at above ambient temperature so that an infra-red camera could be used without excessive reflections of back-ground heat sources. Warm Tyfocor was passed through the absorber until the glass temperatures reached about 40 °C; the collector was at ambient pressure to facilitate heating of the glass and the glass was covered with polystyrene to minimise external heat losses and promote an even temperature distribution. The enclosure was then rapidly evacuated to 0.16 Pa to minimise changes in absorber to glass heatflux that might occur if the absorber changed in temperature under the il-lumination.
Maintaining aflow rate of 5 g/s the polystyrene was removed and the glass started to cool by natural convection,Fig. 10. The rear glass sits on 50 mm of polyurethane insulation and only cools very gradually; for most of the test the rear glass was hotter than the top glass. Con-duction up the pillars therefore causes the“pillar top”thermocouple to be hotter than the“central”one.
Ten minutes later (t= 34 min inFig. 10) the simulator was turned on and the mean absorber temperature rose from 50.5 to 55 °C (dashed green line, shifted downwards by 10 °C for ease of comparison).
[image:5.595.36.373.55.286.2]Both top surface thermocouples show a step in temperature as the
Fig. 5.(a) Simulator with light tube swung upwards for access to target area and lamps. The variable transformer is on the bench. This was prior to the addition of the counter-weights. (b) Simulator in use.
[image:5.595.312.551.300.463.2]Fig. 6.(a) Fitted illumination surface through 25 data points, (b) Orthogonal cross-sections through central point.
Fig. 7.Simulation of effect of lamp tilt angle, including varying numbers of reflections: (a) mean illumination level over the collector area, (b) non-dimensionalised standard deviation. With this relatively short light tube and angles⩽15°the simulation showed no further change with more than 5 reflections per ray. Other parameters asFig. 4.
R.W. Moss et al. Solar Energy 159 (2018) 234–242
[image:5.595.71.527.576.727.2]lamps are turned on. Initially only a surface layer heats up: this has a short time constant. As the thermal pulse travels deeper into the glass the time constant rises, as indicated by a reduction in the gradient. The “pillar top”thermocouple has a slower heating and cooling rate than the“central”one because of the thermal capacity of the pillar touching the underside of the glass. Relative to an exponentialfit,Fig. 10, both thermocouples show a rapid initial response for the first 4.5 s after exposure to the light. The temperature initially overshoots the curvefit line but then returns to it approximately 78 s after exposure starts. The reason for this characteristic is unclear.
After 15 min heating the lamps were turned off. There is a rapid fall in the thermocouple readings of order 2°C (pillar top), 1.25 °C (central from pillars) relative to the curvefit, indicating that the heat absorbed by the opaque thermocouple had locally raised the temperature of the glass. Visual inspection of the temperatures relative to the underlying curve fit suggests the initial cooling time constant is of order 12 s; within about 30 s the thermocouple temperature is again closely fol-lowing the curve-fit line, suggesting that the surface temperature is then uniform in the vicinity of the thermocouple.
4.2. Transient testing–infra-red camera images
[image:6.595.44.284.54.218.2]When using an infra-red camera to measure temperatures it is im-portant to know the surface emissivity; if this is not possible, errors can be reduced by making the emissivity close to unity. Glass is opaque in the far infra-red but is not a perfect black body. To provide a higher emissivity surface, strips of Scotch Magic®tape were stuck on the glass, Fig. 11. The tape emissivity was not accurately known; it was therefore assumed to be 0.96, based on past experience. The camera reference temperature was not set up prior to the testing and, even with this high emissivity, the camera temperatures exceeded thermocouple levels by approximately 1.2 °C. This is not a problem since the purpose of the infra-red images was simply to compare regions with and without thermocouples. The camera was a FLIR SC660.
Thefirst image was taken immediately after removing the poly-styrene insulation from the top glass,Fig. 11(b). It was assumed that hot spots around the top of each pillar formed a regular, repeating pattern at this instant and that equivalent positions (e.g. above each pillar) would be at the same temperature.
Setting the glass emissivity at 0.92 and the epoxy emissivity at 0.97 gave good agreement with the Scotch tape temperatures for spots in close proximity.
A sequence of images taken once per minute through the cool-down period broadly matches the thermocouple record, though there is some drift in the camera calibration; the most reliable images can be iden-tified as those taken just after each auto-calibration. Comparing tem-peratures at thermocouple and non-thermocouple locations 2 min after the end of the heating period,Fig. 12, shows no evidence remaining of any“hot-spot”around the thermocouple locations. The apparent dif-ference in temperatures is due to variations in emissivity between glass, tape and epoxy: spot meter readings show the“distant”thermocouple and its adjacent glass at 40.2–40.5 °C. This difference is within the experimental accuracy.
4.3. Interpretation of transient test result
These measurements indicate that the heating of the glass is prin-cipally due to absorbance of long wavelength infra-red which is un-detectable by the pyranometer as opposed to local heating by visible light impinging on opaque thermocouples.
The “distant” thermocouple trace in Fig. 10 shows a change in gradient between the curvefits for cooling and heating of 0.888 °C/min, equivalent to a change in heatflux of 145 W/m2. The transmissivity test indicates that the majority of this heatflux must result from radiation at wavelengths > 2.8μm that are not detected by the pyranometer.
Two evacuated collectors have been tested under the solar simu-lator. Efficiency data has been obtained over a variety of temperature and illumination levels. The majority of these tests used a cooling fan to limit the glass temperature. This removes a large part of the heat due to long wavelength radiation without it being transferred into the ab-sorber. The presence of this IR component therefore does not have a major impact on the measured efficiencies. In particular, when com-paring “like for like” tests with the fan in operation, the measured change in efficiency is an effective indication of the reduction in heat losses when evacuated with a high vacuum condition.
Fig. 8.Relationship between illumination level at absorber centre and bulb power. The
[image:6.595.44.284.257.394.2]fitted curvey= −0.0402(lnx)2+0.0323lnx+0.803fits the data points to within 0.7%.
Fig. 9.Solar collector with thermocouples on top cover glass (circled).
[image:6.595.45.283.422.600.2]5. Spectral effects on thermal collector absorbance
5.1. Characterisation of thefloodlight spectra
The simulator spectrum was measured at the centre of the target area using an Eko Instruments LS-100 spectrometer. This covers the visible and near-IR spectrum (350–1150 nm). Comparison with a the-oretical black body spectrum suggests that the measured spectrum lies mostly on the short wavelength side relative to the peak of the black body curve. Depending on the power level, the spectrum appears to follow part of the blackbody spectrum corresponding to a body tem-perature in the range 2329–2953 K,Fig. 13(a). The sharp drop at the
[image:7.595.55.548.57.217.2] [image:7.595.43.285.264.374.2]long wavelength end of the spectrum inFig. 13(a) appears to be ab-sorption due to water vapour within the laboratory: the same effect produces a dip centred on 1.13μm in the AM1.5 solar spectrum, Fig. 13(b).
The spectrum cannot completely follow the theoretical black body curve because the light from thefilament passes through the bulb’s quartz envelope and then thefloodlight cover glass. The quartz will block wavelengths longer than about 3600 nm and must itself emit radiation corresponding to its temperature (typically 810 K, Wikipedia). The glass cover on thefloodlight housing will block wa-velengths longer than about 2800 nm but will be hot enough to re-emit some long wavelength IR in this region. An analysis based on the as-sumption that the radiation follows a black body spectrum may how-ever give a useful indication of absorption trends that will influence collector efficiency and cover glass temperature.
To put these spectra in context the AM1.5 standard solar spectrum, representative of midday illumination in temperate latitudes, resembles part of a 5120 K black body spectrum,Fig. 13(b). The black-body re-gions below 300 nm and above 4000 nm that are absent in the AM1.5 spectrum contain less than 3% of the black body power; another dif-ference is that AM1.5 lies slightly below the black body curve in the UV and IR regions and has a number of deep absorption troughs.
Wien’s law defines the peak wavelength as λmax=Tb. The peak wavelength for a 2870 K spectrum (to give 1000 W/m2) is therefore approximately 78% longer than in a 5120 K spectrum.
23.7°C 43.8°C
24 26 28 30 32 34 36 38 40 42
28.1°C 40.1°C
30 32 34 36 38 40
SP01*: 36.7 SP02
SP03*SP04*
SP05
SP06 SP07*
SP08 SP09
SP10*
Fig. 11.(a) Solar collector during the pre-heating phase (fluid cooling as it loses heat to the enclosure). The Tyfocor enters theflooded panel at bottom right; arrows show theflow direction as it enters and leaves eachflooded section. The higher temperature region is where the collector to glass gap is smallest, leading to increased conduction when at ambient pressure. (b) image sampling points, showing thermocouple locations, pillar array and Scotch tape.
29.1°C 46.0°C
30 32 34 36 38 40 42 44
“Distant” thermocouple
Pillar-end thermocouple
[image:7.595.74.523.568.720.2]Fig. 12.IR temperatures (599) 2 min after end of illumination. The high emissivity of the epoxy and Scotch tape makes these regions brighter than the surrounding glass despite the local uniformity in temperature (as determined by spot temperatures in ResearchIR®, omitted here for clarity).
Fig. 13.(a) Black body spectra compared with spectrometer data for various bulb input power levels. 1287 W corresponds to a mean illumination of 1000 W/m2, the highest used in solar
panel testing. (b) Comparison of blackbody spectra (scaled to 1 W total power) and AM1.5 standard solar spectrum.
R.W. Moss et al. Solar Energy 159 (2018) 234–242
5.2. Interaction of illumination spectra with coating and glass absorbance
Fig. 14(a) shows the integrated area under each spectrum as a cu-mulative power fraction. The AM1.5 spectrum has approximately 45% of its total energy in the visible and UV range; the 3000 K spectrum has only 8.3% in this range i.e. a larger proportion lies in the infra-red.
Fig. 14(b) compares typical absorption spectra for a modern pro-prietary solar collector coating (Tinox, 2017), a traditional coating (black chrome,McDonald, 1975) and for a 4 mm thick sheet of BK7 glass. BK7 is a clear optical“crown”glass; a low iron soda-lime glass such as Pilkington’s Optiwhite is not expected to differ significantly from this curve. The sensitivity of the CMP11 pyranometer (dashed line) shows the rapid roll-offin response beyond 2800 nm due to the glass cover over the sensing element.
When testing solar collectors, the efficiency can be characterised in terms of the Hottel-Whillier-Bliss equation
= − −
η τα U T T
G
( )
L pm a
T
ταis the effective glass transmittance-collector absorbance product,
ULis the heat loss coefficient andTaandTpmare the ambient and plate mean temperatures. The peak efficiency occurs at when the plate is at ambient temperature and is simplyη=τα.
The parameterταis a function of the spectral distribution.Table 1 shows the predictedταproduct for two different coatings subject to two different spectral distributions; the absorbance of each surface in iso-lation is included for comparison. To simplify comparisons with ex-perimental data in due course the glass has no anti-reflection coating.
Theταproduct is a function of cover glass external transmittance and reflectanceτ ρe e, and the collector plate coating absorbanceα eval-uated as a power-weighted mean over the spectrum. At each wave-length the radiation absorbed by the plate is the sum of the direct il-lumination and any radiation that is reflected back by the glass:
= ⎡ ⎣ ⎢ − − ⎤ ⎦ ⎥
τα λ τ α
ρ α
( )
1 ( (1 )) . e
e λ
The “true” meanτα value for each spectrum is obtained by nu-merical integration, =∫=∫
∞
= ∞
τα I λ τα λ λ
I λ λ ( ) ( )d
( )d
λ
λ 0
0
whereI λ( )is the spectral den-sity distribution. The “apparent” mean τα, by comparison, is scaled using the radiant power as measured by the pyranometer:
=∫ ∫ = ∞ = ∞
τα|ap
I λ τα λ λ I λ S λ λ ( ) ( )d
( ) ( )d
λ
λ 0
0
whereS λ( )is the pyranometer spectral sensi-tivity.
The radiation absorbed by the glass is the sum of the direct and
reflected components at each wavelength: = + − −
− −
(
)
αg overall αe
τ ρ α
ρ α
,
1 ( )(1 )
1 ( (1 ))
e e a
e a
whereα ρ τe e e, , are the total external absorbance, reflectance and trans-mittance of the glass by itself andαais the absorber’s absorbance. These are calculated from the internal properties using = −
− τe f1(1( )frr)
2 2,
= + −
−
(
)
ρe r f r
fr
1 (1 2 )
1 ( )
2
2 andαe+ρe+τe=1 wherefis the internal trans-mittance.Polyanskiy (2017)provides refractive indexnand extinction coefficientkdata for low iron soda-lime glass based onRubin (1985). These allow normal incidence reflectivity and internal transmittance to be calculated using the Fresnel equation, = −
+
( )
r n n 1 1 2andf=e−πkxλ 4
. The difference in energy absorbed with and without a glass cover (e.g. 0.877 versus 0.952 for Tinox with the AM1.5 spectrum) illustrates the benefit that can be obtained by using anti-reflection coatings.
Table 1suggests that for the case of a cover glass over a black chrome plated absorber, 12.5% of the black body spectrum should be absorbed in the glass; for comparison, the transient heating test in-dicates that 145 W/m2was absorbed when the apparent (pyranometer) illumination level was 1000 W/m2. The pyranometer however only detects wavelengths shorter than 2800 nm and these are not sig-nificantly absorbed in the glass, according to the transmissivity test.
5.3. Interpretation in terms of spectral distribution and total illumination power
The transient test data suggests that the total power incident on the cover glass is approximately 1000+145=1145 W/m2 of which
=12.7% 145
1145 is absorbed by the glass. This agrees well with the 12.5%
predicted by the black-body calculations, particularly given that the calculation is based on a nominal black-chrome absorbance curve
Fig. 14.(a) Comparison of cumulative power fraction against wavelength for solar AM1.5 and 2869 K black body spectra, (b) Nominal absorbance (emissivity) spectra for a commercial coating (Tinox Energy™), black chrome (McDonald, 1975) and internal absorbance for an optical glass (BK7 from SPIE (2000), scaled to 4 mm thickness).
Table 1
Comparison of selective coatings and a typical collector cover glass in terms of fraction of spectral energy absorbed (αorτα). Spectral reflectance curves for black chrome were taken fromMcDonald (1975).
Illumination AM1.5 2869 K black body (1000 W/m2)
rather than measurements on the experimental absorber. It does not indicate that the IR part of the spectrum actually follows a black body distribution; indeed, the fact that thefloodlight cover glass must block the transmission of wavelengths > 3600 nm and re-emit that energy as black-body radiation at longer wavelengths implies that there will be a spectral peak further in the infra-red as well as the main one around 1100 nm. If for instance the floodlight cover glass were at 180 °C (453 K) it would produce a secondary black body peak at 6400 nm.
Fig. 15showsfloodlight glass and housing temperatures when op-erating at full power (420 W). The mean radiative temperature in this image is4TK4 =450 K. The light inFig. 15was pointing horizontally; when facing downwards in the simulator the glass might be hotter due to reduced convection. The camera is not sensitive to visible light and showed no sudden change in temperature at the instant when the light was turned off.
This input power per lamp in the simulator would provide an illu-mination of 1340 W/m2(asFig. 6) and, assuming linear scaling, the IR
power absorbed in the glass would be approximately
× ≈
1.34 145 194 W/m2.
Modelling the radiative heat exchange between the 0.47 × 0.47 m collector and the combinedfloodlights (0.28 × 0.36 m) in terms of an isolated coaxial pair of parallel disks (Incropera and DeWitt, 2002) spaced 1.73 m apart, the power absorbed in the collector cover glass would be 17.8 W/m2. The expected mean dissipation of 194 W/m2 would be achieved with a spacing of 0.44 m. This illustrates the effect of the light tube in enhancing radiant heat transfer betweenfloodlight and collector cover glass in addition to increasing the optical brightness as shown inFig. 7.
The difference in energy absorbed with the two different spectra (e.g. 0.789 versus 0.672 for the black chrome coating, 2869 K versus AM1.5,Table 1) shows that the measured efficiency of a solar collector will depend on the spectrum of the light. For the quartz-halogen bulbs used in this simulator a variation in equivalent black body temperature over the illumination range used for collector testing (2329–2953 K) could be expected to makeταvary from 0.604 to 0.68,Table 2.
When testing solar collectors under this simulator a cooling fan is usually used to maintain the glass at a temperature slightly above ambient. Heat absorbed in the glass from the far-IR part of the spectrum is therefore lost to atmosphere rather than increasing the heat uptake in the heat transferfluid; the enclosure cover glass is, essentially, acting as its own“cold-sky”filter. It is therefore logical to calculate the collector efficiency based purely on the pyranometer measurements of radiant power (Gpyr) without adding an extra power term for the long wave-length component.
This“apparent”efficiency is thus:
= − −
η G τα U T T
G
( )
. ap
T L pm a
pyr
The maximum efficiency, whenTpm=Ta, is simply (τα)ap=G ταGTpyr.
Table 2shows that this varies very little (0.811 to 0.807) over black body spectral temperatures of 2329 to 2869 K; the 2953 K result is for reference only with thefloodlights operating at maximum power. The efficiency obtained in the simulator is likely to be 1% (=0.808–0.798) higher than if the collector were tested under a genuine AM1.5 spec-trum.
It has been assumed that with an evacuated solar collector the heat loss coefficientULis sufficiently low that the cover glass would, with solar illumination, remain close to ambient temperatures. If this con-dition is satisfied the exact glass temperature achieved by the cooling fan is not of great importance: with UL= 1 W/m2, for instance, a change in glass temperature of 1 °C would only lead to a 0.1% change in collector efficiency.
Table 2also shows that there would be only a small difference be-tween the two definitions ofτα(0.789 versus 0.798) if the illumination followed the AM1.5 spectrum.
The difference is more marked when using longer wavelength illu-mination e.g. 0.672 versus 0.807 for a 2869 K spectrum. This implies that in the absence of a“cold sky”IRfilter the solar collector efficiency as measured by any simulator with halogen bulb illumination could depend both on the spectrum and the sensitivity range of the pyr-anometer used. The combination described here however with a CMP-11 pyranometer appears to be relatively unaffected by this potential problem.
Further development of this simulator may include a cold sky IR filter and replacement of the quartz-halogen floodlights with LED or halide discharge lamps to reduce uncertainties due to spectral effects. An alternative approach might be to direct cooling air over thefl ood-lights: if the glass covers were kept cooler there would be less far-IR radiation. The analysis presented here however indicates that even in its present state it is capable of producing high accuracy measurements of vacuum collector efficiency.
6. Conclusions
A solar simulator for testing evacuatedflat plate collectors has been designed, built and commissioned. Multiple virtual images of the ha-logenfloodlights from reflections in the walls of a light tube ensure uniform illumination over the target area. The light tube is 40% wider than the solar collector to avoid edge effects due to the access gap (40% of collector width) between the tube and the collector.
The standard deviation in illumination over the collector area when using all four lamps was 5.3% of the mean level. The spectrum over visible and near IR wavelengths resembles black-body spectra corre-sponding to temperatures between 2950 and 2330 K. At longer wave-lengths there will be a secondary peak due to emission from the floodlight cover glasses.
Thermocouple readings during initial transient testing of a solar collector under 1000 W/m2illumination showed that the cover glass was absorbing 145 W/m2 of radiation. Infra-red images confirm that this is representative of the overall glass rather than a localised effect around each thermocouple. There is however a small local effect. The thermocouples are approximately 1 °C hotter than the glass and when the illumination is removed the thermocouples rapidly revert to the glass temperature, the time constant being approximately 12 s.
This absorbed radiation is predominantly at wavelengths too long to be detected by the pyranometer because this spectral region is absorbed by the pyranometer’s glass dome. For the combination of collector cover glass and pyranometer used here, the absorption effects largely cancel so there is little impact on the measured collector efficiency. The effect is small because heat transfer coefficients are much lower within the evacuated collector than externally: heat absorbed by the cover glass is therefore largely lost to the environment rather than the col-lector.
Fig. 15.IR photograph offloodlight operating at 420 W (temperature °C). Emissivity
=
ε 0.92was assumed.
R.W. Moss et al. Solar Energy 159 (2018) 234–242
When comparing efficiency data for solar collectors tested under different simulators the illumination spectra should be taken into con-sideration. If the illumination spectrum extends further into the infra-red than the pyranometer sensitivity range the apparent illumination level will depend on both the spectrum and the pyranometer model. The provision of a more realistic solar spectrum than that from halogen lamps or an infra-redfilter is desirable to avoid the need for a detailed analysis of this kind.
Acknowledgements
This collaborative programme between Warwick, Loughborough and Ulster universities was supported by the Engineering and Physical Sciences Research Council (EPSRC), reference EP/K009915/1, EP/ K010107/1 and EP/K009230/1. Matlab figures and code used in the production of this paper are openly available from http://wrap. warwick.ac.uk/id/eprint/89677.
References
Bazzi, A.M., Klein, Z., Sweeney, M., Kroeger, K.P., Shenoy, P.S., Krein, P.T., July/August 2012. Solid-state solar simulator. IEEE Trans. Ind. Appl. 48 (4), 1195–1202.
Bliss, M., Betts, T.R., Gottschalg, R., 2009. An LED-based photovoltaic measurement system with variable spectrum andflash speed. Sol. Energy Mater. Sol. Cells 93, 825–830.
Codd, D.S., Carlson, A., Rees, J., Slocum, A.H., 2010. A low cost highflux solar simulator. Sol. Energy 84, 2202–2212.
Dibowski, G., Eber, K., 2017. Hazards caused by UV rays of xenon light based high performance solar simulators. Safety and Health at Work.
Dong, X., Sun, Z., Nathan, G.J., Ashman, P.J., Gu, D., 2015. Time-resolved spectra of solar simulators employing metal halide and xenon arc lamps. Sol. Energy 115, 613–620.
Ekman, B.M., Brooks, G., Rhamdhani, M.A., 2015. Review development of highflux solar simulators for solar thermal research. Sol. Energy Mater. Sol. Cells 141, 436–446.
Grandi, G., Ienina, A., Bardhi, M., 2014. Effective low-cost hybrid LED-halogen solar si-mulator. IEEE Trans. Ind. Appl. 50 (5) [Sept/Oct].
Henshall, P., Eames, P., Arya, F., Hyde, T., Moss, R., Shire, S., 2016. Constant temperature induced stresses in evacuated enclosures for high performanceflat plate solar thermal collectors. Sol. Energy 127, 250–261.
Incropera, F.P., DeWitt, D.P., 2002. Introduction to Heat Transfer. Wiley.
Jang, S.H., Shin, M.W., 2010. Fabrication and thermal optimization of LED solar cell simulator. Curr. Appl. Phys. 10, S537–S539.
Kohraku, S., Kurokawa, K., 2006. A fundamental experiment for discrete-wavelength LED solar simulator. Sol. Energy Mater. Sol. Cells 90, 3364–3370.
Kolberg, D., Schubert, F., Klameth, K., Spinner, D.M., 2012. Homogeneity and lifetime performance of a tunable close match LED solar simulator. Energy Proc. 27, 306–311.
http://dx.doi.org/10.1016/j.egypro.2012.07.068.
Kreuger, K.R., Lipiński, W., Davidson, J.H., 2013. Operational Performance of the University of Minnesota 45 kWe High-Flux Solar Simulator. ASME J. Solar Energy Eng. 135/044501 (Nov).
McDonald, G.E., 1975. Spectral reflectance properties of black chrome for use as a solar selective coating. Sol. Energy 17, 119–122.
Meng, Q., Wang, Y., Zhang, L., 2011. Irradiance characteristics and optimization design of a large-scale solar simulator. Sol. Energy 85, 1758–1767.
Plyta, F., 2015. Optical Design of a Fully LED-Based SOLAR simulator. PhD thesis. Loughborough University. http://ethos.bl.uk/OrderDetails.do?uin=uk.bl.ethos. 674610?.
Polyanskiy, M., Refractive Index Info websitehttps://refractiveindex.info/?shelf=glass& book=NSG-multipurpose&page=Pilkington-Optiwhite(accessed 1/3/2017).
Rubin, M., 1985. Optical properties of soda lime silica glasses. Sol. Energy Mater. 12, 275–288.
Sarwar, J., Georgakis, G., LaChance, R., Ozalp, N., 2014. Description and characterization of an adjustableflux solar simulator for solar thermal, thermochemical and photo-voltaic applications. Sol. Energy 100, 179–194.
Shatat, M., Riffat, S., Agyenim, F., 2013. Experimental testing method for solar light si-mulator with an attached evacuated solar collector. Int. J. Energy Environ. 4 (2), 219–230.
Schubert, F., Spinner, D., 2016. Solar simulator spectrum and measurement uncertainties. Energy Proc. 92, 205–210.
Simon, F.F., 1976. Flat-plate solar-collector performance evaluation with a solar simu-lator as a basis for collector selection and performance prediction. Sol. Energy 18, 451–466.
Tinox Energy™websitehttp://www.almecogroup.com/en/pagina/53-tinox-energy-cu
[image:10.595.37.289.116.157.2](accessed 1/3/2017).
Table 2
Predicted variation in(τα)with equivalent black body temperature for a black chrome plated absorber under uncoated glass. The“apparent”ταvalues are referred to the ap-parent illumination power as measured by a pyranometer instead of the total spectral power and indicate the peak solar collector efficiency that would be expected from a simulator test.
Black bodyT(K) 2329 2560 2691 2869 2953 5120 AM1.5
τα 0.604 0.638 0.654 0.672 0.680 0.743 0.789