Journal of Geophysical Research: Space Physics
Two-dimensional numerical simulation of
O
-mode to
Z
-mode
conversion in the ionosphere
P. D. Cannon1, F. Honary1, and N. Borisov2
1Space and Planetary Physics (SPP) Group, Department of Physics, Lancaster University, Lancaster, UK,2Institute of
Terrestrial Magnetism, Ionosphere and Radio Waves Propagation (IZMIRAN), Troitsk, Russia
Abstract
Experiments in the illumination of theFregion of the ionosphere via radio frequency waves polarized in the ordinary mode (O-mode) have revealed that the magnitude of artificial heating-induced effects depends strongly on the inclination angle of the pump beam, with a greater modification to the plasma observed when the heating beam is directed close to or along the magnetic zenith direction. Numerical simulations performed using a recently developed finite-difference time-domain (FDTD) code are used to investigate the contribution of theO-mode toZ-mode conversion process to this effect. The aspect angle dependence and angular size of the radio window for which conversion of anO-mode pump wave to theZ-mode occurs is simulated for a variety of plasma density profiles including 2-D linear gradients representative of large-scale plasma depletions, density-depleted plasma ducts, and periodic field-aligned irregularities. The angular shape of the conversion window is found to be strongly influenced by the background plasma profile. If theZ-mode wave is reflected, it can propagate back toward theO-mode reflection region leading to resonant enhancement of the electric field in this region. Simulation results presented in this paper demonstrate that this process can make a significant contribution to the magnitude of electron density depletion and temperature enhancement around the resonance height and contributes to a strong dependence of the magnitude of plasma perturbation with the direction of the pump wave.1. Introduction
The use of high-power radio frequency (RF) transmitters to perturb the Earth’s ionosphere gives a unique opportunity to study the complex and often nonlinear mechanisms that underpin the interaction between an electromagnetic (EM) wave and ionospheric plasma. The ionosphere can be treated as a vast plasma labora-tory, in which experiments can be performed without the limited spatial scale size and chamber edge effects one may encounter while performing plasma experiments in a laboratory. Experiments in the illumination of theFregion of the ionosphere via RF waves polarized in the ordinary mode (O-mode) have resulted in the observation of a wide range of nonlinear thermal phenomena associated with the excitation of plasma waves and instabilities [Robinson, 1989;Rietveld et al., 2003]. Many of these processes can induce significant enhance-ments of the electron temperature around the region in which the EM wave most strongly interacts with the plasma [Gordon and Carlson, 1974;Meltz et al., 1974;Djuth et al., 1987;Stocker et al., 1992;Honary et al., 1993]. Substantial changes to the electron density have also been commonly observed on a variety of different spa-tial scales, from large-scale density depletions spanning several kilometers [Gurevich et al., 2002] to small-scale irregularities aligned with the geomagnetic field and having transverse scale sizes ranging from a few meters down to a few centimeters, as detected by rockets and VHF-UHF backscattering [Kelley et al., 1995].
The main processes driving the enhancement of electron temperature in ionospheric modification experi-ments involve the excitement of large-amplitude plasma waves below theO-mode refection height where the frequency of the incident pump wave is close to the local upper hybrid (UH) wave frequency. In this region, provided that the pump frequency is not close to an electron gyroharmonic [Rao and Kaup, 1990;Stubbe et al., 1994], electrostatic (ES) UH waves propagating in a direction perpendicular to the geomagnetic field are readily excited [Wong et al., 1981;Dysthe et al., 1982;Antani et al., 1996]. ES waves of this nature induce the formation of striations in the electron density profile, elongated along the magnetic field direction and with a comparatively small-transverse scale size. The region of interaction is initially narrow but broadens as the striations grow with time. In the stationary state, the vertical scale of this region is several kilometers [Borisov and Robinson, 2003]. Explosive heating of electron gas local to the striations then proceeds via the nonlinear resonance instability [Gurevich et al., 1995, 2001;Gondarenko et al., 2005], as incident pump wave electric field
RESEARCH ARTICLE
10.1002/2015JA022105
Key Points:
• Two-dimensional numerical simulation ofO- toZ-mode wave conversion during ionospheric modification
• Angular shape of conversion window influenced by background electron density profile
• Plasma temperature and density perturbation dependent on incident pump wave direction
Correspondence to:
P. D. Cannon,
Citation:
Cannon, P. D., F. Honary, and N. Borisov (2016), Two-dimensional numerical simulation ofO-mode toZ-mode conversion in the ionosphere,J. Geophys. Res. Space Physics,121, 2755–2782, doi:10.1002/2015JA022105.
Received 30 OCT 2015 Accepted 14 FEB 2016
Accepted article online 17 FEB 2016 Published online 22 MAR 2016
©2016. The Authors.
becomes trapped in the density depletions and amplified through efficient excitation of further UH modes. Collisional damping of the trapped waves is highly efficient within the striations and leads to an increase in the local plasma temperature and consequently to an increase in the electron density depletion within the irregularities. As the striations deepen, the efficiency of trapping increases, and leads to a rapid, nonlinear increase in the electron temperature around the UH resonance height.
The formation of small-scale density irregularities reduces the average electron plasma density around the UH resonance region and leads to a focusing of the pump wave and thus to a further enhancement of theE
field amplitude in this region [Gurevich et al., 2001;Gondarenko et al., 2003]. Self-focusing of this nature results in further nonlinear enhancement of the electron temperature and causes the evolution of a hierarchy of density-depleted structures around theO-mode reflection height, from the small-transverse-scale (1–10s of meters) striations associated with the resonance (thermal parametric) instability to self-organized bunches of striations forming duct-like density-depleted structures due to the self-focusing instability spanning up to many kilometers in transverse scale [Gurevich et al., 1998]. Close-packed duct-like structures of this nature are known to form large-scale semipermanent density-depleted regions or duct-like channels which may affect wave propagation.
Observations have revealed that the magnitude of such artificial heating-induced perturbations to the plasma density depends strongly on the inclination angle of the RF pump beam, with a greater modification to the plasma observed when the heating beam is directed away from the vertical direction toward the magnetic zenith, as reported, for example, byHonary et al.[2011],Kosch et al.[2000], andPedersen et al.[2003]. This magnetic zenith effect has been observed as an increase in electron temperature enhancement by a factor of 2 or greater compared to off-zenith operation [Rietveld et al., 2003;Dhillon and Robinson, 2005] and has also been seen to correspond to a greater enhancement in the characteristic ion and electron plasma lines seen in UHF incoherent scatter radar spectra and an increase in the backscatter power due to field-aligned irregularities.
To explain theoretically the unexpected electron temperature and optical emission enhancements arising due to heating directed along the magnetic zenith direction, the self-focusing instability was first suggested as the mechanism behind this effect [Gurevich et al., 2002, 2005]. The timescale for this process to manifest is known to be long (of the order of 1 min). The experiments recently performed byHonary et al.[2011] demon-strated that the rise of electron temperature occurs on a much more rapid timescale (of the order of a few seconds; comparative to the rise time of field-aligned striations). Instead,Honary et al.[2011] proposed that this aspect-angle dependence of heating is in part due to theO-mode toZ-mode (slow branch of the extraor-dinary mode) conversion process that can occur in theFregion of the ionosphere for a narrow window of pump wave inclination angles. TheZmode is able to penetrate to altitudes above theO-mode reflection height, where the conversion of EM waves trapped in field-aligned irregularities to plasma modes is more effi-cient. This leads to a more rapid development of the resonance instability and potentially a greater magnitude of electron temperature enhancement.
To fully understand the fundamental wave interaction process involved in theO-mode toZ-mode conver-sion process, it is useful to augment experimental findings with accurate numerical simulations. Ionospheric plasma processes have previously benefited from investigation using full-wave numerical simulation codes, for example, as reported byGondarenko et al.[2003] who used an alternating direction implicit model to simu-late linear mode conversion processes,Eliasson and Stenflo[2008] who studied the parametric decay instability and the generation of Langmuir turbulence around the interaction height using a generalized Zakharov model, orLeyser and Nordblad[2009] andNordblad and Leyser[2010] who simulated theZ-mode pumping of a nonlinear density ducts such as that formed via the self-focusing instability using ray tracing coupled with a Runge-Kutta scheme. In this paper, a recently developed full-wave finite-difference time-domain (FDTD) code [Cannon and Honary, 2015] is used to study this conversion process in two spatial dimensions, allowing the variety of background density scenarios to be investigated. Time-dependent on-grid updates to the plasma density and temperature included in the FDTD algorithm meant that the impact ofO- toZ-mode conversion on the growth of thermal-scale plasma perturbations could be simulated.
Journal of Geophysical Research: Space Physics
10.1002/2015JA022105
modified by the presence of plasma density features of varying scale sizes, such as density-depleted ducts or striations. Section 4 presents the results of full-wave plasma simulations demonstrating that the excitation and subsequent reflection of theZ-mode wave has a strong influence on the magnitude of heating-induced effects such as temperature enhancement developed around the interaction region. Simulations of plasma heating experiments for a range of pump wave launch angles show that theO-mode toZ-mode conver-sion process is a key mechanism contributing to the observed magnetic zenith effect. In section 5 the effects of adding density-depleted plasma irregularities are investigated, with the influence of this process on the enhancement of electron temperature demonstrated to be heavily dependent on both pump wave inclination angle and irregularity characteristics.
2. Methodology
To numerically simulate an ionospheric modification experiment, this study uses the GPU-accelerated FDTD code described and validated inCannon and Honary[2015]. The FDTD method, first proposed inYee[1966], has an advantage over many other numerical simulation techniques as it deals with complex, nonlinear, and impulsive interactions in a natural and time-explicit manner, avoiding complex and computationally inten-sive linear algebra calculations. FDTD is a particularly useful tool for geophysical modeling due to the fact that the grid-based structure allows medium properties such as plasma density or temperature to be defined separately at each point. The algorithm used here assumes a multifluid description of a dynamic, anisotropic, collisional plasma, in which electron or charged ion species are treated as individual fluids of continuous mass and charge. The effect on wave propagation due to the presence of plasma is introduced through the cou-pling of Maxwell’s wave equations with the Lorentz equations of motion for each constituent plasma species, with anisotropy introduced through inclusion of a static externally applied magnetic field in a manner sim-ilar to that described byYoung[1994] orYu and Simpson[2010]. The time-dependent variation of plasma temperature and density are treated by the inclusion of expressions for the dynamic behaviors of small per-turbations of the plasma fluid temperature and density [Gurevich, 1978]. Together, these form a set of coupled first-order partial differential equations which govern the time-dependent behavior of the EM wave and plasma medium:
𝛁×E= −𝜇0𝜕H
𝜕t (1)
𝛁×H−∑ a
NaeaUa=𝜀0𝜕
E
𝜕t (2)
Nama 𝜕Ua
𝜕t =Naea(E+Ua×B) −Nama𝜈aUa−𝛁(kBNaTa) (3)
𝜕Na
𝜕t + ∇⋅(NaUa) =0 (4)
3 2kB
𝜕
𝜕t(NaTa) +𝛁⋅Qa−NaeaE⋅Ua−△𝜀a=0. (5)
In these expressions, subscriptarefers to plasma component species.Uis the time-varying fluid bulk velocity vector,B=Bb̂is the static background magnetic field,TandNare the plasma temperature and number den-sity, respectively,𝛁⋅Qdescribes the heat flux transport,△𝜀is a collisional heating term,eaandmarefer to particle charge and mass, respectively,𝜀0and𝜇0are the permittivity and permeability of free space respec-tively, andkBis the Boltzmann constant.𝜈represents the effective collision frequency given by equation (6) [Gondarenko et al., 2005]:
𝜈(N,T) =𝜈0 ( N N0 ) ( T T0
)−3∕2
, (6)
where𝜈0,N0, andT0are the unperturbed effective collision frequency, number density, and temperature,
with the neutral background species, such that𝜈e = 𝜈ei+𝜈enand𝜈i = 𝜈ie+𝜈in, where𝜈ei,𝜈ie,𝜈en, and𝜈in
are the electron-ion, ion-electron, electron-neutral, and ion-neutral collision frequencies, respectively. In the simulation studies described below, the undisturbed collision frequencies𝜈0were chosen to represent
typ-ical conditions in theFregion at Tromsø, and updated every time step via equation (6) to reflect simulated perturbations to the plasma medium. Simulated fields are updated sequentially via a leapfrog time-stepping scheme, following the cyclical update pattern:Eq→Tq→Hq+12 →Uq+12 →Nq+1→Eq+1→…HereE,H,U,
T, andNrepresent the simulated electric field, magnetic field, fluid velocity, plasma temperature, and density, respectively. The indexqrefers to the simulation time step number. The inclusion in the time-stepping algo-rithm of on-grid updates to perturbations of the plasma medium allows nonlinear plasma processes such as the resonance instability or self-focusing instability to develop naturally in the simulation volume.
3. Numerical Simulation of Radio Window
A vital process in understanding the magnetic zenith effect is thought to be the transition fromO-mode polar-ized pump wave to aZ-mode (slow branchX-mode) wave that may occur as the pump wave approaches the interaction height [Mjølhus and Fl˙a, 1984;Mjølhus, 1990]. This process is highly dependent on the initial inclination angle of the pump wave with respect to the direction of the geomagnetic field near theO-mode reflection point. Conditions most favorable for conversion toZ-mode occur when thekvector of the incident wave is close to being parallel to the geomagnetic field direction at the height at which the transformation takes place (𝜔pe=𝜔0, where𝜔0is the frequency of the pump wave). This condition corresponds to theL-mode wave near thek⟂=0limit of theO-mode dispersion surface; this wave is able to continue beyond𝜔pe=𝜔0on
theZ-mode branch of theX-mode dispersion surface [Leyser and Nordblad, 2009]. The angular dependence leads to the formation of a “radio window” as described in, for example,Mjølhus[1984]: a range of inclination angles for which the pump wave is partially or fully transmitted beyond theO-mode reflection height as a
Z-mode wave. As the direction of the incident wavek-vector is governed by the refractive properties of the local plasma the wave passes through, the spatial profile of ionospheric plasma around the interaction height has a significant influence on the angular position and characteristics of the radio window, and thus on the development of the magnetic zenith effect. A strength of a full-wave numerical code such as that described in section 2 is that it allows wave propagation through plasma to be accurately computed in scenarios for which analytical evaluation may be impossible without resorting to constraining regimes of approximation, for example, those employed by geometric optics or similar [Budden, 1961;Ginzburg, 1970]. The FDTD scheme used here automatically incorporates linear mode conversion processes such as theO-mode toZ-mode tran-sition into the time-domain evolution of the simulated EM fields and the coupled on-grid updates to plasma density and temperature perturbation mean that the time-dependent and nonlinear plasma response to an incident wave is directly included in any calculation. This section presents the results of a series of simulations run using the FDTD code described in section 2 to investigate the effect of different plasma density profiles on the characteristics of the ionospheric radio window.
The simulation was set up as a two-dimensional scenario, with all wave propagation restricted to lie in thexz
plane, and all medium properties assumed to be homogeneous in theydirection. A computational domain of dimensions 1280×1×1280Yee cells [Yee, 1966] was used, with the discrete spatial step size (Δx) set as 5.50m in all directions. To ensure numerical stability the Courant number [Taflove and Hagness, 2000] was chosen to be 0.5, which fixed the size of the discrete time step (Δt) to be 9.17×10⁻⁹s. The simulation was
terminated on all sides by a 32 cell complex frequency-shifted perfectly matched layer (CFS-PML) designed to ensure that any waves leaving the domain were absorbed with the minimum possible numerical reflection [Berenger, 1994]. For the plasma temperature and density, edge termination was achieved using a Neumann boundary condition that set the gradient of each to zero along the direction of the background magnetic field. A wave launching layer based on the principles of the total field scattered-field implementation described in
Schneider[2004] was used to introduce continuous electromagnetic waves ofO-mode polarization into the domain to represent the heating pump wave. The wave frequency was chosen to be𝜔0 = 2𝜋×4.54MHz.
Background plasma parameters were chosen to represent typicalFregion conditions during a heating exper-iment at Tromsø. Typical plasma parameters were obtained using IRI-2012 [Bilitza et al., 2014]. An idealized ionospheric plasma was represented by a 1-D linear vertical electron density profile of the form (7).
N0(z) =Ncrit
(
1+ z−zcrit Lz
)
Journal of Geophysical Research: Space Physics
10.1002/2015JA022105
In this expression,Ncritis the electron density atX =
𝜔2 pe 𝜔2 0
= 1, where𝜔peis the fundamental plasma
fre-quency for electrons.zcritis the distance above the lower edge of the simulation at which the critical density
occurs, here set to be 4.11km above thez = 0plane.Lzis the scale height of the density gradient, set
to be 20 km. The background electron temperature was set to be 1800 K. A population of ions of average mass 16 AMU (representingO+ions) was included with a background density distribution equivalent to that of the electrons to preserve neutrality, and an initialized temperature of 900 K. The unperturbed collision frequencies for electrons and ions were set to be 500 s−1and 6 s−1, respectively. A static magnetic field of
magnitude|B|=4.16×10⁻⁵T was initialized in the domain at an angle of𝛼=12∘to the vertical. This was set to be uniform throughout the simulation domain, hence resulting in electron and ion gyrofrequencies of
𝜔ce=2𝜋×1.17MHz and𝜔ci=2𝜋×39.7Hz, respectively.
To investigate the angular characteristics of theO- toZ-mode conversion process, a set of simulations were performed with the launch angle of the pump wave with respect to the vertical direction,𝜃, varied from𝜃=0∘ (pump wavekvector directed vertically and in this case along the direction of the electron density gradient) to
𝜃=12∘(pump wavekvector along the direction of the simulated geomagnetic field) in△𝜃=0.01rad (0.57∘) steps. The simulations were run for 1×10⁵time steps (equivalent to 9.17×10⁻⁴s), which was a sufficiently
long time for a steadyEfield pattern to develop, but short compared to the timescales required for electron plasma density and temperature perturbations due to the action of the radio wave to develop.
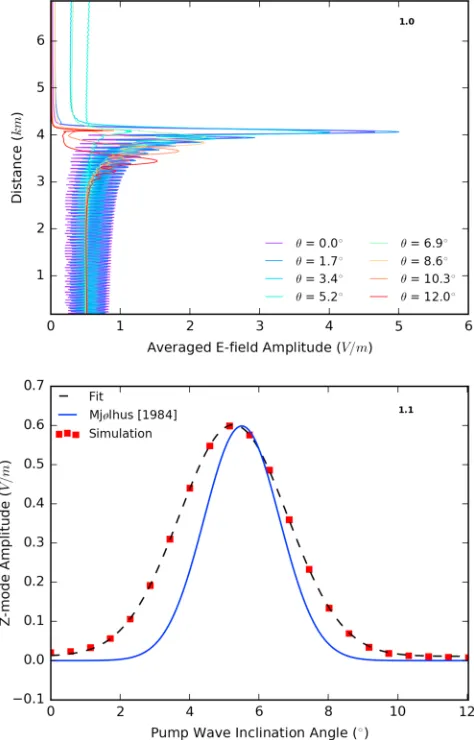
Each trace in Figure 1 (top) shows the time-averagedEfield amplitude measured along the original direction of propagation for a selection of simulated launch angles. In each case, a swelling effect can be seen as the pump wave approaches theXnum=1point atz
cwhere the wave is reflected (Xnumis a numerical equivalent
of variableXwhich takes into account the dispersive and dissipative effects of the discrete computational grid [Cummer, 1997]). At this point theO-mode pump wave is reflected downward, leading to the generation of the large-amplitude standing waves visible in each plot around the interaction height. In most cases it can be seen that little or no wave amplitude is able to penetrate beyond theO-mode reflection point; however, it is apparent that there is a window around 6∘for which propagation to higher altitudes is viable. This window is the range of angles for which mode conversion from the initial ordinary wave to an extraordinary-polarized
Z-mode wave is favorable and corresponds to a set of angles for which thekvector of the incident wave is close to parallel to the local geomagnetic field as the wave reaches the reflection height. The optimal angle for this process to occur in a vertically inhomogeneous ionosphere is given by the Spitze angle (8) and is a function of the plasma medium parameters, whereY= 𝜔ce
𝜔0,𝜔ceis the electron cyclotron frequency and𝛼is
the angle between the local geomagnetic field and the vertical.
𝜃Spitze=arcsin
[( Y
Y+1 )1
2
sin(𝛼) ]
(8)
In the scenario described here, the value of the Spitze angle was calculated to be 5.5∘. The theoretical prop-agation paths for rays of varying inclination angle in the ionosphere can be seen, for example, in Figure 1 of
Isham et al.[2005]. The average fraction of wave amplitude penetrating beyond theO-mode reflection height for each angle is indicated in Figure 1 (bottom) by the red markers and shows a Gaussian-shaped transmis-sion window centered on 5.3∘and with a full width at half maximum of 3.1∘(Gaussian fit is indicated by the dashed black line). The theoretical window for transmission of the EM wave through the reflection barrier via
O-to-Zconversion as calculated by Mjolhus [Mjølhus, 1984] for the density profile used here is indicated by the blue line.
A smallEfield swelling at the reflection height is seen in Figure 1 (top) for waves directed close to the Spitze angle despite theZ-mode conversion efficiency being close to 100%. This is due to a combination of effects: anisotropic divergence in wave direction due to numerical dispersion and the slight spread in propagation angle around the pump wave edges both lead to the reflection of a small fraction of the pump wave.
Figure 1.Angular dependence ofO-mode toZ-mode conversion for linear vertical density gradient. (top)Efield amplitude averaged over9.17×10−4s (1×10⁵time steps) for a selection of inclination angles. Penetration of the
O-mode reflection height 4.1 km above the lower plane of the computational domain can be seen to occur most effectively for angles close to the Spitze at 5.5∘. (bottom) The simulated radio transmission window (red points, dashed black Gaussian fit) and the theoretical prediction fromMjølhus[1984] (blue).
hierarchy of density structures are likely to arise when the ionosphere is illuminated by high-power radia-tion due to the formaradia-tion of plasma irregularities of different scales. In particular, the density gradient in the horizontal direction is unlikely to be homogeneous as assumed in the above analysis.Honary et al.[2011] obtained a theoretical expression for the shift in the radio window from the Spitze angle toward the magnetic zenith; however, this calculation assumed that the ionospheric inhomogeneity existed along one direction only (which in the general case can deviate from the vertical direction). The case of 2-D variation on the plasma density has not been discussed before and can only be investigated numerically.
To this end, the FDTD code was used to investigate the effect that density structures of various spatial scales have on the position of theZ-mode window. Three different inhomogeneity regimes were investigated: large-scale 2-D linear gradients, single field-aligned duct-like density depletions, and periodically arranged smaller-scale field-aligned irregularities.
Journal of Geophysical Research: Space Physics
10.1002/2015JA022105
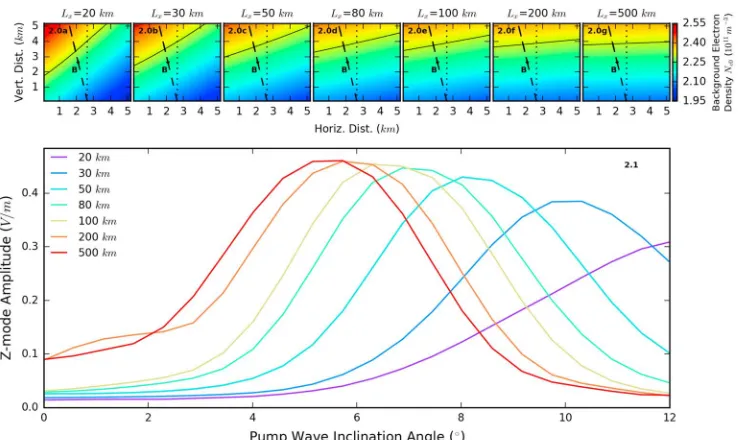
Figure 2.SimulatedZ-mode window for varying horizontal slope scale sizeLxwhen background density profile (9) is used as a background density profile (smallerLximplies a steeper slope). It can be seen that increasing the steepness of the slope shifts the center of the radio window away from the Spitze direction and toward the magnetic zenith. The background plasma density, magnetic field direction (dashed line), vertical direction (dotted line) and position of the
O-mode reflection height (solid black line) used for eachLxare shown in Figure 2 (top).
Δt =4.58×10⁻⁹s andΔ
x =2.75m. All other simulation parameters were set as described above. The full
form of the background density profile in this case is given by equation (9).
N0(x,z) =Ncrit
( 1+ x
Lx ) (
1+z−zcrit Lz
)
(9)
The vertical slope scale size was kept constant atLz = 20km. The position and width of theZ-mode
win-dow was measured for different grades of horizontal slope, changed by varyingLx, with the results shown in
Figure 2. The introduction of a horizontal density inhomogeneity of this form was found to shift the center of the radio window away from the Spitze direction and toward the magnetic zenith direction, with larger shifts experienced as the gradient was increased. The angular width of the window was also found to increase over-all as the horizontal gradient increased, whereas the maximum transmittedEfield amplitude was found to decrease. This result supports the theory that the observed angular position of peak magnetic zenith effect could be explained by the presence of a horizontal density slope. For the vertical plasma gradient used here, a peak in theZ-mode window at around𝜃≃ (8−10)∘would correspond to a horizontal inhomogeneity of aroundLx≃50km. In the auroral ionosphere, horizontal gradients in the opposing direction (increasing from right to left in the simulation domain) may also exist. In this case, the density gradient has the effect of shift-ing the center of theZ-mode window away from the Spitze and toward the vertical direction, again with a greater deviation occurring for a greater steepness of horizontal slope.
To simulate the effects of a duct-like horizontal density feature, a field-aligned density depletion of the form equation (10) was included in the background density profile.
Nirreg(x′,z′) =N0(x′,z′)
[
1−Airregexp
( −(x0−x
′)2
2L2 width
)]
, (10)
wherex′andz′are coordinates perpendicular and parallel to the simulated geomagnetic field,A
irregandLwidth
are the amplitude and width of the irregularity respectively,x0is a reference distance, andN0(x′,z′)is the
ver-tically inhomogeneous background density profile given by equation (7), with the vertical slope scale height kept atLz=20km as before.Airregwas set to be 0.05 to represent a maximum density depletion of 5% of the
background. A smaller computational domain of dimensions 1280×1×1280was used to reduce computing time, with the discrete step sizes set toΔt=9.17×10⁻⁹s andΔ
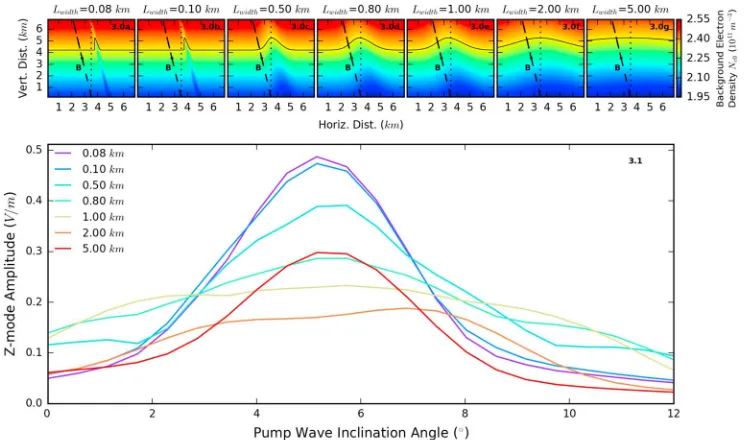
Figure 3.SimulatedZ-mode window for varying duct widthLwidthwhen density perturbation of equation (10) is included in the background density profile. Initial amplitude of perturbation was set as 5% of the unperturbed background density given by equation (7). Smaller-width structures withLwidth≤0.1km can be seen to shift the
distribution away from the Spitze direction toward vertical by (0.5–1)∘. As the irregularity width increases, the window broadens and loses its Gaussian shape. For widths≥0.2km, a significant fraction of incident wave amplitude was transmitted at all sampled angles, leading to a dramatic widening and flattening of the window. The background plasma density, magnetic field direction (dashed line), vertical direction (dotted line) and position of theO-mode reflection height (solid black line) used for eachLwidthare shown in Figure 3 (top).
range of irregularity scale sizes, from small-scale single striations with a width of tens of meters, up to larger ducts with widths of several kilometers. Examples of the 2-D background electron density profiles for a selec-tion ofLwidthcan be seen in Figure 3 (top). The effect of different perturbation widths on the position of the radio window is shown by Figure 3.
The presence of the irregularity was found to have a strong effect on theO- toZ-mode conversion process, with the resulting radio window falling into one of several broad regimes depending on the irregularity width. Smaller-scale irregularities with widths≲0.1km were found to have a minimal effect on theZ-mode window shape, resulting in only a slight shift the radio window away from the Spitze position and toward vertical by (0.5–1)∘measured. For duct widths in this range, the radio window was found to be broader than in the unperturbed case, with a full width at half maximum in the range (4.0–4.5)∘. Increasing the perturbation width in the range 0.1km≲ Lwidth ≲ 2km was found to lead to an abrupt change in radio window shape,
with a significant fraction of incident wave amplitude transmitted as aZ-mode for all sampled angles. This manifested as a broadening of the window as the scale size of the irregularity was increased, with the angular width of the window for a duct of 1 km width almost three times that of the 1-D slope case. Increasing the irregularity width also had the effect of decreasing theZ-mode amplitude at each sampled angle, leading to a flattening of the window. For a 1 km width irregularity, the average amplitude transmitted of theZ-mode less than half that transmitted at the window central angle for the 1-D slope regime. As the irregularity width was increased beyond 2 km, the shape of theZ-mode window was found to tend toward the unperturbed form measured for the case of a linear vertical slope only.
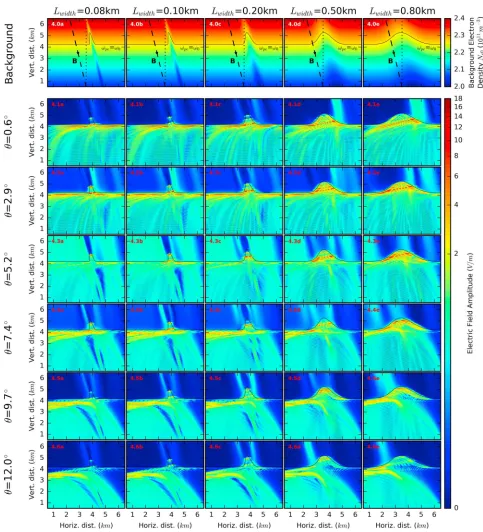
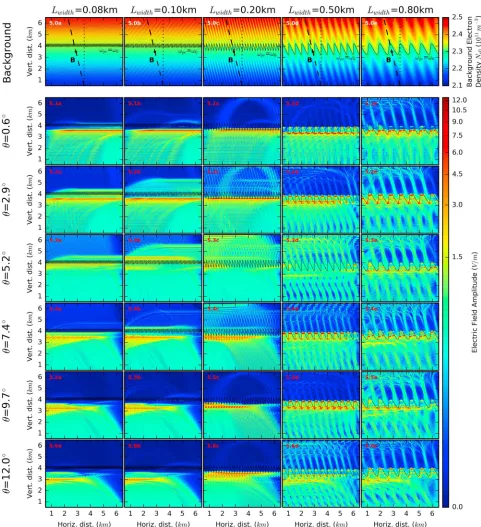
Figure 4 shows theE-filed amplitude developed in the simulation domain and averaged over 9.17×10⁻⁴s
(1×10⁵time steps) for pump wave inclination angles of 0.6∘, 2.9∘, 5.2∘, 7.4∘, 9.7∘, and 12.0∘and for the cases of
Journal of Geophysical Research: Space Physics
10.1002/2015JA022105
Figure 4.Time-averagedEfield amplitude for pump wave inclination angles of 0.6∘, 2.9∘, 5.2∘, 7.4∘, 9.7∘, and 12.0∘when density perturbations of the form equation (10) and withLwidths of 0.08, 0.10, 0.20, 0.50, and 0.80 km are included in the background density profile. The position of theX=1O-mode reflection
contour marked by a solid line. The color range has been logarithmically normalized to more clearly show the transmittedZ-mode waves passing beyond the
is transmitted for all angles shown (albeit emerging from very different points of the duct), leading to the flat, broad window profiles shown in Figure 3. Away from the region around the duct, behavior reverts to that of the unperturbed case described above, with optimalO- toZ-mode conversion occurring at the Spitze angle. Only waves transmitted within a full width of the irregularity central axis were considered when calculating the shape of the window.
The effect of including multiple periodically arranged field-aligned density depletions was investigated by including density irregularities of the form (11) to the background density profile.
Nirreg(x′,z′) =N0(x′,z′)
{ 1−1
2Airreg [
1−cos (
2𝜋x′
Lwidth )]}
(11)
Similarly to the duct-like irregularity simulation above, computational domain dimensions of 1280×1×1280 were used, with the discrete step parameters set toΔt =9.17×10⁻⁹s andΔ
x =5.50m. The vertical slope
scale size was set to beLz=20km as before. Figure 5 shows theE-filed amplitude developed in the simulation
domain and averaged over 9.17×10⁻⁴s (1×10⁵time steps) for pump wave inclination angles of 0.6∘, 2.9∘, 5.2∘,
7.4∘, 9.7∘, and 12.0∘and for the cases of periodic irregularities ofLwidth=0.08, 0.10, 0.20, 0.50, and 0.80 km. As with the single-irregularity case above, theX = 1contour is shown by a solid line and the color bar has been logarithmically normalized to more clearly show any transmitted or trapped waves. The 2-D background electron density profiles for eachLwidthcan be seen in Figure 5 (top). In the case of a single duct the transmitted
Z-mode wave can emerge from either side of the structure, or even multiple points simultaneously, depending on the inclination angle of the source wave, as shown by Figure 4. In the case of periodic structures, this results in a convertedZ-mode potentially entering multiple adjacent irregularities before emerging. This has a strong effect on the propagation of the convertedZ-mode, with transmitted waves multiply scattered by adjacent irregularities making it difficult to measure theZ-mode window shape. In general the scattering effect of periodic irregularities with spatial scales comparable to or smaller than the pump wave wavelength (≤0.08km) had the effect of attenuating the transmittedZ-mode amplitude at all angles while maintaining the angular window shape measured for the unperturbed case. As the irregularity width increased, multiple scattering of theZ-mode wave between adjacent irregularities resulted in the presence of high-amplitudeE
field waves beyond theO-mode reflection height for all sampled pump wave angles. Scattered field beyond the reflection height was found to have amplitudes comparable to that found in the Airy field below the reflection height and in some cases was well in excess of the maximumZ-mode amplitude obtained beyond
X=1for the unperturbed 1-D slope case (shown in Figure 1).
4. Numerical Simulation of Heating Effects
In the previous section, the FDTD code was used to show that theO- toZ-mode conversion process is strongly dependent on the electron plasma profile around the interaction height. In this section, simulation results demonstrating that such behavior can directly lead to an angular dependence in heating-induced effects such as electron temperature enhancement and the growth of density-depleted field-aligned irregularities are presented.
In an idealized heating experiment with a 1-D linear vertical electron density gradient only, anO-mode wave launched at the Spitze angle will be almost fully converted to theZ-mode as it approaches the inter-action height. The converted Z-mode wave passes beyond theO-mode reflection barrier and, provided the ionospheric peak density is sufficiently high, is reflected atX=Y+1. The reflectedZ-mode wave can then freely propagate downward, back toward the interaction region. As it approaches the point where
X= (1−Y2)∕(1−Y2cos2𝛼), close to the O-mode reflection height, the reflectedZ-mode wave encounters the
X-mode resonance layer. This resonance is normally inaccessible to ground-launched fastX-mode waves which are reflected atX=1−Ybut when excited results in the very efficient conversion of the EM wave to upper hybrid plasma waves [Gondarenko et al., 2002]. This process leads to a large increase in theEfield ampli-tude around the interaction region as shown in Figure 6. In this Figure, the time-averagedEfield amplitude measured along the direction of propagation is shown for a selection of inclination angles (panels 6.0–6.4). The simulation parameters described in section 3 for the case of an undisturbed 1-D vertical density gradi-ent were used, along with simple linear background electron and ion density profiles as given by equation (7), withLz=20km. The blue curve showsEfield amplitude for the case when a perfectly matched layer
Journal of Geophysical Research: Space Physics
10.1002/2015JA022105
Figure 5.Time-averagedEfield amplitude for pump wave inclination angles of 0.6∘, 2.9∘, 5.2∘, 7.4∘, 9.7∘, and 12.0∘when periodic density perturbations of the form (11) and withLwidths of 0.08, 0.10, 0.20, 0.50, and 0.80 km are included in the background density profile. The position of theX=1O-mode reflection
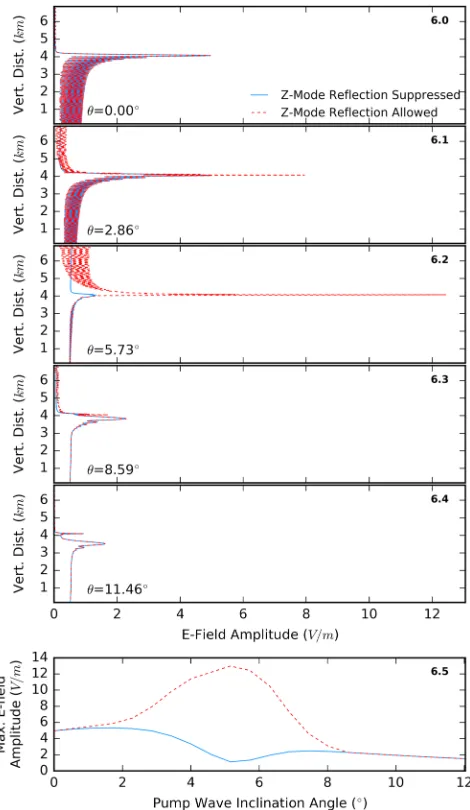
Figure 6.(top) Comparison of theEfield amplitude averaged over1×105time steps (9.17×10⁻⁴s) for the case that
the upward boundary of the computational domain is terminated with an absorbing PML (blue) or a reflecting layer (red-dashed). Traces are shown for a selection of initial pump wave inclination angles. (bottom) The variation of maximum averagedEfield amplitude with inclination angle. It can be seen that allowing theZ-mode wave to reflect enhances the amplification ofEfield around the interaction region, particularly for waves directed toward the center of the radio window around 5.5∘.
its reflection. The dashed-red curve shows the same signal, but for the case that the upper boundary of the simulation was set to be a reflecting boundary to simulate the reflection of theZ-mode wave at higher alti-tudes. A partial reflector was used in preference to a perfect reflector as theZ-mode wave would expect to experience partial attenuation due to collisional damping, particularly as it approachesX=Y+1. The vari-ation in the peakEfield amplitude in the interaction region with pump wave inclination angle between the
Z-mode reflection-allowed andZ-mode reflection-suppressed cases is shown in Figure 6 (bottom). Allowing theZ-mode wave to reflect and propagate back toward the resonance layer was found to lead to a significantly enhanced amplification of theEfield around the interaction region. This effect was particularly pronounced for waves directed toward the center of the radio window at around 5.5∘from vertical, with the maximum magnitude ofEfield amplitude found to be greater than 6 times that developed under similar conditions with
Z-mode reflection suppressed.
Journal of Geophysical Research: Space Physics
10.1002/2015JA022105
temperature and density perturbations in the heated region, two parallel simulations were performed: the first withZ-mode reflection suppressed using a PML layer at the upper boundary of the computational domain and the second withZ-mode reflection allowed through the inclusion of a reflecting boundary as described above. The simulation domain was set up with the smaller dimensions of 896×1×640Yee cells. The smaller size reduced the computing time required to calculate each simulation cycle and allowed longer-duration runs to be performed. The time step size was set to be 1.83×10⁻⁸s. The Courant number was maintained at
0.5 to preserve stability, and the discrete spatial step size set to be 11.0 m in all directions. A vertical gradient (7) was used as the background density profile withLz=20km, andzc=4.46km above the bottom edge of
the simulation box, as indicated the 2-D background density plots shown in Figure 7 (panel 7.0) and Figure 8 (panel 8.0). Initially, no horizontal inhomogeneity was included. For this background density profile, the upper hybrid resonance point occurred at 3.16 km above the bottom edge of the simulation. This domain setup was designed to include the important regions of interaction such as the reflection and upper hybrid reso-nance heights, while keeping the overall domain size small to reduce the computational run time. AnO-mode pump wave of frequency𝜔0=2𝜋×4.54MHz was launched at an angle of 5.16∘from the lower edge of the computational domain. As this inclination angle is close to the center of the radio window, it was expected to lead to efficient conversion of the pump wave to theZ-mode. The beam was given a Gaussian profile to keep most of the source wave energy away from the domain boundaries. All other domain parameters were set as described in section 3 for the case of the undisturbed 1-D vertical density gradient.
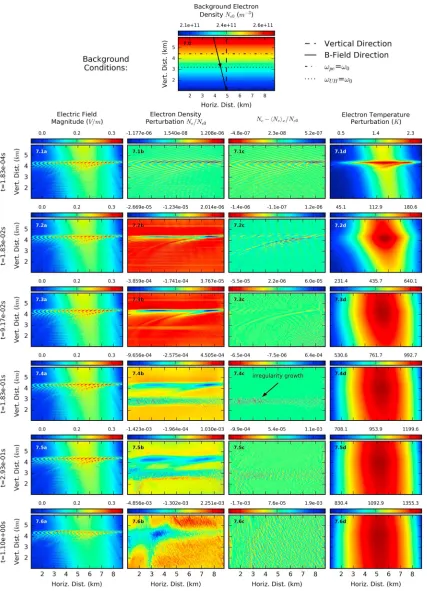
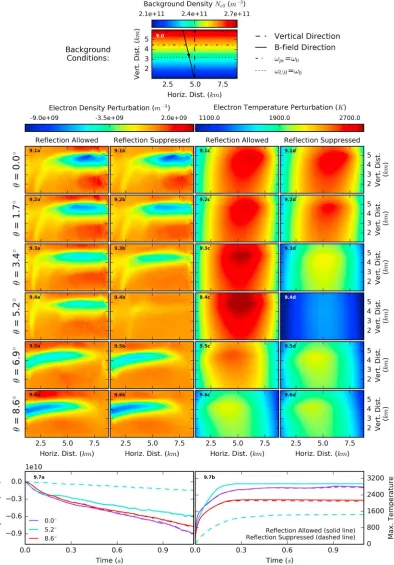
Figures 7 and 8 illustrate the variation ofEfield, electron density perturbation (expressed as a fraction of the background electron density,Ne0), fractional electron density irregularity amplitude𝛿N∕Ne0, and temperature
perturbation evolved in the simulation after 1.83×10⁻⁴s, 1.83×10⁻²s, 9.17×10⁻²s, 1.83×10⁻¹s, 2.93×10⁻¹s,
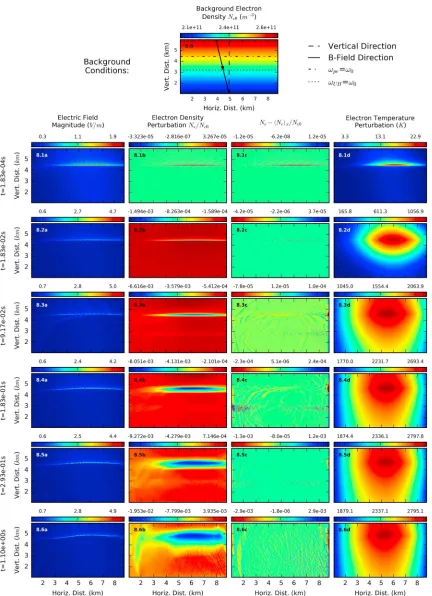
and 1.10 s for the cases ofZ-mode reflection suppressed (Figure 7) and allowed (Figure 8). The irregularity amplitude𝛿Nis calculated by subtracting a local average (taken along the horizontalxdirection) from the electron density perturbation, such that𝛿N=Ne−⟨Ne⟩x. Both figures show a rapid rise of theEfield amplitude at aroundzc=4.46km corresponding to the high-amplitude reflected standing wave, which results in
signif-icant rise of theEfield amplitude and an increase (due to the wave dissipation) of the electron temperature, which saturates after∼0.3s. Allowing theZ-mode to reflect had a significant effect on theEfield strength developed in the simulation, with the saturationEfield amplitude achieved with reflection allowed over 10 times greater than with reflection suppressed. For the case of suppressed reflection, the highest field ampli-tudes were located around the reflection height atzcand remained relatively steady for the duration of the
simulation. By contrast, with reflection allowed,Efield amplitudes of up to 6 V/m were developed and located in a narrow band initially aroundzccorresponding to the location of the resonance. This can be seen to move
upward in altitude with time as the simulation progresses, as shown by panels 8.1-6a of Figure 8. TheZ-mode reflection allowed scenario was found to produce around double the increase in temperature compared to the reflection suppressed scenario. For both reflection suppressed and allowed cases, a strong electron den-sity depletion is observed around the region of interaction. In the reflection-suppressed scenario, this takes the form of a pair of density-depleted patches located on the shoulders of theZ-mode window. The den-sity depletions are correlated with the regions where the pump wave is reflected and the reflection-induced standing wave forms (toward the edges of the beam rather than toward the beam center where theO-mode wave is transmitted as aZ-mode). This suggests that the formation of the density cavities may, in part, be due to a ponderomotive interaction or the excitation of a parametric instability. Around the peak of the win-dow, the EM wave is mostly transmitted as theZ-mode and the swollen-amplitude reflected standing wave does not form; hence, the density in this region is comparatively unperturbed. In the reflection-allowed sce-nario, the density perturbation takes the form of a single density-depleted cavity with a maximum depth of|Nmin
e | ∼ 0.02Ne0. This is greater by almost a factor of 4 than the maximum magnitude of perturbation
observed in the reflection-suppressed simulation. In this case, the site of maximum depletion can be seen to rise in altitude as the simulation progresses. This is caused by the downward travelingZ-mode wave encoun-tering a region of plasma that matches the extraordinary wave resonance conditionX= (1−Y2)∕(1−Y2cos2𝛼)
Figure 7.Change in the simulatedEfield amplitude, electron density perturbation (expressed as a fraction of the background densityNe0), density irregularity amplitude (Ne−⟨Ne⟩x), and electron temperature perturbation with time, when Z-mode reflection was suppressed. Spatial snapshots of each quantity are shown for times1.83×10−4s,1.83×10−2s,9.17×10−2s,1.83×10−1s,2.93×10−1s, and1.10s. The background density profile, geomagnetic field orientation (solid
Journal of Geophysical Research: Space Physics
10.1002/2015JA022105
Figure 8. Change in the simulatedEfield amplitude, electron density perturbation (expressed as a fraction of the background densityNe0), density irregularity amplitude (Ne−⟨Ne⟩x), and electron temperature perturbation with time, when Z-mode reflection was allowed. Spatial snapshots of each quantity are shown for times1.83×10−4s,1.83×10−2s,9.17×10−2s,1.83×10−1s,2.93×10−1s, and 1.10 s. The background density profile, geomagnetic field orientation (solid
An interesting feature to note is the spontaneous formation of small-scale field-aligned density structures visible at after∼ 0.1s in the simulation. These are particularly clear in the plots of the density irregularity amplitude shown by Figure 7, panels 7.4c (in which the features are indicated by an arrow) and 7.5c, and can also be seen for the reflection-allowed case in Figure 8, particularly panels 8.4c and 8.5c. These appear to evolve naturally in the simulation, first appearing in a narrow band located just below the point at which the background upper hybrid frequency matches with the pump wave frequency, and subsequently increase in both depth and elongation with time. At later times they can be seen to bunch together into larger-scale struc-tures. Due to the location and orientation of these structures, it is clear that they are formed in the simulation due to the conversion of the pump wave to upper hybrid waves; the altitude at which the structures initially form is located just below the upper hybrid resonance height where the pump wave frequency matches the upper hybrid frequency, and the structures are exactly aligned along the geomagnetic field direction, con-sistent with a wave propagating in a direction perpendicular to this magnetic field. Changing the position of the upper hybrid resonance height within the computational domain was found to change the position of this feature, with the initial location of the irregularity perturbation consistently found to originate in a band ∼ 400m below the UHR height before extending with time to both higher and lower altitudes along the magnetic field direction.
Resolvable field-aligned density irregularities were visible after as little as 0.1s; this was unexpected as similar structures have been observed experimentally to require timescales of a few seconds or more to develop. This discrepancy may be partly due to the low amplitudes of the simulated irregularities: the maximum density irregularity amplitude developed over the simulation run was only||Ne−⟨Ne⟩x||<0.001Ne0, which may be
dif-ficult to detect experimentally in a real heating experiment. The early onset of irregularity development may also be linked to the numerical noise level in the simulation. The linear mode conversion process understood to govern UH generation from anO-mode pump wave requires small-amplitude seed density irregularities to be present before it may proceed; however, no such seed irregularities were included in the initial simulation density profiles. It is likely here that the seed for this process is provided by the low-amplitude numerical noise present in the simulated ion and electron densities. This is an artifact of the computational process and not physical in nature; however, it may play an equivalent role to the seeding effect of low-amplitude density vari-ations in the real ionosphere. If the numerical noise is of a higher amplitude or grows at a faster rate than seed perturbations in the real ionosphere, it may explain the unexpectedly early appearance of the field-aligned structures in the simulation.
To investigate this, the simulation was repeated for varying temporal and spatial step sizes, while keeping the Courant number constant. It was found that the field-aligned density structures become visible after approximately 6×10⁶Δ
t, regardless of the magnitude ofΔt, when test simulations were performed for Δt=9.17×10⁻⁹s,Δ
t=1.83×10⁻⁸s, andΔt=3.67×10⁻⁸s. Subsequent to this, the growth rate of the
irreg-ularities was consistent with development due to a thermal physical process such as the resonance instability and scaled with the simulated time in seconds rather than with the number of time steps. This implies that the onset time of irregularity growth was numerical in nature, dependent on the growth of numerical noise in the simulated plasma density, and thus was determined by the simulation time step number. After the onset of the irregularities, their growth was physical in nature and progressed according to the physical timescale in the simulation rather than the numerical time step.
Journal of Geophysical Research: Space Physics
10.1002/2015JA022105
Summary plots showing how the maximum value of electron temperature perturbation and the minimum value of electron density perturbation in the simulation domain changed with time can be seen in the lower panels of Figure 9 (panels 9.7a–9.7b), for the cases of the pump wave directed above (8.6∘), below (0.0∘), and along the Spitze direction (5.2∘). TheZ-mode reflection-allowed scenario is shown by a solid line, with the reflection-suppressed case indicated by a dashed line. AllowingZ-mode reflection can be seen to lead to a higher eventual magnitude of heating-induced effects by as much as a factor of 2 for the case of the Spitze-directed wave. Pump waves with initial inclination angles closer to the Spitze direction (for which conversion toZ-mode was more favorable) were found to achieve a greater magnitude of temperature enhancement and a greater variation between the reflection-allowed and reflection-suppressed cases. The rate of development of temperature enhancement was more rapid in the reflection-allowed case; for exam-ple, when the incident wave was directed at 5.2∘, the steady state temperature is achieved after 0.25s in the reflection-allowed case, compared with 0.6s in the reflection-suppressed case. This can be attributed to a greater rate of thermal diffusion in the reflection-allowed scenario caused by the much higher temperature, which allowed thermal equilibrium (steady state conditions) to be achieved more quickly.
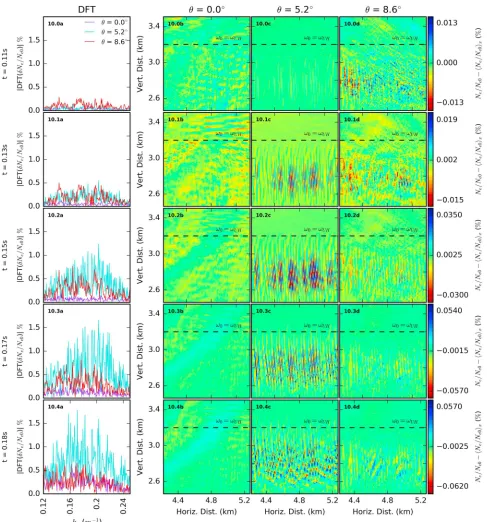
The pump wave directed close to the Spitze direction was also found to be most effective at excit-ing small-scale field-aligned density irregularities around the upper hybrid resonance height. This is shown by Figure 10 which displays the change in the fractional electron density irregularity amplitude, (
Ne−⟨Ne⟩x)∕Ne0, with time in a narrow band of altitude around the UH resonance level. Results are shown for pump waves directed along 0.0∘(panels 10.0–4b), 5.2∘(10.0–4c), and 8.6∘(10.0–4d) to the vertical, after times of 0.11s (uppermost panels; 10.0b–d), 0.13s, 0.15s, 0.17s, and 0.18s (lowermost panels; 10.4b–d). The UH resonance height for which the local UH frequency matches the pump wave frequency (𝜔UH = 𝜔0) is indicated by a dashed line. In each case, clear field-aligned density perturbations can be seen to grow with time, first visible from∼0.1s and persisting until they begin to collapse into less-ordered small-scale struc-tures leaving a slight net density depletion. Initial growth of the irregularities in all cases occurs at an altitude ∼ 0.4km below the UH height, after which they extend with time to both higher and lower altitudes. The rate of growth of striations can be seen to vary with pump wave angle, with the wave directed closest to the Spitze angle (5.2∘) causing the most rapid growth, both in terms of depletion depth and elongation along the magnetic field direction.
Panels 10.0–4a in Figure 10 show the 1-D spatial discrete Fourier transform (DFT) of the magnitude of the frac-tional density irregularity amplitude𝛿Ne∕Ne0=||Ne−⟨Ne⟩x||∕Ne0for each angle, sampled along the horizontal axis of the simulation domain at the height at which the irregularities begin to develop. The DFT plots show that there is a clear increase in the perturbation amplitude for spatial frequencies aroundkx∼0.18 m−1, which
increases in amplitude with time as the irregularities grow. This range of spatial frequencies corresponds to irregularities with scale sizes of 30–40 m perpendicular to the geomagnetic field direction. The amplitude of density perturbation components in this scale-size range is highly dependent on pump wave angle, with the amplitude greater by a factor of 2 or more in the case of the Spitze-directed wave. From this it follows that the UH wave excitation process is dependent on wave angle, with UH production occurring most favorably at the same range of angles for which theO- toZ-mode conversion process was most favorable.
Production of UH waves and their dissipation in the associated field-aligned irregularities would make a sig-nificant contribution to the electron temperature enhancement via the resonance instability. As such, the dependence of irregularity production on pump wave angle demonstrated by these simulations could be expected to add a further contribution to the magnetic zenith effect. Small-scale density irregularities such as this may also affect the development of large-scale plasma perturbations through anomalous attenuation of the pump wave. The code used here treats absorption of the pump wave through inclusion of an effective collision term𝜈0in a manner similar to that described byGondarenko et al.[2006]. The magnitude of
irregu-larities developed over the simulation timescale is small (<0.001Ne0); however, there is a small attenuation in
the pump wave amplitude (<1dB for the vertically directed wave) which may be due to absorption caused by irregularities.
These results show that theO-mode toZ-mode conversion process could be an important mechanism behind the observed magnetic zenith effect, with the observed angular dependence arising from the shape of the
Journal of Geophysical Research: Space Physics
10.1002/2015JA022105
5. Inclusion of Density Structures
The previous section demonstrates that theO-mode toZ-mode conversion process can lead to a variation in the magnitude of artificial plasma perturbation with the inclination angle of an incidentO-mode wave, for the case of a 1-D linear vertical plasma density gradient. The addition of a component of horizontal inhomo-geneity has been shown in section 3 to significantly modify theZ-mode window; thus, it is to be expected that the presence of a horizontally inhomogeneous density feature will also affect the dependence of plasma perturbation on pump wave direction. This section presents the results of simulations performed for vari-ous pump wave directions and for the cases that a linear horizontal density gradient, a single field-aligned density-depleted duct, or a periodic distribution of field-aligned density-depleted irregularities are included in the background density profile.
Simulations were performed for pump wave initial inclination angles 0.0∘, 2.9∘, 5.7∘, 8.6∘, and 11.5∘with
Z-mode reflection allowed. Computational domain dimensions were set to be 1024×1×768. For increased accuracy, the time step size was reduced to 1.22×10⁻⁸s, and the spatial step size to 7.33 m. All other simulation
parameters were set as in section 4.
Figure 11 (top) shows the electron density and temperature perturbation developed in the simulation after 0.23s when a 2-D density profile including a linear horizontal slope as given by equation (9) was used. Results for horizontal scale sizesLx = 20km (11.1–5a and 11.1–5c) andLx = 50km (11.1–5b and 11.1–5d) are shown. In both cases the vertical slope scale size was set to beLz = 20km. The lowermost panels show the variation of minimum density perturbation (panel 11.6a) and maximum temperature perturbation (panel 11.6b) recorded in the simulation with time. TheLx =20km case is indicated by a solid line, theLx =50km
case by a dashed line.
The most striking difference between the results shown in Figure 11 and the unperturbed case with no hor-izontal inhomogeneity shown in Figure 9 is the shifting of the inclination angle responsible for the greatest temperature enhancement from the Spitze position toward the magnetic zenith direction with decreasingLx.
ForLx = 50km, the greatest temperature enhancement is produced by the wave launched at 8.6∘(shown
in panel 11.4d). This is consistent with the modification of theZ-mode window found by the simulations reported in section 3 for the case of a linear horizontal density inhomogeneity, as shown in Figure 2, which pre-dicts maximumZ-mode transmission to occur for pump waves directed at an angle of 8.2∘for theLx=50km
case. Likewise, the analysis of section 3 showsO- toZ-mode conversion to be more favorable as the pump wave direction approaches the zenith direction forLx=20km, in good agreement with the simulations
per-formed here which show that the temperature enhancement increases as the pump wave inclination angle increases, with maximum enhancement found for the pump wave directed at 11.5∘(shown in panel 11.5c).
Similar plots are shown in Figures 12 and 13 for the cases of a single density-depleted field-aligned duct and a periodic distribution of such irregularities, respectively. In both scenarios, an inhomogeneities with scale parametersLwidth=0.08km andLwidth=0.8km are compared.
When the single, narrow (0.08 km) irregularity was included, the simulation behaved in a similar manner to the unperturbed case, as would be expected from Figure 3 which suggests that theZ-mode window would be relatively unmodified by irregularities of this scale, with only a slight (< 1∘) shift toward vertical. In this case, the maximum temperature enhancement occurred for the pump waves directed close to the Spitze angle (5.7∘) and between the Spitze and vertical directions (2.9∘) consistent with the small shift in theZ-mode window. The maximum stationary-state temperature was similar to that shown for the unperturbed 1-D slope case in Figure 9. At all angles, the largest density modification occurred away from the position of the density duct. For the larger-scale (0.8km) irregularity, the temperature perturbation at all angles was greater than in the narrow irregularity case at all sampled angles, due to the broadening of the window with increasing duct width (as shown in Figure 3). The greatest modifications to both temperature and density occurred for the wave directed between the Spitze angle and vertical (shown in panels 12.2b and 12.2d). Here the maximum steady state temperature achieved was more than 10% greater than the maximum temperature developed in the unperturbed 1-D slope scenario shown in Figure 9. At all sampled angles, the site of greatest density perturbation can be seen to occur within the duct, having the effect of deepening the depletion with time around the point at which the pump wave is reflected.
Journal of Geophysical Research: Space Physics
10.1002/2015JA022105
Journal of Geophysical Research: Space Physics
10.1002/2015JA022105
Figure 13. Variation in electron density perturbation and electron temperature perturbation with pump wave inclination angle when periodic density-depleted field-aligned irregularities of the form (11) withLwidth=0.08km andLwidth=0.8km were included in the background density profile. Uppermost panels
(13.0a–b) show the background conditions for eachLwidthcase. Lowermost panels (13.6a–b) show the variation of minimum density perturbation and maximum
propagation of theZ-mode wave beyond the interaction region. As such, this narrow irregularity case behaves much like the unperturbed 1-D density slope scenario with the effects due theZ-mode suppressed. Accord-ingly, the maximum temperature enhancement was found to occur for the vertically directed pump wave (shown in panel 13.1c) and was found to decrease as the wave inclination angle was increased toward the field-aligned direction. For the larger-width (0.8 km) irregularities, as in the single-irregularity case, the great-est modification to the plasma was found to occur for the pump wave inclined at 2.9∘(panel 13.2d). The greatest perturbations can be seen to be localized at certain points within each density depletion. These “hot spots” correspond to the pump wave reflection point within each irregularity (indicated in the background profile plot 13.0b). The magnitude of maximal temperature in the large-irregularity case was greater than in the small-irregularity case for all pump wave angles aside from vertical (for which the steady state tempera-tures were approximately equal). By contrast, the magnitude of density depletions was greater in the case of narrow irregularities by a factor of 2 or greater at all sampled angles, corresponding to a more rapid growth of the depletions with time in this scenario.
In section 3 it was shown that addition of a 2-D variation to the electron density profile strongly affected both the process of conversion from theO-mode pump wave toZ-mode and the subsequent propagation of anyZ-mode waves. The results presented in this section have demonstrated that this modification of the
Z-mode window has a knock-on impact on the development of artificially-induced thermal plasma perturba-tions. Changing the shape or position ofZ-mode window via the inclusion of a 2-D density inhomogeneity was found to lead to a corresponding variation in the dependence of electron temperature enhancement on pump wave inclination angle. This mechanism could explain why the greatest magnitudes of plasma heating have often been found to occur for non-Spitze directed waves during observations of the magnetic zenith effect.
6. Summary and Conclusions
Ionospheric heating experiments have observed that the magnitude of artificial heating-induced plasma per-turbations depend strongly on the inclination angle of the pump beam, with a greater modification to the plasma observed when the heating beam is directed close to or along the magnetic zenith direction.Honary et al.[2011] proposed that this magnetic zenith effect is due to theO-mode toZ-mode conversion process that can occur in theFregion for a narrow range of pump wave inclination angles. This conversion process has previously been investigated theoretically for the case of a 1-D variation in electron density; however, the case of a 2-D variation had not been discussed before, and in this paper was investigated numerically for the first time. A recently developed full-wave FDTD code [Cannon and Honary, 2015] was used to numerically explore the effect of anO-mode polarized EM pump wave on the plasma around the ionosphere critical interaction region. In particular, the behavior of theO- toZ-mode conversion process and magnetic zenith effect was investigated for a variety of density profiles. These simulations show that the presence of ionospheric plasma density inhomogeneities can explain many of the features of the observed magnetic zenith effect through modification of the angular window forO-mode toZ-mode conversion.
The fraction of the simulated pump wave field penetrating beyond theO-mode reflection height in the form of aZ-mode was measured for a range of launch angles and used to determine the angular shape of the window for whichO- toZ-mode conversion was favorable. For the case of a 1-D vertical electron density gra-dient the simulation results (as shown in Figure 1) demonstrated good agreement with the predictions of
Mjølhus[1984], with the conversion window centered on the Spitze angle (8). From this, one would expect that the magnetic zenith effect would manifest most strongly for pump waves directed at the Spitze angle; however, it has been reported that the maximum electron temperature enhancement at European Incoherent Scatter (EISCAT) can occur for inclination angles somewhere between the Spitze and field-aligned directions [for example,Isham et al., 2005]. To explain this,Honary et al.[2011] proposed that the shape of theZ-mode window can be modified by the presence of horizontal inhomogeneities in the electron density, such as the large-scale depleted regions or field-aligned irregularities that may be excited during the course of an ionospheric heating experiment. This problem cannot be fully treated theoretically using the techniques of geometric optics; however, the numerical simulation techniques used here allowed 2-D plasma profiles to be fully taken into account.