Original citation:
Gadenne, Lucie (2018) Do ration shop systems increase welfare? Theory and an application to India. Working Paper. Coventry: University of Warwick. Department of Economics. Warwick economics research papers series (WERPS), 2018 (1149). (Unpublished) Permanent WRAP URL:
http://wrap.warwick.ac.uk/97782
Copyright and reuse:
The Warwick Research Archive Portal (WRAP) makes this work by researchers of the University of Warwick available open access under the following conditions. Copyright © and all moral rights to the version of the paper presented here belong to the individual author(s) and/or other copyright owners. To the extent reasonable and practicable the material made available in WRAP has been checked for eligibility before being made available.
Copies of full items can be used for personal research or study, educational, or not-for-profit purposes without prior permission or charge. Provided that the authors, title and full bibliographic details are credited, a hyperlink and/or URL is given for the original metadata page and the content is not changed in any way.
A note on versions:
The version presented here is a working paper or pre-print that may be later published elsewhere. If a published version is known of, the above WRAP URL will contain details on finding it.
Warwick Economics Research Papers
ISSN 2059-4283 (online)
ISSN 0083-7350 (print)
Do Ration Shop Systems Increase Welfare? Theory and an
Application to India
Lucie Gadenne
(This paper also appears as CAGE Discussion Paper No: 358)
Do Ration Shop Systems Increase Welfare? Theory and an
Application to India
Lucie Gadenne
University of Warwick and Institute for Fiscal Studies∗
January 2018
Abstract
In many developing countries households can purchase limited quantities of goods at a fixed
subsidized price through ration shops. This paper asks whether these countries’ characteristics
justify the use of such ration shop systems. I find an equity-efficiency trade-off: an
efficiency-maximizing government will never use ration shops but a welfare-efficiency-maximizing one might, to redistribute and provide insurance. Welfare gains from introducing ration shops are highest for
necessity goods with high price risk. I calibrate the model for India and find that ration shops
are indeed welfare-improving for three of the four goods sold through the system today.
∗
1
Introduction
Ration shop systems give households a right to purchase some goods at a fixed subsidized price up to a quota level. They are in place in many developing countries today; India’s ration shop system alone is used by 70% of its inhabitants - roughly 11% of the world’s population. Table1presents a non-exhaustive list of countries in which ration shop systems exist, restricted to examples for which estimates of the cost of the program are available. Goods sold in ration shops are typically food and fuel; eligibility to use ration shops varies across countries but universal access is not uncommon.1
These systems enable governments to implement a particular form of commodity taxation: by subsidising purchases below a quota level through ration shops and (sometimes) levying a tax on the same good when purchased on the market governments are effectively setting marginal commodity tax rates that increase with amounts consumed. Such non-linear commodity taxes are hard to explain using standard models of taxation; they have been ruled out as unfeasible in most of the literature because governments do not observe commodity consumption at the household level.2 Perhaps consequently little work has been done to understand the rationale behind the specific commodity taxes and subsidies used by developing countries and inform the ways in which they could be reformed.
In this paper I ask why benevolent governments in developing countries would ever want to use universal-access ration shop systems. I start with the realization that these systems make a form of non-linear commodity taxes (piece-wise increasing taxes) feasible and ask under what conditions these taxes are welfare-increasing. I take into account two particularities of the developing country context that may make ration shops optimal in these countries and not in the developed world: limited government targeting capacity and high commodity price risk. First, governments in de-veloping countries have limited capacity to observe individual incomes - targeting capacity (Besley and Persson, 2013, Jensen, 2016, Klevenet al., 2016); my baseline model assumes the government cannot use income taxes and transfers. Redistribution through commodity taxation is known to be inefficient under general assumptions when income taxes are available (Atkinson and Stiglitz, 1976). However, when income taxes and transfers are costly to implement, ration shop systems may enable governments to redistribute more than linear commodity taxes (redistribution motive). Second, high transport costs, under-developed retail markets and regional trade regulations lead to poor spatial market integration in developing countries, as well-documented by the trade litera-ture.3 Consumer prices consequently co-vary strongly with local supply shocks. I allow for varying producer prices in the model: this introduces a potential social insurance motive for the use of ration shops that fix the price of goods up to a quota level.
1
The history and current functioning of ration systems is well documented in Alderman (2002), Rogers and Coates (2002), Kennedy and Harold (1987).
2
Linearity is seen by Atkinson and Stiglitz (1980) as a defining characteristic of commodity taxes, and the main difference between direct and indirect taxes “...the essential aspect of the distinction [is] the fact that direct taxes may be adjusted to the individual characteristics of the taxpayer, whereas indirect taxes are levied on transactions irrespective of the circumstance of buyer and seller.” (Atkinson and Stiglitz (1980), p 427)
This paper’s first contribution is a model of commodity taxation that takes into account the characteristics of developing countries and considers under what conditions (what types of house-hold and government preferences) ration shop systems are welfare-improving compared to standard linear taxes. I set up a Ramsey-type model of commodity taxation in which households differ in their preferences and incomes and face an exogenous price risk; I allow for the possibility that households consume from their own production to capture the fact that in developing countries some rural households are net producers of agricultural goods.
I obtain general conditions under which ration shop systems (RSS) are welfare-improving. There is a trade-off between efficiency and equity: a revenue-maximizing government will in general not choose to use a RSS because it implements higher marginal prices for households with the highest demand for the good, thereby lowering overall demand. When the government maximizes welfare, however, ration shops become welfare-improving for many goods, and this even when prices are fixed and the only role potentially played by the RSS is redistribution. Intuitively, including normal goods in ration shops enables the government to raise revenues through commodity taxes whilst shielding poor households from the tax, at the cost of increasing the distortions imposed by the tax system. The highest welfare gains from introducing a RSS are obtained for necessities: normal goods widely consumed by poor households. For these goods taxing higher levels of consumption more affects richer households disproportionately and most poor households benefit from the lower prices below the quota. Introducing price risk in the model typically leads to an insurance gain from introducing a RSS, this gain increases with budget shares and the level of risk but decreases when poorer households produce the good at home.
This paper’s second contribution lies in the calibration to the Indian context of the model’s expressions for the welfare effect of ration shops. These expressions are a function of parameters easily observed in the type of household surveys available in developing countries: the joint distri-butions of incomes of consumption, budget shares and price variations for each good considered. I calibrate the welfare effect of introducing ration shops for eight types of goods widely consumed by households using India’s large 2011-2012 household consumption survey. The survey documents household consumption from ration shops, markets and home production and therefore allows me to simulate the joint distributions of incomes and consumption patterns under different counter-factual tax scenarios. It is available annually; I use past editions to obtain proxies for the level of price risk faced by households.
consider other goods as candidates for inclusion in India’s RSS and find welfare gains for coarse cereals (cereals that are staples in some parts of India), but not for any other good.
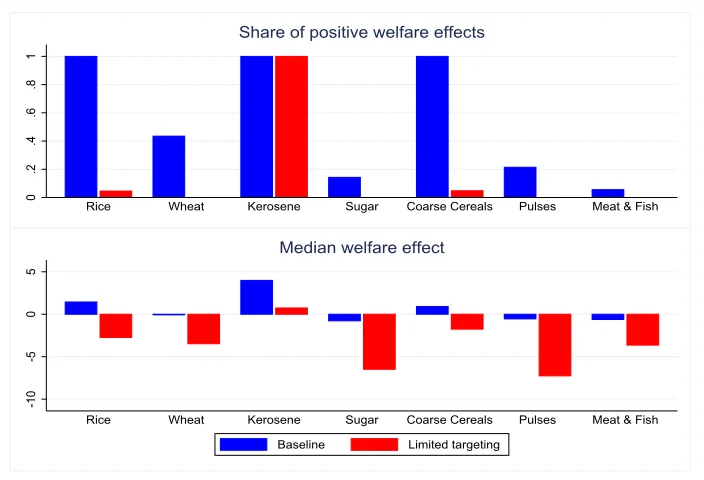
I then study the impact of relaxing the model’s key assumptions. Allowing for some government capacity to target poor households reduces the welfare gains from introducing a RSS. This explains why governments in developed countries with high targeting capacity never use ration shops. In today’s India, however, I find that welfare gains from introducing ration shops are still positive for kerosene and cereals once the government’s limited targeting capacity is taken into account in the calibration (I use survey estimates of targeting capacity from Niehaus et al.(2013)). Allowing for leakages also reduces the welfare gains of introducing a RSS; calibration results suggest these gains are wiped out in the Indian context when more than 6% of the funds allocated to the RSS are lost to administrative or corruption costs.
This paper contributes to the growing literature on public finance in developing countries which considers to what extent optimal tax policy recommendations change when we take into account the specificities of developing countries.4 I show that under some conditions a form of non-linear commodity taxation that has largely been ignored by the literature is a useful policy instrument in developing countries because of the characteristics of both governments (limited targeting capacity) and markets (high price risk) in these countries. This approach is related to that followed by Best
et al. (2015) who show that turnover taxes may be part of the optimal tax mix in developing
countries because of the specific constraints faced by governments in this context - in their case, high levels of tax evasion.
A large literature considers how governments in developing countries redistribute with limited capacity to observe households’ incomes (see Coadyet al., 2004, Alataset al., 2012). This literature has mostly considered commodity subsidies through the lens of the cash-versus-kind debate, focus-ing on justifications for in-kind redistribution that stem from paternalism (Cunha, 2014), general equilibrium effects on market prices (Coateet al., 1994, Cunha et al., 2017) or concerns regarding food security (Tarozzi, 2005).This paper shows how ration shop systems, a form of in-kind transfers, can be part of a government’s optimal policy tools even in the absence of these effects once we take into account the characteristics of governments and markets in developing countries. This approach also allows me to explain why ration shops only exist in these countries and derive expressions to quantify their welfare effects.5 Governments’ limited targeting capacity also motivates many of the calls for developing countries to implement universal basic income schemes (see for example Ghatak, 2016, Ravallion, 2017). The model developed here assumes the government’s alternative use of fund is a universal transfer; results therefore allow me to consider under what conditions a
4
See for example de Paula and Scheinkman (2010), Olken and Singhal (2011), Kleven and Waseem (2013), Kumler et al.(2015), Pomeranz (2015), Naritomi (2016), Gerard and Gonzaga (2016), Khanet al.(2016), Bachas and Soto (2017), Carrillo et al.(2017), Cag´e and Gadenne (2017) as well as Emran and Stiglitz (2005), Boadway and Sato (2009), Dharmapalaet al.(2011) for theoretical work on the topic.
5A smaller literature considers how existing ration shop systems can be made more efficient by changing
ration shop system - another program with universal eligibility - is welfare-increasing compared to a scenario in which the government uses only a universal basic income financed by linear commodity taxes.
Finally this paper is the first to consider both the possibility and the welfare properties of piecewise-increasing commodity taxes for general consumption goods. A small literature in public finance has considered non-linear taxation of particular goods, for example housing or education (see Currie and Gahvari, 2008, for a review). This literature assumes the existence of ‘indicator goods’ - goods preferred by poorer households regardless of their income - and hence opens up the possibility that non-linear commodity taxes on those goods relax the self-selection constraint faced by the optimal income tax problem (Nichols and Zeckhauser, 1982). This paper departs from this literature by studying when non-linear commodity taxes are optimal even in the absence of indicator goods when income taxes are not available.6 The model’s assumptions are thus in the spirit of Ramsey (1927) (exogenous, non taxable income), Diamond (1975) (heterogenous preferences) and Varian (1980) (exogenous price risk). The introduction of non-linear taxes also relates the model to the Mirrleesian optimal income tax tradition and the paper’s emphasis on deriving formulas expressed as a function of parameters that can be estimated from standard datasets is similar to Saez (2001).7
The paper is organized as follows. Section 2 describes India’s ration shop system, focusing on key characteristics that are building blocks of the model. Section 3 sets up the model and derives conditions under which a ration shop system is welfare-improving. Section 4 explains the methodology and data used to calibrate these expressions numerically for India. Section 5 presents the results and section 6 discusses their robustness to relaxing some of the model’s key assumptions.
2
Ration shop systems in practice
A ration shop system is a program that gives households the right to purchase a given quota amount of some commodities at a fixed subsidized price. Consumption above the quota must be purchased on the market and market purchases may be taxed. These subsidies are financed through public revenues, in developing countries the bulk of these comes from commodity taxes (see Gordon and Li, 2009). In this section I detail the example of India’s ration shop system which I later apply the model to, focusing on key policy and market characteristics that affect the functioning of the RSS and are building blocks of the model developed in section 3.
India’s ration shop system, known as the Public Distribution System, has been in existence for over 70 years (see Mooiji, 1999, for more on the history of the public distribution system). The main four commodities sold in the more than 500,000 ration shops in the country are rice, wheat,
6Another related paper by Sah (1983) shows that redistribution through commodity taxes is limited by the extent
to which budget shares are differentiated along the income distribution. He argues that differences in consumption are too small for much redistribution to be obtained through commodity taxes, and suggests that this is a problem in developing countries which rely heavily on those types of taxes. This paper points out that this result no longer holds once we take into account the fact that developing countries are in practice taxing commodities non-linearly.
7
kerosene and sugar; when sold on the market these goods are subject to state-level value-added-taxes (VAT).8 The system is India’s largest poverty alleviation program, both in terms of cost (currently 1% of GDP) and reach: 70% of Indian households use ration shops (Khullar, 2017). The central government bears most of the cost of the subsidies but state governments have discretion over which goods to include in the RSS, the eligibility criteria, ration prices, quota amounts and tax rates. Households’ capacity to afford food and fuel remains a concern in India today; this concern motivated the passing of the National Food Security Act in 2013.9 The Act established households’ access to commodities at subsidized prices as a legal entitlement and imposed a lower bar (ceiling) on the quota levels (ration prices) that states are allowed to set (Dreze et al., 2015).
Table 2 presents descriptive statistics for each good sold in the ration shop system - see the appendix for a description of the ration shop policies of major Indian states. Panel A shows the range of official quotas and ration prices in place in 2011-2012. Panels B to D show consumption and prices of the goods as reported by households in a nationally representative consumption survey, described below. Comparing Panels A and B we see that the typical official quotas are somewhere between the 25th and 50th percentiles of the distribution of consumption from all sources for rice, wheat and kerosene (though quotas are lower in some states), under the 25th percentile for sugar. The minimum quota level established by the National Food Security Act - 5 kg of cereals per individual per month - is similarly located close to the 25th percentile of distribution of total cereal consumption.10
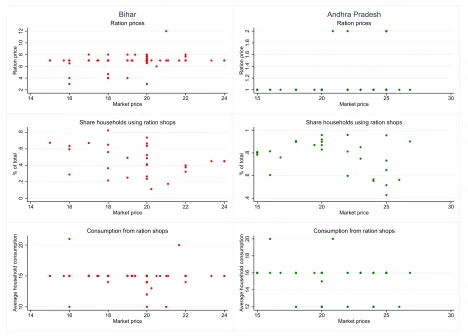
There is substantial anecdotal evidence of corruption in the running of the ration shop system (see for example Planning Commission, 2005, Khera, 2011b, Nagavarapu and Sekhri, 2014). Of interest here is whether the RSS used by households in India resembles the definition - sales of quotas at a fixed subsidized price - used in the model below. Table2 is reassuring in that respect: we see that quantities purchased and ration prices as reported by households (in Panels B and C) are within the range of official state-level quotas and ration prices in Panel A; I compare reported ration quantities and prices to official quotas in six major states in the appendix and find that they are very close. The system’s capacity to provide insurance against price fluctuations, a key component of the model developed below, could however be seriously impaired if ration prices and amounts co-varied with market prices. Hari (2017) finds some evidence going in this direction but Figure1suggests the correlations between market conditions and ration quotas and prices are low. Using values reported by households, I plot the district-level relationship between median market price and i) ration prices, ii) share of households using ration shops and iii) average RSS purchases in two Indian states, one in which the system is deemed well-functioning (Andhra Pradesh) and one
8
Rice wheat and sugar are currently tax-exempt but were taxed at a positive rate in some states until 2005. The average tax is on kerosene 12.5%.
9Pachauriet al.(2004) estimate that 14% of Indian households are ‘extremely energy poor’, meaning they barely
have enough fuel for one cooked meal per day; the World Bank estimates that a third of Indian households had no access to electricity in 2011 (World Development Indicators). The UN’s Food and Agriculture Organization (FAO) finds that 195 million individuals in India are under-nourished, roughly 15% of the population.
10This quota level corresponds to 20-30 kg per household per month. The average Indian households consumes 54
in which it is thought to be inefficient and corrupt (Bihar) (see Khera, 2011b). In both states we see that ration prices, ration shop use and amounts bought in ration shops are not correlated, or weakly correlated, with market prices. The descriptive evidence suggests that the system is reasonably well implemented overall; I assume perfect implementation in modelling the RSS below but allow for corruption and administration costs (leakages) in a model extension and in the calibration.
Table2also shows that there is substantial variation in market prices for all commodities except sugar; in Figure 1 we see that even within a single state and year the mean price of rice doubles from the lowest-price district to the highest-price district. This high level of price variation across areas is in line with evidence for India in Atkin (2013) and can be explained by the fact that local markets are not well integrated because of poor transport infrastructure and taxes and regulations limiting trade across areas11. High levels of price risk are a pervasive characteristics of markets in developing countries more generally (see for example Atkin and Donaldson, 2015). Relatedly panel B of Table 2 points to another characteristic of markets in developing countries: a non-negligible share of households produce the goods they consume at home. This affects the welfare cost of market price variations as home production can provide consumers with partial insurance against market price risk. The model developed below considers how allowing for varying market prices affects the welfare effect of ration shop systems and to what extent the existence of home production mitigates their potential social insurance value.
The last panel of Table 2presents descriptive statistics on total consumption from ration shops for poor and non-poor households, using official state-level poverty lines to define households’ poverty status. We see that a large majority of both poor and non-poor households report using the RSS: amongst households using ration shops the monetary value of transfers is roughly 20% higher for the poor than the non-poor. Poor households could be using ration shops more than the non-poor for two reasons. There could be de facto targeting of the RSS even if all households were equally eligible to use ration shops if non-poor households chose not to use them because the goods sold in ration shops are imperfect substitutes for those sold on the market.12 There could also be targeting by design: state governments decide how much the RSS is targeted, the typical Indian state gives all households a right to purchase goods from ration shops but sets less generous entitlements for non-poor households (see appendix). Figure 2 shows that the limited targeting across households seen in Table 2 is not only due to mis-targeting close to the poverty line, set at the 22nd percentile of the distribution: we see that 65% of households in the fourth income quintile report using ration shops. In the appendix I consider the extent to which states are capable of targeting RSS transfers to the poor by comparing states with different official targeting criteria. I find that households in the richest quintile are only 20% less likely than those in the poorest quintile to use ration shops in the one state (Tamil Nadu) in which all households have the same entitlements, suggesting any ordeals imposed by the system are insufficient to deter most of the non-poor from using it. There is moreover no clear evidence of better targeting amongst states
11See Gadenneet al.(2017) for a detailled discussion of price risk in India. 12
with very different entitlements for the poor and non-poor. Overall, Indian states seem unable to effectively target transfers to poor households, in line with micro-evidence in Niehauset al. (2013) for Karnataka. Limited targeting capacity is a concern for redistribution policies in all developing countries more generally: the World Bank estimates that the targeting of social safety nets is only marginally pro-poor in those countries (World Bank, 2014). I assume no government targeting capacity and perfect substitution between goods sold in the ration shops and in the market (no ordeals) in the baseline model below.
A final question of interest is the extent to which households arbitrage: the difference between the ration and market prices generates an incentive to re-sell quotas on the market. This question affects how we think about ration shop systems as a redistribution instrument: in a situation with costless re-sale the ration shop system essentially transfers the same amount to all households and is equivalent to a lump-sum transfer (Besley and Kanbur, 1988). There is no data available on re-sale of quotas but information on how much households consume from the ration shops enables me to assess the scale of arbitrage indirectly: if re-sale were costless we would see that all households would choose to purchase their total quota amount in order to re-sell the amounts they are not consuming on the market. Appendix Figure A1 presents the density distribution of household consumption of goods from the ration shops and quota levels. Many households consume less than the quota level; comparing consumption with official quotas I find that the quota is marginal for 23% of households for rice, 11% for sugar and 33% for kerosene. The evidence suggests that resale, if it occurs, must be costly, as a non-negligible share of households choose not to re-sell (all of) their rations.
The next sections consider under what conditions introducing a ration shop system is welfare increasing; key characteristics of the Indian context are built into the model’s key assumptions. Regarding policy instruments I assume perfect implementation of the ration shop system, no gov-ernment targeting capacity, and no re-sale. I discuss the impact of relaxing these assumptions at the end of the model section. Regarding market characteristics I introduce varying market prices in section 3.4and home production in section3.5.
3
Model
3.1 Set-up
There is a continuum of mass 1 of households i that differ in their income yi and preferences characterized by utility functionui(.). There areKconsumption goodsxk, with exogenous producer prices zk and one numeraire good whose price is normalized to 1. Household i’s preferences for goodkare characterized byik, the uncompensated price elasticity of demand andηik, the income elasticity of demand. I writevi(.) household i’s indirect utility function andski the budget share she spends on good k. I write pk the consumer price of good xk; households maximize utility subject to a standard budget constraintP
kxkipk ≤yi.
In this section I simplify the analysis by assuming that only one good kis taxed and therefore drop all superscriptsk- this assumption is relaxed in the appendix. I consider whether introducing a ration shop system for this good is welfare-improving compared to setting an optimal linear rate
t such thatp =z+t. I define a ration shop system by a sett1, q, t2 such that the consumer price
of the good is given by:
p=
(
z+t1 ifxi ≤q,
z+t2 ifxi > q.
where t2 > t1, q is strictly bounded by the minimum and maximum values of consumption of
the good and equilibrium consumptionxi is given by:
xi=
xi(z+t1, yi) ifxi(z+t1)≤q,
xi(z+t2, yi+ (t2−t1)q) ifxi(z+t2, yi+ (t2−t1)q)≥q,
q ifxi(z+t2, yi+ (t2−t1)q)< q and xi(z+t1)> q.
The distributions of households’ incomes and preferences yield a distribution of consumption with density h(x) and cumulative density function H(x).13 I consider two types of government preferences in turn: first a revenue-maximizing government then a welfare-maximizing one.
3.2 Revenue-maximizing government
Consider a government whose objective is to maximize total tax revenues tR
ixidi. If it can only use linear commodity taxes the optimal linear tax rate on a commodity is given by:
tM
z+tM =
1
− (1)
where is the weighted average uncompensated elasticity of demand: =
R iixidi R
ixidi
. I assume throughout that uncompensated elasticities are negative for all goods sotM >0.
There are two ways to think about the effect of introducing a ration shop system: as a small decrease in tM on consumption below q or a small increase in tM on consumption above q. The
13
For small values oft2−t1andqone can show thatx(z+t1, yi)> x(z+t2, yi+ (t2−t1)q) because the compensated
impact on tax revenues dR2 of introducing a small increase dt2 intM above q is:
dR2 = (1−H(q))[x2(q)−q+
tM
z+tM(2(q)x2(q) +η2(q)s2(q)q)]
where the subscript 2 indicates averages over households consuming at least the quota level q. The impact on tax revenuesdR1 of introducing a small decreasedt1 intM belowq can similarly be
written:
dR1 =−x1(q)H(q)−q(1−H(q)) +
tM
z+tM[−1(q)x1(q)H(q) +η2(q)s2q(q)(1−H(q))]
where the subscript 1 indicates that averages are taken over households consuming less than the quota levelq.
Replacing for z+tMtM using (1) we see that dR2=dR1.
Proposition 1 The total impact of introducing a ration shop system at quota level q on tax rev-enues scaled by the amount of revrev-enues collected, dR(q), can be written as:
dR(q) = [2(q)−+
2(q) +s2(q)η2(q)
θ(q)−1 ]
t
z+t (2)
where t is the linear commodity tax rate and θ(q) = x2(q)
q >1 is a scale parameter measuring the
thickness of the right-hand side of the distribution of consumption of the good. The revenue effect is of opposite sign to the linear rate unless households consuming high amounts of the good have
a very low price elasticity of demand compared to the average (2 > η2s2+(θ
−1)
θ ). In particular if
demand elasticities are homogeneous in the population (2=) and the government is maximizing
revenues (t=tM >0) the revenue effect of introducing a ration shop system is negative, increasing
in absolute value with the compensated elasticity of demand and decreasing in absolute value with
the thickness of the right-hand side of the distribution of consumption.
discuss the robustness of results with respect to this assumption in the calibration section below.14 The revenue impact of introducing a ration shop system increases in absolute value with the compensated elasticity of demand of households consuming at least q (2(q) +s2(q)η2(q)) which
captures the strength of the behavioral response to the introduction of a RSS. This is the relevant parameter because the introduction of a RSS is equivalent for these households to an increase in the marginal price of the good ofdt2 compensated for by an increase in (virtual) income ofdt2q.15 An
increase in the thickness of the right-hand side of the distribution ofx(θ(q)) lowers the magnitude of the revenue impact. Intuitively this is because the revenue gain from increasing the tax above
q is increasing in the average consumption above q whereas the behavioral response is a function of q. Similarly the revenue cost of a decrease int below q - a subsidy on the left-hand side of the distribution of x - is smaller, all else equal, for higher values ofθ(q).16
3.3 Welfare-maximizing government
Consider now a welfare maximizing government whose preferences are characterized by the social welfare function G(.), increasing and concave, and µ, the marginal value it places on one unit of public revenues. It maximizes
W =
Z
i
G(vi(x))di+µt
Z
i
xidi
Following Saez and Stantcheva (2016) I write householdi’s marginal social welfare weight - the value the government places on one extra unit of income to householdi- asgi.17 I assume in what follows the government only cares about whether a household is poor or non-poor and definegp(gnp) the social value of one extra unit of income to a poor (non-poor) household, withgp > gnp. I writeπ the share of poor households in the population andg=πgp+ (1−π)gnpthe average marginal social welfare weight. This ‘poverty-adverse’ social welfare function is well suited to developing countries in which government objectives are often defined in terms of poverty minimization. Empirically they have the advantage of not requiring the full distribution of incomes to be known in contexts in which income is often measured with substantial measurement (Deaton, 1997). The drawback is sensitivity of the results to the definition of the poverty line; I pay particular attention to this problem in the calibration below. A particular case of interest is the one in which the government’s alternative use of funds is a universal (non-distortive) transfer so that µ=g. This case abstracts from exogenous reasons the government could have to value public revenues, I often refer to it below.
14
Some evidence regarding the distribution of price elasticities of demand in a developing country setting is found in Attanasioet al.(2013).They find that price elasticities for food in Mexico are lower amongst poorer households.
15
I follow the literature on non-linear income taxation by defining virtual income as the income that the household would receive if it could stay on the virtual linearized budget.
16
This result is very close to that in Saez (2001) who shows that the top marginal income tax rate is increasing in the thickness of the right-hand-tail of the income distribution because the thicker the tail the more revenues the top marginal rate raises.
17
Formally heregi= ∂v∂G i
The optimal linear rate is now given by:
t
z+t =
(µ−g) + (gp−gnp)π(1−α)
−µ (3)
where α =
R i∈Pxidi πR
ixidi
represents poor households’ share in total consumption. Equation (3) is Diamond (1975)’s many-person Ramsey rule for a poverty-adverse government. The linear rate is increasing in the government’s revenue-preference (µ−g) for intuitive reasons. Settingµ=gwe see that the optimal linear rate will be positive for goods consumed less by the poor on average (α <1), increasing in absolute value with the strength of the government’s preference for redistribution (gp−gnp) and decreasing in absolute value with the average price elasticity of demand.
The impact of introducing a ration shop system can still be studied by increasing the tax above a quota q or decreasing the tax belowq.
Proposition 2 The welfare impact of introducing a ration shop system at quota level q, dW(q), can be written as:
dW(q) =−(µ−g) φ(q)
θ(q)−1+ (gp−gnp)[πα−π2(q)α2(q)−π2(q)
α2(q)−1
θ(q)−1 −(1−α)
φ(q)
θ(q)−1π] (4)
where φ(q) = 2(q)+η2(q)s2(q)
>0 captures the strength of the behavioral response to taxation, π2(q)
is the share of poor households amongst households consuming at least q and α2(q) = R
xi≥q,i∈pxidi π2
R
xi≥qxidi
the ratio of average poor consumption to average consumption amongst households consuming more
than q.18
Consider first the role of φ(q). This term captures the strength of the behavioral effect of introducing a ration shop system, discussed above, relative to that of the linear tax. It has a negative effect on the total welfare impact if the optimal linear rate is positive, a positive effect otherwise. Intuitively distorting the consumption of households with the highest demand for the good away from the first best in which consumer prices are equal to producer prices is inefficient. When the optimal linear rate is positive a ration shop system is inefficient because it increases the wedge between consumer and producer prices for these households, when the optimal rate is negative it decreases this wedge and hence increases the efficiency of the tax system. This also explain why the more the government values public revenues (the higher µ−g) the lower the welfare effect of the RSS: because a government that values public revenues more will set a higher optimal linear rate.
The welfare effect of the RSS is increasing in the share of poor consumption in total consumption (α), and this for two reasons. First, higher poor (relative) consumption, all else equal, increases the welfare effect of subsidizing low levels of consumption as long as gp > gnp. Second, goods with a higher α have a lower optimal linear tax rate, and hence a smaller revenue cost (higher revenue gain ifα >1). The parametersα2(q) andπ2(q) capture the extent to which the higher tax rate on
high consumption levels works as a tax on the non-poor: the lowerα2(q) andπ2(q), conditional on
α, the better the increase in taxes is targeted to non-poor households.
Settingµ=gwe see that the welfare effect of introducing a ration shop system is unlikely to be positive for two types of goods. The first are luxury goods - goods that are hardly ever consumed by the poor: the welfare effect is negative for small values ofαeven when no poor household consumes more than the quota level. Intuitively the redistributive potential of a luxury good is maximized when the government uses a linear tax rate because for this good the linear rate already acts as a proxy for a tax on the non-poor, it cannot be improved by introducing an piecewise increasing tax schedule. The second are inferior goods - goods that poor households always consume more than non-poor households. For these goods α2(q) > 1 and πα < π2(q)α2(q) for all potential
quota levelsq so the total welfare effect will be negative unless behavioral responses are extremely large. The redistributive potential of taxing inferior goods is also maximized with linear rates: if poor households consume more of the good increasing the tax rate on high consumption amounts hurts the poor more than the non-poor.The only rationale for introducing a ration shop system for inferior goods is thus an efficiency one - lowering the subsidy on high consumption amounts - and this efficiency gain will only outweigh the redistributive cost for very large behavioral responses.
Overall expression (4) implies that the welfare effect of introducing a ration shop system at a given quota level will be maximized for necessity goods: goods that many poor households consume but few consume high amounts of (high α, lowα2 and π2). Introducing a RSS for these
goods allows the government to transfer income to poor households whilst still taxing the non-poor or (equivalently) to tax the non-non-poor without taxing the non-poor. Additionally, if the good is consumed more by the non-poor, the welfare effect will be higher the thicker the right-hand side of the distribution and the lower the compensated elasticity of demand of households with high demand relative to the average price elasticity. Finally note that the welfare effect can be positive for goods that poor household consume more than the non-poor on average (α > 1) as long as the non-poor are still more likely to consume high amounts(α2(q) < α): goods that only a few
non-poor consume but in high amounts and that most poor households consume in low amounts are also potential candidates for inclusion in ration shop systems.
3.4 Ration shop systems as insurance against price risk
Consider now a world in which the price of the good z varies at the local level.19 Each household faces the same probability distribution of z, symmetric around a mean ¯z with minimum zmin and coefficient of variation σ. Households’ risk preferences are characterized by their relative risk aversion coefficient ri. I assume for now that the prices of all other goods are held constant (this assumption is relaxed in the appendix). A ration shop system now sets the price of the good equal to a fixed price ˜z ≤ zmin below a quota level q. This is equivalent to introducing both a fixed decrease in the tax rate dt1 = ¯z−z˜ and a ‘price stabilizing transfer’ z−z¯, positive or negative
depending on the value ofz faced by the household.
The welfare effect of price-indexed transfers is governed by the impact of prices on the marginal utility of incomevyi:
∂vyi(yi, z)
∂z =
vyi(yi, z)
z+t si(z)[r−η] (5)
This equation implies that price-indexed transfers of mean zero will increase households’ indirect utility as long as their relative risk aversion is sufficiently high relative to their income effect. I assume throughout that r > η so that there are gains from social insurance - as long as r ≥1 a sufficient condition for this inequality to hold is that the good is not a luxury good (none of the goods considered in the calibration below are).
To understand the welfare effect of introducing a ration shop system in the presence of price risk I consider the expected value of price-indexed taxes and transfers by taking first-order linear approximations. Consider first the welfare impact of introducing a piecewise increasing tax in a world with price risk. The impact of an extra tax dt on consumption of the good can be written as:
E(vi(yi, z+t+dt)) =E(vi(yi, z+t))−viyxi(1 +si(r−η)σ2)dt (6)
where vyi, xi and si are evaluated at z = ¯z+t. This implies that the marginal social welfare cost from levying a taxdton household iis gixi(1 +si(r−η)σz2)dt < gixidt.20 The welfare cost of taxation is decreasing in the level of price riskσ so optimal linear taxes will be increasing in price risk. This is because consumption taxes tax households less in states of the world in which the price is high (because they consume less in those states) and their marginal utility of income higher (by assumption that (5) is positive), thereby providing them with insurance.21 This insurance gain is higher for households that spend a larger share of their income on the good because they are more exposed to the risk. Introducing a non-linear tax (without a price stabilization component) in a world with price risk therefore has a higher behavioral cost than in a world without price risk because the optimal linear rate is higher as well as a positive (negative) insurance effect on households consuming more (less) than q.
Turning now to the price stabilization component of the RSS consider households consuming more thanq. They receive a transfer (z−z¯)q whose impact on utility can be written as:
E(vi(yi+q(z−z¯), z+t)) =E(vi(yi, z+t)) +vyiqsi(r−η)(¯z+t)σ2 (7)
The marginal social welfare effect of transferring (z−¯z)q to household i consuming at leastq
is thus given bygiqsi(r−η)(¯z+t)σ2>0. The transfer has mean zero but a positive welfare effect because it provides the household with partial insurance against price risk.
Finally households consuming less thanq are faced with a fixed price ¯z. This has the following impact on their utility:
20Hereg
i is defined as the social value of giving householdian extra unit of income when the price is equal to ¯z:
gi= ∂G∂vi
iviy(¯z).I assume that parametersandηdo not vary withz.
21
E(vi(yi,z¯+t)) =E(vi(yi, z+t)) +viy(si(r−η) +)xi(¯z+t)σ2 (8) The marginal social welfare effect of stabilizing the price for householdi,gi(si(r−η) +)xi(¯z+
t)σ2, is positive if si(r−η) + >0. This result, first derived in Turnovsky et al. (1980), states that households value price stabilization if their relative risk aversion is high relative to their price and income elasticities of demand (in absolute value). Intuitively when the relative price of a good increases households can diversify their consumption to other goods (an indirect utility gain) but find that their income enables them to buy less of the good (an indirect utility cost). Households with lower absolute value price and income elasticities will substitute their consumption away from the good less when its price increases and thus experience a bigger loss. Note that this transfer does not have a mean of zero: households receive a positive transfer when their consumption is low and a negative one when their consumption is high, these transfers are a share of their consumption so the total effect on government revenues is positive and given by −xi(¯z +t)σ2. The total welfare effect of stabilizing the price of the good for householdiconsuming less thanq is therefore [gisi(r−η)−(µ−gi)]xi(¯z+t)σ2.
Adding these effects across all households we get the following proposition.
Proposition 3 The welfare effect of introducing a ration shop system at quota level q in a world in which the price of the good varies, dWP(q), is equal to the welfare effect in a world without price risk (4) plus an insurance effect:
dWP(q) =dW(q) +σ2{−(r−η)[
R
xi≥qgisixi
x2(q)(1−H(q))
θ(q)
θ(q)−1 −
R
gisixi
x (1 +
φ(q)
θ(q)−1)] (9)
+ (r−η)(¯z+t)[
R
xi<qgisixi
x1(q)H(q)
θ(q)
θ(q)−1 +
R
xi≥qgisiq (x2(q)−q)(1−H(q))
]−(¯z+t)
R
xi<q(µ−gi)sixi
x1(q)H(q)
γ(q)
θ(q)−1}
where γ(q) =
R
xi<qxidi R
xi≥qqdi. The first line represents the effect of introducing a piecewise increasing
tax without a price stabilization component, the second line is the effect of the price stabilization component.
households are extremely responsive to changes in prices - in which case they value the insurance less and the efficiency cost (price distortion) of price stabilization dominates. When positive the total insurance effect is increasing in the level of price risk σ and the budget share of the good, particularly amongst the poor.
3.5 Home production
I introduce the possibility that households consume from their own production of the good by assuming that each household is endowed with an amount of the good ωi.22 This endowment can be consumed or sold on the market at pricez. Householdi’s budget constraint under a linear tax is thus (z+t)xim+zxih≤Ri+zωi whereRis non-endowment income andxm is purchased amounts of the good, xh ≤ω consumption from home production. Redefining x =xm and y(z) =R+zω the welfare effect of introducing a RSS in the absence of price risk is still given by expression (4). In a world with price risk home production endowments play a more significant role: they provide households with partial insurance against changes in market prices as endowment income increases with the price. The impact of prices on the marginal utility of income vyi is now given by:
dvyi(yi(z), z)
dz =
vyi(yi(z), z)
z+t [si(z)(r−η)−rsωi(z)] (10)
whereswiis the endowment income share. Households with a large endowment relative to their consumption of the good (and in particular net producers of the good for which sωi > si) will see their marginal utility of income decrease withz: for these households the positive effect of an increase in price on their endowment income outweighs the negative impact on the consumption price. The total insurance effect of introducing a ration shop system in a world with price risk and home production endowments is therefore equal to the insurance effect in a world without endowments plus an extra term that’s a weighted function of households’ endowment shares.
Proposition 4 The welfare effect of introducing a ration shop system at quota level q in a world with price risk and in which households have endowments of the good, dWH(q), is equal to the welfare effect without endowments (expression (9)) plus an extra term:
dWH(q) =dWP(q) +σ2{+r(
R
xi≥qgisωixi
x2(q)(1−H(q))
θ(q)
θ(q)−1 +
R
gisiωxi
x (1 +
φ(q)
θ(q)−1)) (11)
−r(¯z+t)(
R
xi<qgisωixi
x1(q)H(q)
θ(q)
θ(q)−1 +
R
xi≥qgisωiq (x2(q)−q)(1−H(q))
) +(¯z+t)
R
xi<q(µ−gi)sωixi
x1(q)H(q)
γ(q)
θ(q)−1}
The extra terms that are a function of the distribution of sωi will be negative for most values of the parameters for the same reasons that (9) tends to be positive. Intuitively the endowments
22The assumption of fixed endowments is motivated by data constraints in the calibration exercise: no estimates
provide households with some insurance against price risk by indexing part of their income to the price and therefore lower the potential insurance gains from introducing a RSS. The total insurance effect will therefore be lower for goods for which i) endowments represent a higher share of income on average ii) households with high purchases of the good (those for which the potential insurance effect is highest) also have high endowments iii) endowments represent a larger share of poor households’ incomes.
3.6 Extensions
Two of the model’s assumptions can be relaxed in a simple way to more closely resemble the context of developing countries. First, the assumption that the government has no capacity to identify household’s poverty status is extreme: in practice most developing countries are able to exclude some non-poor households from the list of eligible households. In the appendix I introduce imperfect targeting in the model by assuming that the government’s alternative use of funds is a transfer that reaches poor households with probability ˆπ and non-poor households with probability 1−ˆπ. Imperfect targeting is captured by the assumption 1 > π > πˆ and the marginal value of public funds is nowµ= ˆπgp+ (1−πˆ)gnp > g. Comparing this to a setting in which the government has no targeting capacity and the marginal value of public funds is simplyg, I show that the total welfare effect of introducing a RSS is decreasing in the government’s targeting capacity ˆπ−π: the redistribution gain from ration shops are more likely to be negative if the government has access to another redistributive instrument. If the government can perfectly target poor households (ˆπ = 1, as is arguably the case in rich countries) the redistribution effect of introducing ration shops is always negative.
Second, I relax the assumption of no administrative or corruption costs of introducing ration shops. I assume instead that for each unit transferred to households through the RSS the govern-ment must spend (1 +β) units whereβ >0 is the leakage rate. This decreases the welfare effect of introducing ration shops byµβγ(θq−1)+1: the negative impact of leakages increases with the value the government places on public revenues µand the relative cost of subsidizing low levels of consump-tion γ(q), and decreases with the revenue potential of taxing higher levels of consumptionθ(q). I consider the impact of relaxing both the no-corruption and the no-targeting capacity assumptions in the calibration results for India below.
and the prices of these two goods are perfectly negatively correlated the price risk for these two goods cancel out and there is no need for social insurance; if on the other hand they are perfectly positively correlated insurance against variations in the price of one of the goods is more valuable the more the household consumes the other good. The overall insurance effect of introducing a RSS for one good when the price of all goods co-vary is therefore increasing in the correlation between the price of this good and the price of all other goods. Appendix Table A2 shows that the prices of the goods considered in the calibration are on average positively correlated with each other, as we would expect if supply shocks affected the production of all goods in a similar way. This suggests that focusing on price risk for one commodity at a time, as I do in the calibration, under-estimates the total insurance effect of introducing ration shops. Again, this effect is likely second order because correlations are small.
4
Data and method
This section details the data and method used to estimate the welfare effect of introducing ration shops in India (calibration of expressions (4), (9) and (11)).
4.1 Data
I use the 68th round of the nationally representative annual consumption survey carried out by the Indian National Sample Survey Organisation (NSSO). The survey contains detailed information on all goods consumed over the last month by 120,000 households in 2011-2012 within the twenty largest states of India. It is stratified by urban and rural areas of each district and by quarter of the year in order to be representative at that level and I use the household level sampling weights provided by the NSSO. I consider eight good categories of interest: rice, wheat, sugar, kerosene, coarse cereals, pulses, cooking gas and ‘meat and fish products’.23 The first four goods are sold in ration shops in most states and so are coarse cereals in some Eastern states. I also consider pulses and ‘meat and fish products’ because they are consumed by most households and represent a non-negligible share of the typical household’s budget, making them potential candidates for inclusion in the RSS: 62% of households consumed meat and fish products in the last month, 98% consumed pulses.24 Cooking gas (known as LPG in India) is of intrinsic interest as the main commercial source of energy used by households besides kerosene. Moreover, the Indian government has long subsidized cooking gas with linear subsidy but in 2013 set a household quota on the amounts subsidized, effectively introducing a RSS for cooking gas with very high quota levels (IISD, 2014). Including cooking gas in the calibration allows for an evaluation of the welfare effect of this policy change.
Importantly for the purpose of this paper the survey asks households to report for each good i) their purchases from the ration shops ii) their market purchases iii) their consumption from home
23
Coarse cereals include jowar and small millets, staple foods in many parts of East India. The list of items included in each good category can be found in the online Appendix.
24
production. This enables me to estimate households’ counterfactual consumption in the absence of taxes and ration shops and measure the endowment shares of income for each good (see below). Households also report both the quantity and the value of the goods purchased, I use unit values (ratios of values to quantities) as proxies for the price of the good when sold on the market and when sold through the ration shops.
This survey is typical of consumption surveys that are routinely done in developing countries, though considered to be of high quality it has some limitations (see Deaton, 1997, for a detailed description of the survey). In particular it does not attempt to directly measure income. I use total consumption expenditures as a proxy for income following the methodology used by the NSSO itself, and apply the statelevel official poverty lines to categorize households as poor or nonpoor -the share of poor households (π in the model) in the population is 22.2%. These poverty line levels are computed on the basis of estimates of households’ total expenditures obtained using the NSSO surveys and are designed to be applied to this total expenditures variable and not households’ incomes.25
4.2 Household and government preference parameters
Demand elasticity estimates for India are scarce, evidence of how they differ across household groups inexistent; I assume for simplicity that price and income elasticities are homogeneous across households. I use estimates of price and income elasticities for the food commodities from Kumar
et al. (2011) and from Gundimeda and Khlin (2006) for kerosene. As robustness checks I set all demand parameters equal for all goods and consider alternative estimates of the price elasticity for food commodities found by Deaton and Subramanian (1994).26 I use a relative risk aversion coefficient value of 3 as a baseline, in line with experimental estimates found by Carlsson et al.
(2003) amongst Indian subjects, and also consider results for alternative values and different risk aversion levels for poor and non-poor households. Baseline results assume the government values an extra unit of income to the poor twice as much as that to the non-poor (gp = 2 and gnp = 1) and set the marginal value of public funds (µ) equal to the average welfare weightg. I also consider results for alternative poverty lines and allowing for limited targeting capacity, as I explain below.
4.3 Counterfactual distributions of consumption
Expressions (4), (9) and (11) cannot be directly calibrated using the distributions of consumption in the survey because observed consumption amounts are affected by existing taxes and subsidies. I simulate hypothetical consumption for alternative tax schedules by taking linear approximations
25
This method likely underestimates the income of the richest households, which tend to be under-represented in consumption surveys anyways. The numerical analysis is therefore unable to consider the extent to which a RSS can tax the richest households, a relatively untapped source of government revenues in India (Piketty and Qian, 2009).This limitation of the data mirrors a limitation of commodity taxation in practice: progressive taxation of the very rich is unlikely to be achieved through commodity taxes.
26
around the existing tax schedules, using the demand elasticities described above and the consump-tion taxes, RSS quotas and prices in place in India in 2011-2012. I use the commodity-level VAT rates levied by each state for the consumption taxes. As explained above the ration prices and quo-tas are not uniformly defined across households but vary depending on household characteristics (possession of poverty cards, location and demographic characteristics) not observed in the survey. I therefore use the ration price and consumption from ration shops declared by households to proxy for the parameters of the RSS that they face.27
4.4 Price risk
To proxy for the price risk that a typical Indian household faces I consider within-market variations in unit values over time using the NSSO consumption surveys for the years 2002-2003 to 2011-2012 to capture time variations. I define a market as the lowest geographical unit at which the NSSO surveys are representative in all years - the rural and urban parts of each of the 77 NSS regions (which I call sub-regions), defined as areas within a state with similar agro-climatic conditions.28 I use within sub-regions across quarters variation in mean unit values (deflated using an all-India commodity specific deflator) to proxy for the coefficient of variation σ for each good. To avoid capturing variations that are due to changes in the item-level composition of consumption in each good category of interest I consider the price variation of the most widely consumed item in each good category for each sub-region (for example I use the price variation of the item ‘chicken’ for the good ‘meat and fish’ in most sub-regions). Baseline results assume all households face the same level of price risk but poorer households may face different levels of price risk from non-poor households (poorer households are more likely to be in remote rural areas) so I also measure price variations over time for poor and non-poor households separately and discuss results obtained allowing for these different levels of price risk.
There are several known shortcomings of using unit values as a proxy for prices: variations in unit values may reflect measurement error, quality effects, or non-linear (market) price schedules (see for example Deaton and Tarozzi, 2005). This could lead me to over-estimate the level of price risk faced by households. I compare unit values from the survey to an alternative measure of price from the rural price collection survey undertaken by the NSSO at the village level to compute a nationally-representative rural consumer price index and find remarkably similar distributions in both datasets (including very similar coefficients of variation - see appendix section 2.3 for more details). This dataset is only available for rural areas so cannot be used in the calibration but the
27In line with the model’s assumptions I assume full incidence of taxes on consumers. Unit values as a proxy for
market prices are not available for households that do not purchase the goods outside the RSS, I use median within district market prices to proxy for the price that these households would face should they choose to buy on the market.
28Evidence in Atkin (2013) suggests each village in rural India may be a separate market, but village-level price
comparison suggests unit values are a reliable proxy for prices.
4.5 Home production
The survey reports households’ consumption of each good from their home production but not how much they produce. At baseline I simply assume that a household’s consumption from home production is equal to its endowment. This likely under-estimates households’ endowments: house-holds which produce goods available in ration shops may choose to sell their endowments because the market price is higher than the ration price. I therefore also estimate alternative endowment values using the fact that land is the main input into home production and information in the survey about the amount of land owned by each household. To do this I assume that households that do not use the ration shop system have an incentive to consume their home production29and estimate the relationship between land and consumption of each good from home production amongst these households. Crops are differently suited to different areas so I estimate the relationship separately in each NSS sub-regions. I then use these estimates to predict each household’s endowment of each good based on the amount of land they own (see the appendix for more details).
4.6 Calibration parameters
Table 3 presents the key characteristics determining the welfare effect of ration shop systems for each good. I first present characteristics of the distribution of consumption: the share of poor consumption in total consumption (α) and both the share of poor consumption in total consump-tion by households consuming at least q (α2) and the share of poor households amongst these
households (π2) for quota levels equal to the 10th, 25th and 50th percentiles of the distribution of
consumption.30 We see that there are three types of goods. First, rice wheat and kerosene are ne-cessity goods that poor households consume slightly less than poor households (αclose to 1). As we consider consumption above potential quota levels we see that poor households are both less likely to consume more than a given level of the good (π2(q) is decreasing withq for rice and kerosene),
and, when they do, consume lower amounts on average than the non-poor (α2(q) also decreasing
with q for all three goods). The share of poor consumption in total consumption is high and falls particularly fast as we consider higher potential quota levels for kerosene; this suggests kerosene may be a particularly good candidate for inclusion in a RSS from a redistribution perspective. Second, meat and fish products, pulses, sugar and cooking gas are traditional normal goods: they are consumed substantially more by the non-poor (α below two-thirds), and poor households are less likely than non-poor households to consume high amounts (π2(q)< π, whereπ = 0.22). This
is especially true for cooking gas. Note however that these goods are consumed in large quantities by some poor households: α2(q) is increasing in q for all four goods. Finally coarse cereals are
29
Households with no access to the RSS will choose to consume their home production prior to buying from the market as long as there is some cost of bringing their home production to the market.
30
consumed more by poor households than non-poor households on average, but the share of poor consumption in total consumption falls as we consider consumption above given quota levels. This is because coarse cereals are consumed by few non-poor households but in large amounts by those non-poor households that do consume the good. Price and income elasticities presented in Table3
are low overall, except for meat & fish products and kerosene.
Turning to determinants of the insurance effect of a RSS we see that price risk is highest for the three cereals, as expected given the very local nature of markets for cereals in India. It is lowest for sugar, a commodity whose production is less influenced by local weather conditions. Budget shares are large for rice and to a lesser extent for cooking gas, meat and fish products and wheat. The good with the lowest budget share is kerosene. Finally, the income share of home production endowments is negligible for all goods except the three cereal types. These shares are orders of magnitude lower than budget shares, particularly amongst the poor.
5
Welfare impact of ration shops in India
Table4presents baseline results. Typical quota levels in India today are located between the 10th and 50th consumption percentiles of consumption for all goods so I focus on welfare effects obtained for quota levels at the 10th, 25th and 50th percentiles of the distribution of consumption.31 The first three columns report the effect of introducing a ration shop system in a world without price risk - expression (4) above. Recall that in this world the effect can only be positive if it enables the government to redistribute from the non-poor to the poor or (if the good is consumed more by the poor on average) if it lowers the tax distortion on households with higher demand for the good. We see that the effect is positive for all quota levels considered for rice, kerosene and coarse cereals - the three goods consumed relatively more by the poor on average. It is negative or very small for the four goods with the lowest poor consumption share - pulses, sugar, meat & fish products and particularly cooking gas which has a very small poor consumption share. And finally it is positive for lower quota levels for wheat, which has an intermediate poor consumption share. Note that the effect is particularly large for kerosene - it is at least three times the effect for rice at all quota levels. This is because the share of poor consumption in the total above a given consumption level declines steeply for kerosene as we move up the distribution of consumption, as seen in Table 3.
The next three columns report the added effect on welfare of introducing a ration shop system in a world with price risk - the insurance effect in expression (9) above. This effect is positive and increasing with the quota level, as expected: as the quota level increases the ration shop system insures a larger share of consumption against price fluctuations. It is substantially larger for rice than for any other commodity because both the average budget shares and the level of price risk are high for rice. It is very low - at least four times smaller than for rice - for sugar and kerosene; sugar has both a low budget share and low price risk, kerosene has high price risk but a very low budget share. The insurance effects for meat & fish products and pulses is comparable to, or higher
than, that for coarse cereals despite lower levels of price risk; this is because these goods represent a higher share of the budget of households that consume them.
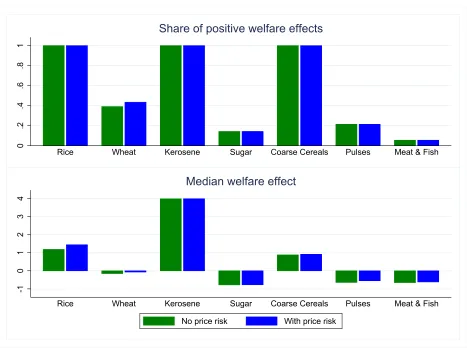
Finally the last three columns present the total effect in the presence of price risk - the sum of the effect without price risk and the insurance effect. We see that the total welfare effect is always positive for kerosene, rice and coarse cereals, but the source of these positive effects is different for these three goods. For kerosene the insurance effect is negligible but it represents 4-30% of the total effect for rice and 3-8% of the total effect for coarse cereals. Total effects are positive for wheat except at the high quota level at which the negative redistribution effect dominates. The welfare effect is negative for meat & fish, pulses and sugar except at low quota levels where the insurance effect compensates for the negative redistribution effect - though note that even at these low quota levels the total effect for these goods is at least five times smaller than that for wheat. Finally the total welfare effect of introducing cooking gas in a RSS is negative and of much bigger magnitude than that for all other goods at all possible quota levels. This is due to the very low share of poor households consuming non-negligible amounts of cooking gas and suggests that as long as we place a higher welfare weight on poor than on non-poor households the 2013 reform was welfare decreasing. I exclude cooking gas from graphical results in what follows for ease of exposition, no robustness check or alternative calibration specification ever leads to positive welfare gains for this good. Figure 3 explores the distribution of welfare effects for quota levels below median consumption levels in more detail.32 The top graph considers how often ration shops have positive welfare effects if we randomly pick a quota level, the bottom graph presents the median value of the welfare effect over all quota levels. Both graphs paint a similar picture: welfare effects are always positive and large for rice, kerosene and coarse cereals; the welfare effect is positive for half the quota levels for wheat, and negative in the majority of cases for sugar, meat & fish products and pulses.
Turning to the effect of home production, appendix Table A3 presents results allowing for home production, using both methods detailed above to estimate home production endowments. Results are extremely similar when home production is introduced, as expected given the low home production endowment shares seen in Table 3. Allowing for home production only affects results for cereals, and marginally so - the total welfare effect of introducing a ration shop at a quota equal to the 25th percentile decreases by 1-6% for the three cereal types.
5.1 Robustness checks
Several parameters of the calibration are likely specified with error, I present robustness checks changing the value of these parameters in the appendix. First, there is uncertainty regarding the real values of the demand elasticities so I consider results obtained by setting the same elasticities for all goods. I bias against finding a positive welfare effect by setting income and price elasticities
32Results for higher quota levels are available upon request. They are more sensitive to changes in the right tail
to their lowest level observed across all goods (-0.8 for the price elasticity and -0.1 for the income elasticity). Results are extremely similar to those obtained using baseline values: the only change of note is a clear decrease in the total welfare effect for meat & fish due to the fact that the baseline value of the income elasticity is high for this good (see appendix Table A4, first three columns). This robustness of results to changing the value of demand parameters suggests that letting demand parameters vary with consumption levels wouldn’t affect the results in a meaningful way. Results are also qualitatively similar when I vary the value of relative risk aversion - the insurance effect increases in the value of the risk aversion coefficient, as expected, but the overall conclusion remains unchanged.
Second, measurement error could lead to some households reporting abnormally high consump-tion value. These observaconsump-tions could affect the calibraconsump-tion results through their impact on the right-hand tail of the distribution of consumption (parameters θ(q), α2(q) and π2(q)). Appendix
Table A5 presents results obtained when excluding households consuming more than the 99th or 95th percentile of consumption for each good. The total welfare effect decreases a little for wheat (the good with the highest right-scale parameter at baseline, see Table3) but key results - positive and large welfare effects for rice, coarse cereals and particularly kerosene, negative average effects for meat & fish, sugar and pulses - are unchanged.
Third, I consider alternative classifications of households as poor or non-poor in appendix Table
A9. Robustness to the definition of the poverty line is of particular concern as measurement error means some households are likely wrongly classified so I present results obtained when increasing or decreasing the state-level poverty lines by 5, 10 or 20% (this varies the poverty headcount ratio from 10% to 36%). Welfare effects of introducing a RSS vary when the poverty line changes -they tend to increase as the poverty line increases - but the key results remain: gains are always highest for kerosene, followed by the three cereal types. They are never positive for the other goods considered except at low quota levels with high poverty lines.
Fourth, note that some of the eight good categories considered (coarse cereals, meat & fish products and pulses) aggregate several different commodities. By aggregating all meat & fish products in one single good category I am implicitly assuming that one kilo of fish sold through the ration shop would be a perfect substitute for one kilo of mutton or chicken. To relax this strong assumption I calibrate the welfare effect of introducing a RSS for the commodities most commonly consumed in each category in appendix Table A10. Results obtained at the commodity level are similar to those obtained at the good level: welfare gains are always negative for arhar (the most common pulse) and chicken (the most common meat & fish product) and always positive for jowar (the most common coarse cereal), for which the welfare gains now exceed those for rice.