Simulation of Solid Particle Impact Behavior for Spray Processes
Kensuke Yokoyama
1;2;*, Makoto Watanabe
1, Seiji Kuroda
1, Yoshihiko Gotoh
2,
Tobias Schmidt
3and Frank Ga¨rtner
31
Coating materials group, Composites and Coatings Center, National Institute for Materials Science, Tsukuba 305-0047, Japan 2Department of Materials Science and Technology, Science University of Tokyo, Noda 278-8510, Japan
3Helmut Schmidt University, Hamburg, Germany, D-22043
Several thermal spray processes developed recently are characterized by relatively low temperature and higher velocity of sprayed particles. They include cold spray, high velocity oxy-fuel spray, and warm spray, in which majority or all the sprayed particles are in solid phase when impinging onto the substrate surface. Therefore, in order to understand the coating formation process of such processes, detailed knowledge concerning impact phenomena of a solid particle is essential. It is generally accepted that there exists a minimum velocity beyond which a particle adheres to the substrate and this velocity is called the ‘‘critical velocity’’. How the critical velocity depends on various materials and process variables is not fully understood yet. In this study, analysis of a metal particle impacting onto a metal substrate was carried out by using a dynamic finite element code (ABAQUS). Effects of a substrate and a particle temperature on the critical velocity were numerically studied. Also, effects of thermal conduction on the simulation results were discussed. It was found that critical velocity decreases with 1) higher stiffness of the substrate, 2) higher particles temperature, and 3) greater particle size. [doi:10.2320/matertrans.47.1697]
(Received December 28, 2005; Accepted May 29, 2006; Published July 15, 2006)
Keywords: cold spray, high velocity oxy-fuel spray, warm spray, solid particle impact, critical velocity, thermal sprayed coating, finite element method
[image:1.595.313.544.360.513.2]1. Introduction
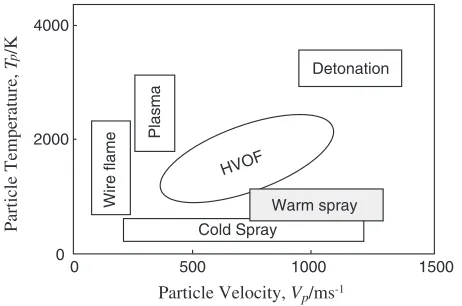
Fig. 1 shows various thermal spray techniques classified in terms of particle velocity and temperature.1–3)Among these, high velocity oxy-fuel (HVOF), cold spray and warm spray3) are characterized by relatively high particle velocity and low particle temperature during deposition; the temperatures of majority or all the sprayed particles can be lower than the melting point of the powder material in these processes. Most recently, cold spraying is becoming popular by which coatings can be produced without significant heating of the sprayed powder.2,4–9)Warm spraying is a new spray process developed by the National Institute for Materials Science, which occupies a position between HVOF and cold spray as shown in Fig. 1.3)In these processes, coating deposition is governed by the impact phenomena of solid spray particles. Therefore, it is essential to understand the impact phenomena between a solid particle and a substrate in order to understand the deposition mechanisms. It is generally accepted by various experimental results that there exists a critical velocity, which the particle velocity has to exceed in order to obtain a coating successfully as shown in Fig. 2.9)Critical velocity depends on sprayed materials and is very important for spray techniques based on the impact of solid particles. Assadi et al. carried out dynamic numerical analyses to simulate such solid particle impact behavior for cold spray process focusing on critical velocity.4,8)They calculated the deformation of both the particle and the substrate, together with the resultant strain and temperature distribution as a function of time under adiabatic condition by dynamic analysis. The critical velocity was determined as the velocity at which the maximum local temperature reaches the melting point of the particle. Since their study focused on the situation that a particle and the substrate were the same
Plasma
Wire flame
HVOF
Warm spray Detonation 4000
2000
500 1000 1500
Particle Temperature,
T
p
/K
Particle Velocity, Vp/ms-1
Cold Spray 0
0
Fig. 1 Classification of thermal spray processes based on the temperature and velocity of sprayed particles.1–3)
Deposition efficiency
Particle velocity
Abrasion
Deposition
0
100
v
crit
Fig. 2 Concept of critical velocity9) *Graduate Student, Science University of Tokyo
[image:1.595.312.541.590.757.2]material intending to simulate the coating deposition process and doesn’t consider the effects of the substrate mechanical properties for impact between different materials which are corresponding to adhesion of the first layer of a coating. In this study, the effects of substrate material properties are investigated as well as the influence of thermal conduction and the initial temperature of a particle on the impact behavior.
2. Analysis
The analyses were carried out by using a commercial finite element code (ABAQUS/explicit version 6.5). Figure 3 shows the axisymmetric analysis model used in this study. A particle with radiusris impacting on the substrate.Tpand
Ts are the temperature of the particle and the substrate
respectively. Johnson-Cook plastic deformation model were applied to express high strain rate plastic hardening of the materials.10,11) It takes into account strain hardening and thermal softening effects, and strain rate dependence.
¼ ½AþB"n½1þCln"½1Tm ð1Þ
whereis flow stress,"is plastic strain,Ais yield stress,Bis strength coefficient,nis strain hardening exponent,Cis strain rate coefficient, " is normalized strain rate, and Tm¼ ðTTrefÞ=ðTmTrefÞin whichTmis melting point, andTref
is room temperature. This model may not be enough to describe such wide range of strain rate as 106{109/s1
estimated in cold spray or warm spray deposition, but for most materials, this approximation still supplied a reasonable explanation of high strain rate deformation in past work.4,8)
Firstly, calculations were done under the assumption of adiabatic process (no heat transfer). According to the reference,4)if a value of x
el2=Dtht is equal or above 1, the
adiabatic assumption is justified based on the diffusive heat equation, wherexelrepresents an element size andDthandt
are the thermal diffusivity and the process time respectively. Substituting typical valuexel¼1mm,Dth¼106m2/s, t¼
10ns for the current study, providesxel2=Dtht¼100.
There-fore adiabatic assumption could be reasonable. On the other hands, the influence of the heat transfer is still of interest. The results obtained by including heat transfer were compared with the ones for adiabatic case.
Table 1 shows the examples of the material properties of copper and low carbon steel used in the analyses. Note that most of parameters were set as a function of temperature based on handbooks11,12) and only the values at room temperature are shown in Table 1.
3. Results and Discussions
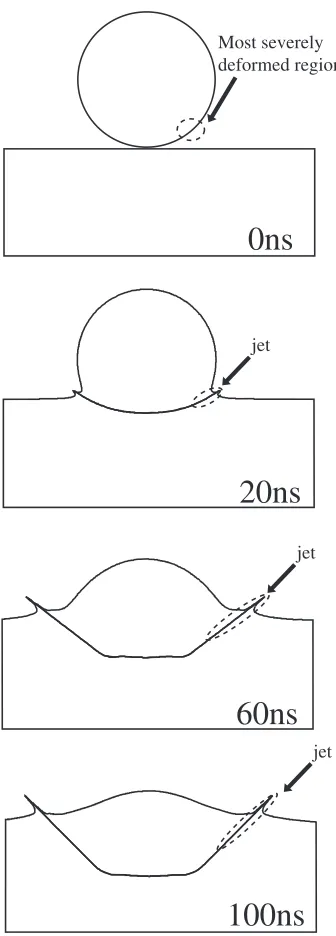
Figure 4 shows the step-by-step deformation during impact of a copper particle onto a copper substrate calculated for the particle velocity of 550 m/s and the particle radius of 50mm. The initial temperatures of both particle and substrate were 293 K. Out-flowing of a jet is recognized from the interface between the particle and the substrate. The diameter of the particle after impact is about twice the one of the particle before impacting. The largest deformation occurs around the circled regions, and therefore the highest temper-ature increase are expected in these areas. Since the region where the maximum temperature appears is very localized, the mesh size used in calculation significantly affects the value as shown in Fig. 5. Maximum temperatures obtained with mesh size of 0.5 and 1mmare shown for three different impact velocities at 400, 550 and 600 m/s. As can be seen, the maximum temperature increases significantly with small-er mesh size. Since it takes impractically a long computation time with mesh size below 0.5mm, the maximum temperature for each velocity was determined by extrapolating the line connecting the two data points obtained at 0.5 and 1mmmesh size to zero. Strictly speaking, however, as the mesh size is decreased further below 0.5mm, the maximum temperature must converge to the true temperature and this would rather occur asymptotically than lineally for very small element size
Radius, r
Substrate
(Temperature, Ts)
Particle
(Temperature, Tp)
Velocity, V
Axisymmetric axis
[image:2.595.87.258.73.366.2]Fig. 3 Schematic of analysis model: a particle (radiusr, temperatureTp, velocityV) impacting on a substrate (temperatureTs).
Table 1 Example of material properties used in the analysis (for room temperature case). In this study, most of the parameters were set as temperature dependent values based on handbooks.11;12Þ
unit Cu Carbon Steel
Density kg/cm3 8960 7870
Elastic modulus GPa 124 210
Specific heat J/(kgK) 383 486
Melting point K 1356 1538
Thermal expansion
coefficient 10
6K1 16.5 11.6
Yield stress MPa 90 175
Strain hardening
component 0.31 0.39
[image:2.595.305.549.104.224.2]region. Nevertheless, we can estimate that the error due to the convergence would be 5{10% if the converged values are obtained at 0.2mmmesh size for example.
[image:3.595.83.251.68.536.2]A series of such calculation was carried out for a copper particle of 50mmdiameter impacting onto a copper and steel substrate with various velocities. The initial particle temper-ature was assumed at room tempertemper-ature. Figure 6 shows how the maximum local temperature during impact deformation increases with the impact velocity for the two kinds of substrate materials. It increases almost linearly with the particle velocity and levels off at the melting point of Cu. Impacting on carbon steel results in remarkably higher maximum temperature as compared to the copper substrate. This is because the particle impacting on the carbon steel substrate undergoes much higher deformation than on the copper substrate because of the former material’s higher hardness. As the result, the temperature increase in the particle impacting on carbon steel can be higher than the case for the copper substrate. The critical velocities are obtained at these curves’ cross points where the maximum temperature reaches the melting point of copper. There are several concepts of adhesion conditions and the definition of the critical velocities but none of them succeeded to provide clear explanations of the particle adhesion behavior so far. In the current study, the definition that at the critical velocity the melting point of a particle is achieved is selected. Based on the past results, this concept gives reasonable values of the critical velocity when compared with experiment.4,8) It should be noted, however, that this assumption essentially tends to overestimate the critical velocity. From Fig. 6, the critical velocity on the carbon steel substrate was estimated as 210 m/s, whereas it was 560 m/s for the copper substrate. Although this result is very useful to estimate the influence of the substrate properties on the critical velocities, it is necessary to be examined by experiments. The validity of the assumed bonding mechanism could be evaluated in such experiments simultaneously.
Figure 7 shows the influence of initial particle temperature on the impact behavior of a copper particle onto a copper substrate. The contours show the equivalent plastic strain
0ns
20ns
60ns
100ns
Most severely deformed regionjet jet
jet
Fig. 4 Sequence of copper particle deformation during impact simulated forr¼50mm,Tp¼293K, andVp¼550m/s showing the formation of jet at the interface.
473 673 873 1273 1473
0 0.2 0.4 0.6 0.8 1.0 1.2
Mesh size, d/µm
Maximum Temperature,
T
/K
400m/s 550m/s 600m/s Copper Melting Point
1073
273
Fig. 5 Maximum temperature variations as a function of mesh size calculated for the particle radius, r of 50mm and the particle initial temperature,Tpof 293 K. The maximum temperatures for infinitesimal mesh size were estimated by linear extrapolation.
Ex trapolated maximum temperature,
Tmax
/K
Cu-Cu Cu-Carbon steel Vcrit
Vcrit Copper Melting Point
1473
1273
1073
873
673
473
273
0 100 200 300 400 500 600 700
Particle impact velocity, Vp / ms-1
1673
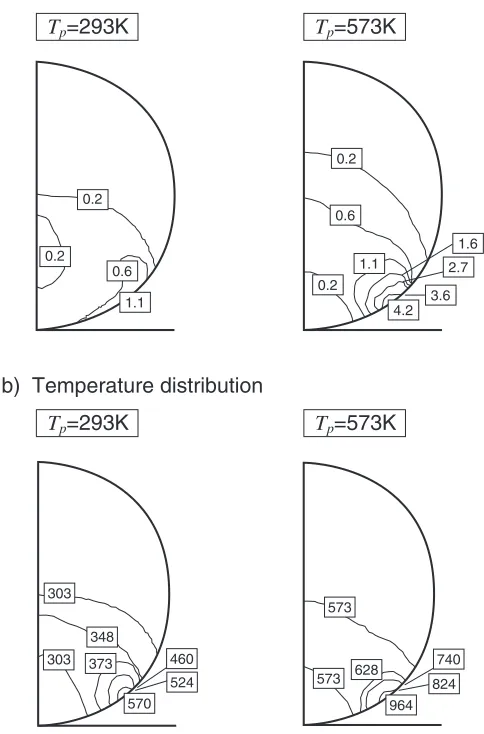
[image:3.595.314.539.75.242.2] [image:3.595.55.284.598.733.2](left) and temperature distributions (right) when the max-imum plastic strain was observed in the jet region of Fig. 4. The calculation was carried out for the initial particle temperature of 293 and 573 K, projected onto the original spherical particle before impact. Note that the values in the contour figures werepre-extrapolated(before the mesh-size extrapolation) and hence the maximum values appear to be smaller than the values after extrapolation such as Fig. 6.The particle with the higher initial temperature undergoes much larger plastic deformation, as shown by the values. In this calculation, it is assumed that 90% of plastic work dissipates into heat (which is defined by the elastic heat fraction).10) Plastic work per unit time depends on the flow stress and the strain rate. As the temperature of the particle increases, the flow stress decreases as expected from eq. (1) resulting in higher plastic work dissipation into heat by higher strain rate and friction at the interface. Thus, higher temperature increase and the reduction of critical velocity increase are expected for the 573 K particle as compared with the 293 K particle.
Figure 8 expresses the variation of critical velocity of a copper particle as a function of the particle initial temperature for the two types of substrate materials. The solid curve is for the copper substrate and the dotted curve is for the carbon steel substrate. As the particle’s initial temperature increases, the critical velocity decreases for the both substrates. Because of our definition of critical velocity, the critical velocity is zero when the particle initial temperature equals to the melting point of Cu. The critical velocities for the carbon steel substrate are about half of these on the copper substrate for the most of the range of particle temperature. This figure summarizes two important points; one is that an increase of particle initial temperature can reduce the critical velocity if there is no other detrimental factor such as oxidation not taken into account here, and secondly a harder substrate can reduce the critical velocity by increase of the plastic deformation of the particle. Also, the results imply a matter of practical importance; when the copper powders without heating are deposited on a carbon substrate, only a first layer can be deposited on the substrate if the particle velocity is between 210 and 560 m/s. In order to obtain a thick coating, the particle velocity needs to be over 560 m/s. These predictions made by simulation also need to be examined by experiments in the near future.
Up to this point, calculation was carried out by the adiabatic model. In order to examine if this is truly the case, effects of thermal conduction are investigated. Basically the same finite element configurations are used for thermal conduction analysis except for the additional calculation regarding heat transfer at each step. In the following, particle and substrate materials are copper. During calculation, the thermal resistance at the interface between the particle and the substrate is assumed to be zero; perfect heat conduction is assumed at the interface. Thermal conductivity of copper used in the calculation is 390 W/(mK).
Figure 9 shows the comparison between the result for the adiabatic model (left), and the thermal conduction model (right) regarding the maximum temperature distribution for the same calculation condition,i.e., the initial temperature of
1.1 0.6 0.2
0.2
T
p=293K
4.2 3.6
1.6 1.1
0.2 0.6 0.2
T
p=573K
b) Temperature distribution
a) Equivalent plastic strain distribution
T
p=293K
T
p=573K
570 524 460 373
348 303
573
628 573
964 824
740 303
2.7
Fig. 7 Comparison of the equivalent plastic strain and the temperature distributions for different initial temperature of particlesTp¼293and 573 K, indicating larger plastic strain and higher maximum temperature for higher initial temperature (Substrate: carbon steel, Particle velocity: 200 m/s, adiabatic model).
600
500
400
300
200
100
0
273 473 673 873 1073 1273
Critical velocity
V
crit
/ ms
Cu-Cu
Cu-Carbon steel
-1
Cu M.P.
Particle initial temperature, Tp/K
[image:4.595.312.542.72.246.2] [image:4.595.47.289.93.460.2]the particle and the substrate are room temperature and the particle velocity is set to 400 m/s. The temperature contours are projected onto the original spherical particle. It is obvious that the thermal conduction model resulted in temperature significantly lower than the result by the adiabatic model. This is because the heat generated during impact dissipates into the substrate and to the interior of the particle by thermal conduction. Such dissipation is neglected in the adiabatic calculation. This implies that thermal conduction can affect the determination of critical velocity significantly.
Figure 10 shows the influence of the substrate preheating temperature for the maximum local temperature during impact deformation. The solid line is the result from the adiabatic model whereas the dotted curve is by the thermal conduction model. In the case of the adiabatic model, the maximum temperature is almost constant for the variation of the preheating temperature because heat transfer does not happen between the particle and the substrate and the effect of preheated substrate only appears in the substrate mechan-ical properties. The results show that softening due to the temperature variation did not produce appreciable effects. On
the other hand, the result of the thermal conduction model shows a remarkably different behavior. When the substrate preheating temperature is relatively lower, the maximum temperature reached after impact is lower than the case of the adiabatic model because heat dissipates from the particle to the substrate. As the substrate temperature increases, this cooling effect becomes less and less and finally seems to turn into positive at around 773 K.
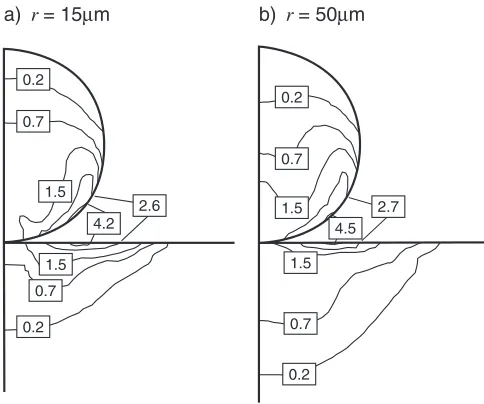
Figures 11 and 12 show the contours of plastic strain for 50 and 15mmCu particles with impact velocity of 500 m/s obtained by the adiabatic and thermal conduction model respectively. In the adiabatic case, the results for the two particles are identical. For the thermal conduction model, however, plastic strains induced within the particle as well as 293
380 468
655
820 776 293
380
468
a) Adiabatic model b) Thermal conduction model
568 453
293 319
553 319
293
605
Fig. 9 Comparison between (a) adiabatic model and (b) thermal con-duction model in terms of the maximum temperature calculated for the initial condition ofr¼50mm,V¼400m/s,Tp¼Ts¼293K.
Maximum temperature,
Tmax
/K
Substrate initial temperature, Ts/K
Adiabatic model
Thermal conduction model
273 373 473 573 673 773 873
[image:5.595.45.547.73.294.2]273 373 473 573 673 773 873
Fig. 10 Influence of substrate initial temperature for the adiabatic model and the thermal conduction model.
a)
r = 15
µ
m
0.2
0.6
0.2 0.6
1.8
3.9
1.4
0.2
0.6
0.2 0.6
1.8
3.9
1.4
[image:5.595.282.546.76.285.2]b)
r = 50
µ
m
Fig. 11 Particle size effect on distribution of equivalent plastic strain calculated for (a)r¼15mm, (b)r¼50mm,V¼500m/s by adiabatic model.
a) r = 15µm
0.2
0.7
1.5
2.6 4.2
0.2 0.7
1.5
b) r = 50µm
0.2 0.7
2.7 4.5
1.5 1.5 0.7 0.2
[image:5.595.56.284.344.480.2] [image:5.595.304.546.352.554.2]in the substrate are greater than these with the finer particle. This leads to a higher maximum temperature for larger particles and hence the critical velocity should decrease with particle size becoming larger.
4. Summary
Impact deformation of a solid metal particle (Cu) onto metal substrates (Cu and carbon steel) was analyzed by a dynamic FEM simulation under the conditions comparable to recently developed thermal spray processes such as cold spraying, warm spraying and HVOF.
(1) As particle initial temperature increases, critical veloc-ity decreases for adiabatic model.
(2) When substrate preheating temperature increases, crit-ical velocity is almost constant for adiabatic model. But for thermal conduction model substrate preheating temperature increases with decreasing critical velocity. (3) There is no particle size effect on critical velocity in the adiabatic model. For thermal conduction model, critical velocity increases with larger particle size.
The results clearly revealed that critical velocity as defined by Assadi is not a unique material property but depends on various factors such as the particle temperature and the substrate mechanical properties. By using a more realistic model taking thermal conduction into account, it was predicted that even particle size could affect the critical velocity.
Acknowledgements
One of the authors (M. Watanabe) would like to acknowl-edge financial support by the Iketani Foundation and by the Ministry of Education, Culture, Sports, Science and Tech-nology of the Japanese Government.
REFERENCES
1) S. Kuroda: Proc. 15th Int. Therm. Spray Conf. (1998), 539–550. 2) S. V. Klinkov, V. F. Kosarev and M. Rein: Aerospace Sci. Tech.9
(2005) 582–591.
3) J. Kawakita, T. Fukushima, S. Kuroda, H. Katanoda, K. Matsuo and H. Fukanuma: Proc. Int. Therm. Spray Conf. (2005) 705–708. 4) H. Assadi, F. Ga¨rtner, T. Stolenhoff and H. Kreye: Acta Mater.51
(2003) 4379–4394.
5) A. P. Alkhimov, A. I. Gudilov, V. F. Kosarev and N. I. Nesterovich: J. Appl. Mech. and Tech. Phys.41(2000) 188–192.
6) C. J. Li, W. Y. Li, Y. Y. Wang, G. J. Yang and H. Fukanuma: Thin solid film.489(2005) 79–85.
7) C. Borchers, F. Ga¨rtner, T. Stoltenhoff, H. Assadi and H. Kreye: J. Appl. Phys.93(2003) 10064–10070.
8) T. Schmidt, F. Ga¨rtner, H. Assadi and H. Kreye: Acta Mater.54(2006) 729–742.
9) D. L. Gilmore, R. C. Dykhuizen, R. A. Neiser, T. J. Roemer and M. F. Smith: J. Therm. Spray Tech.8(1999) 576–582.
10) ABAQUS6.4-1. User manual, Hibbit, Karlsson & Soerensen, Pawtucket(RI), USA(2003).
11) Johnson GR. Prog Astronaut Aeronout (1993) 155–223.