Effect of Prior Deformation on Tensile and Vibration Fracture
Resistance of Friction Stirred 5052 Alloy
Kuo-Tsung Huang
*1, Truan-Sheng Lui
*2and Li-Hui Chen
Department of Materials Science and Engineering, National Cheng Kung University, Tainan, Taiwan 701, R. O. China
In this study, Al-2.5Mg alloy was prepared with different cold rolling reductions, and then friction stir processing (FSP) was performed to investigate the effect of prior microstructure variations on friction stirred materials. The experimental results indicate that the FSP specimens not only had better tensile properties but also better vibration fracture resistance, which would be expected from the microstructural refinement which resulted from the phenomenon of dynamic recrystallization. The stress-elongation curves of all specimens showed the serrated yielding. The higher grain boundary introduced by FSP could hold the mobile dislocations long enough to let Mg atoms form atmospheres around them. Consequently, the effect serration magnitude was more significant on the specimens which were given FSP. This can be ascribed to the grain refinement and the resulting increase of the boundaries which is the main source of obstacles. In addition, the vibration fracture resistance of the FSP specimens shows that the duration of stage I decreases with increasing the prior deformation rate before FSP.
Meanwhile, the prior deformation samples possessed better vibration fracture resistance under the same initial deflection amplitude (6.5 mm). Based on the observed microstructures, this can be attributed to a large number of retained dislocation tangles introduced by prior cold rolling, even after FSP, which improved the crack propagation resistance and reduced the crack propagation rate. The experimental results confirmed that vibration fracture resistance can be quantitatively correlated with the crack tortuosity value which corresponds to the crack propagation behavior. [doi:10.2320/matertrans.47.2504]
(Received March 24, 2006; Accepted August 22, 2006; Published October 15, 2006)
Keywords: aluminum-2.5magnesium alloy, prior deformation, friction stir processing, vibration fracture resistance, sub-grain size
1. Introduction
Friction stir processing (FSP) is an emerging surface-engineering technology that provides the ability to thermo-mechanically process selective locations on a structure’s surface and to some considerable depth (>25mm) to enhance specific properties.1,2) This is accomplished by modifying
technology developed for friction stir welding (FSW).3,4)FSP
uses the same methodology as FSW, but FSP is used to modify the local microstructure and does not join metals together.5–7)In general, friction stir processing can produce
fine recrystallized grains in the friction stir zone due to the phenomenon of dynamic recrystallization.
Al-Mg alloys, which are classified as non-heat treatable and of moderate high strength, have a great potential for microstructural evolution by deformation processing and thus for better mechanical properties.8,9) In particular, Al-2.5Mg alloys have already been used in transportation systems which can experience abnormal vibrations, and hence severe fracture problems occur when the applied vibration frequency meets the resonance.10,11) Our previous
report12)confirmed that the Al-Mg alloy can acquire better
mechanical properties after friction stirring. In addition, previous reports have pointed out13–15)the higher densities of
dislocations and grain boundaries introduced by pre-strain can raise the strength and the ability for absorbing the vibration energy, and consequently improve the crack propagation resistance of Al-Mg alloys. However, the effect of pre-strain on vibration properties of friction stirred Al-Mg alloys is still not clear. In this investigation, we aim to clarify the effect of prior deformation of 5052 base metal on the microstructural features, tensile properties and vibration
fracture resistance through dynamic recrystallization in the stir zone.
2. Experimental Procedures
Al-2.5Mg substrate was slit from a 5052H112 rolled plate (2.58 mass% Mg, 0.26 mass% Fe, 0.21 mass% Cr, 0.15 mass% Si and 0.1 mass% Mn) and prior deformation samples with different cold rolling reductions (12, 25 and 50%) were prepared for friction stirring (a schematic illustration of FSP is shown in Fig. 1). A single pass FSP was performed with the tool rotation speed set at 2300 min1,
the tool moving speed 160 mm min1, the tool angle 1.5,
and the downward push force 19.6 MPa. In this study, the friction stirred specimens are designated as ‘‘FBM (base metal) and F-O (fully annealed)’’ hereafter, and the prior cold rolled specimens will be designated as ‘‘PDF12 (12%)’’, ‘‘PDF25 (25%)’’ and ‘‘PDF50 (50%)’’, respectively.
Moving Direction
Fig. 1 Schematic illustration of the friction stir process (FSP).
*1Graduate Student, National Cheng-Kung University
*2Corresponding author, E-mail: z7408020@email.ncku.edu.tw
[image:1.595.312.541.607.769.2]In addition, the substrates before FSP are designated as ‘‘BM and O’’, and the specimens which did not undergo FSP, but with different cold rolling reduction, are designated as ‘‘PD12’’, ‘‘PD25’’ and ‘‘PD50’’, respectively.
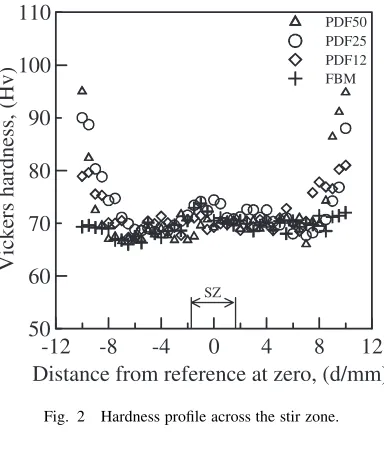
Using the Vickers indenter with 0.98 Nf load for 15 s, the microstructural imhomogeneity of all friction stirred speci-mens was observed. Their microhardness profiles along the cross section of the stirred specimens are in the manner described in Fig. 2, however slight differences can be recognized in the stir zone region. Nevertheless, it should be noted that even slight variations in microhardness can cause significant changes in fracture resistance. Consequent-ly, in the following tensile test, in order to eliminate the influence of advancing or retreating microstructure, speci-mens were cut entirely from the stir zone. The strain rate was fixed at8:3104s1, and the dimensions of the tensile test
specimens are shown in Fig. 3.
Figure 4 schematically depicts the vibration test with a specimen clamped on a vibration shaker under a specific resonant frequency given in Fig. 4(b). Figure 4(c) also schematically depicts the vibration set-up. V notches adja-cent to the clamp were made to confine the resonance to the stir zone. Deflection of the specimen at the other end opposite the vibration shaker was measured by a deflection sensor. In order to determine the resonance frequency which led to the largest deflection, the vibration frequency was scanned continuously as shown in Fig. 4(b).
testing.
3. Results
[image:2.595.73.265.73.310.2]3.1 Effect of prior deformation rate of substrate on friction stirred specimens
Figure 6 shows two typical metallography images of the friction stirred specimens. Both of them, as well as other friction stirred specimens, reveal a very similar micro-structure with fine equiaxed grains and microhardness (Fig. 2) in the stir zone resulting from the phenomenon of dynamic recrystallization. The hot rolled base metal (BM) before FSP, as shown in Fig. 6(a), and the cold rolled sample with a different prior deformation rate before FSP (PD25), as shown in Fig. 6(c), both exhibit a comparatively prolonged grain structure.
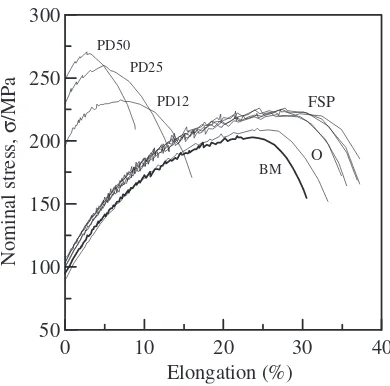
Figure 7 shows the stress-elongation curves. All the friction stirred specimens exhibit a similar serrated yielding behavior. A slight difference in serrated flow can be recognized. The onset strain and intensity of the serrated flow will be further examined in the discussion section. Though very little difference can be recognized to confirm the effect of the prior deformation rate on tensile properties among these five friction stirred specimens, nevertheless the difference in tensile properties between the BM and FSP samples can be easily proven by comparing the results shown in Fig. 7 and Table 1 which reveal that the grain refinement by FSP is very effective in enhancing elongation.
3.2 Effect of prior deformation rate of base metal on vibration fracture resistance of friction stirred specimens
Since fatigue properties are strongly dependent on micro-structure, even an insignificant microstructure evolution in the friction stirred zone can be elucidated by examining the crack propagation behavior. Consequently a vibration test was conducted to explore the effect of prior deformation on friction stirred materials pertaining to the dynamic recrystal-lized grain.
Figure 8 shows the locus of deflection amplitude vs. vibration cycles (D-N curve). As illustrated in Figs. 8(a) and 8(b), G¼1:1 and the D¼6:5mm represent acceleration (1.1 G) and initial deflection (6.5 mm) respectively. All specimens exhibit the common feature that the deflection amplitude is increasing for a critical duration in the initial
-12
-8
-4
0
4
8
12
Distance from reference at zero, (d/mm)
Fig. 2 Hardness profile across the stir zone.
15
Unit: mm
[image:2.595.68.265.310.424.2]stage and subsequently decreasing in the later stage. Thus the D-N curve can be generalized into two stages. Stage I: the deflection amplitude increases as vibration cycles increase until a maximum is reached. Stage II: the deflection decreases from a peak point as the vibration cycles increase further.
Figure 8(b) shows that the duration of Stage I in the PDF12, PDF25 and PDF50 specimens was shorter as a result of prior strain hardening. However, for the specimens without 1: vibration controller 5: specimen
2: acceleration sensor 6: deflection sensor 3: vibration shaker 7: recorder 4: specimen clamp
(b)
Frenquency, ƒ/Hz resonant frequency (a)
(c)
Deflection, d/mm
Fig. 4 Shape and dimension of the resonant vibration test specimen for (a) vibration geometry and dimension, (b) resonant frequency, (c) the resonant vibration setup.
main crack length = Lm branch crack
projected crack length along notch direction = Lp crack path tortuosity = Lm / Lp
Fig. 5 Schematic drawing of the cracking features generated by resonant.
50
µ
m
(d)
(b)
50
µ
m
(a)
100
µ
m
100
µ
m
(c)
[image:3.595.129.462.74.328.2] [image:3.595.49.289.386.443.2] [image:3.595.112.485.480.773.2]the prior deformed specimens recorded under an identical acceleration (G¼1:1). A slight difference can be recognized after the prior deformed specimens underwent FSP as shown
Elongation (%)
[image:4.595.72.267.72.265.2]Fig. 7 Relation between stress and elongation.
Table 1 Effect of prior deformation on crack path tortuosity.
Specimen F-O FBM PDF12 PDF25 PDF50 O BM PD12 PD25 PD50
U.T.S. (MPa) 225 226 224 222 224 207 206 230 257 274
Y. S. (MPa) 106 111 111 110 110 100 106 205 237 258
T. E. (%) 35.7 33.7 31.0 31.7 32.3 30 28.4 15.8 13.7 10.7
tortuosity 1.16 1.15 1.14 1.14 1.15 — 1.26 1.23 1.17 1.10
0 10 20 30
Number of vibration cycle (x1000) 4
5 6 7 8 9 10
Deflection amplitude, d/mm
PDF50 PDF25 PDF12 FBM
F-O
(a)
0 10 20 30
Number of vibration cycles (x1000) 4
5 6 7 8 9 10
Deflection amplitude, d/mm
PDF50 PDF25 PDF12 FBM F-O
(b)
0 10 20 30
Number of vibration cycle (x1000) 4
5 6 7 8 9 10
Deflection amplitude, d/mm
PD50
PD25
PD12
BM
(c)
0 10 20 30
Number of vibration cycle (x1000) 4
5 6 7 8 9 10
Deflection amplitude, d/mm
PD50 PD25 PD12 BM
(d)
[image:4.595.45.547.324.391.2] [image:4.595.130.469.427.767.2]in Fig. 8(a). On the other hand, Figure 8(c) indicates that the BM specimens had the lowest initial deflection amplitude, while the PD50 specimen had the highest. This data can be further compared with the specimens with different prior deformation rates, as shown in Table 1. In this study, to avoid the effects of the damping capacity of the materials, the vibration force (increase or decrease) of the specimens was controlled to acquire an identical initial deflection amplitude. This allowed us to measure the duration of the D-N curves under constant vibration strain conditions (i.e. identical initial deflection conditions). As a result, for all specimens tested under an identical deflection of 6.5 mm, a significant difference can be recognized in the duration of Stage I of the D-N curves (Fig. 8). Figure 8(b) shows a slight difference in the duration of the FSP specimens. It should be noted that the FSP specimen prepared by fully annealed base metal clearly possesses a longer duration.
Our previous study8)confirmed that Al-2.5Mg specimens
experienced a deviation of the actual vibration frequency from the resonant frequency when the deflection amplitude was decreased from the maximum value that resulted from the effect of reducing the cross-section area of the test specimen. Therefore, the vibration life in this study can be suitably defined as the number of vibration cycles when the deflection amplitude reached the maximum value (i.e. the above-mentioned duration of Stage I). For the friction stirred specimens under an identical initial deflection of 6.5 mm, a slight difference can be recognized in their crack propagation
rate as shown in Fig. 9(a). From the above results, the F-O and FBM specimens exhibited greater vibration fracture resistance than the other PDF samples. On the other hand, the effect of strain hardening also played an important role in the crack propagation rate when the as rolled specimens were tested under a constant initial deflection amplitude as shown in Fig. 9(b).
Furthermore, the vibration fracture features can also be examined by observing the fracture surface. Figure 10 shows the stirred specimens all with a faceted fracture pattern. Figures 10(a) and 10(b) reveal differences in the FBM and BM specimens. Severed slip bands can be observed in the BM specimen, which resulted from the larger grain size. For the PD50 specimen, slip bands also gave rise to smooth crystal planes typical of the FBM specimens as shown in Fig. 10(a). However, little difference can be recognized between FBM and PDF50.
As for the vibration fracture resistance, the crack prop-agation behavior will be influenced by microstructural variations. Figure 11 reveals that there are significant dif-ferences in the crack propagation behavior between the specimens which were given FSP and those which were not. Furthermore, from observation of the main cracks on the etching specimens of the stirred and unstirred samples, few differences were recognized, as illustrated in Fig. 12. The results can be further compared with the critical number of vibration cycles as shown in Fig. 8(b). Except for the F-O and FBM specimens, the other friction stirred specimens
0 4 8 12 16 20
Vibration Cycles (x1000) 0
2 4 6 8
Projected crack length, L/mm
PDF50 PDF25 PDF12 FBM F-O (a)
0 10 20 30 40 50 60 Vibration cycles (x1000) 0
2 4 6 8
Projected crack length, L/mm
PD50 PD25 PD12 BM
(b)
Fig. 9 Crack propagation rate under constant initial deflection conditions (a) FSP specimens, (b) rolled specimens without FSP.
(a)
5µm 5µm
[image:5.595.129.467.75.246.2](b)
[image:5.595.129.469.289.413.2]exhibited similar vibration fracture resistance under a constant initial deflection of 6.5 mm. The reason why the F-O and FBM specimens possessed better vibration fracture resistance will be discussed later.
4. Discussion
Many previous studies16–18) concluded that the serrated
yielding is a result of dynamic strain ageing—the dynamic interaction between mobile dislocations and solute atoms. However, strain rate, temperature, grain size and stored strain energy also contribute to the formation of serrated yielding. In this study, the temperature and strain rate were identical, and consequently other parameters such as grain size or stored strain energy might have played a major role in the plastic deformation behavior. According to previous stud-ies,19,20)a material with a rolled structure possesses serration anisotropy, whereas a fully recrystallized material does not. This implies that the application of various rolling reductions may result in variations in the serration magnitude (). In addition, the smaller the grains, the greater the number of grain boundaries along the line of the mobile dislocations and therefore the greater the number of dislocation tangles that are strong enough to hold the mobile dislocations long enough to let Mg atoms form atmospheres around them.20)
This effect causes smaller grain specimens to possess larger stress drops. Figure 7 shows the serrated yielding behavior for all specimens. However, all the FSP specimens possess a similar serrated yielding, even the specimens with severe prior deformation before FSP (PDF50). This can be ascribed to the grain refinement and the resulting increase of the boundaries which is the main source of obstacles. Comparing the BM (base metal) and FSP specimens, though little
difference can be recognized in the tensile deformation resistance, it is reasonable to suggest that the dynamic recrystallized fine grains and higher dislocation density (Fig. 13) played an important role in the average serration magnitude and the onset strain of serrations.21)
Meanwhile, the resonant vibration characteristics of the specimens can be identified from their D-N curves (deflection amplitude vs. number of vibration cycles) which can be generalized into two stages as indicated in Fig. 8. An increase in work hardening raises the effective elastic modulus in the stage I region, and the deflection amplitude then increases due to the decrease in damping capacity.22,23) This work
hardening stage is designated as stage I, and the vibration fracture resistance can be considered as being strongly dependent on the duration of stage I. For vibration cycles beyond this stage I region, there is a drastic decrease in deflection amplitude which can be designated as stage II, which results from the inward propagation of major cracks and the deviation of the actual vibration frequency from the resonant frequency.23)
It is reasonable to suggest that the severe dislocation tangles introduced by cold rolling reduction strengthened the matrix resulting in a greater vibration fracture resistance. Our results confirm that a strengthened matrix resulting from prior deformation is more effective in improving vibration fracture resistance than a recrystallized matrix resulting from FSP.
When the vibration push force of the FSP specimens was controlled to obtain an identical initial deflection amplitude as shown in Fig. 8(b), the differences in the D-N curves were insignificant, nevertheless we can still see the effect of prior deformation on the D-N curves of the friction stirred specimens. A TEM micrography image, shown in Fig. 13,
20
µ
m
20
µ
m
[image:6.595.113.483.71.349.2]slip band
can explain the abovementioned effect. However the F-O specimen possessed the longest duration. Based on exper-imental data as shown in Fig. 8(b), a larger prior deformation rate before FSP tends to decrease the duration of stage I. This implies that the microstructural feature of the dynamic recrystallized grain was affected by prior deformation.24)
Figures 13(b), 13(c) and 13(d) show that the sub-grain size of the FSP specimens increased and the dislocation density slightly lowered as the prior deformation rate increased. It is reasonable to suggest that the friction stirred samples experienced a few thermal cycles after friction stir processing which resulted in the dislocation density decrease and sub-grain growth. The prior deformation of the FSP specimens played an important role in the shortening of duration and hence an increase in maximum deflection amplitude, which
can be attributed to an increase in stored strain energy. Observation of the crack propagation behavior revealed no slip band cracking in the vicinity of the main crack in the crack propagation path in any of the friction stirred speci-mens. In addition, after FSP was performed the micro-structural features of all the FSP specimens were very similar (a random distributed orientation)25) in spite of significant
differences in the prior deformation rate. This is why the crack tortuosity values of the FSP specimens were slightly different.
5. Conclusions
According to the experimental results discussed in the previous sections, the following conclusions can be drawn:
(a)
50
µ
m
(b)
[image:7.595.112.480.72.206.2]50
µ
m
Fig. 12 Optical microstructure of (a) FBM, (b) BM. The arrows indicate the macroscopic crack propagation direction.
1µm
(a)
(b)
2µm
(d)
2µm
(c)
2µm
[image:7.595.142.455.245.563.2]tion rate. The vibration fracture resistance of the FSP specimens with different prior deformation rates and prior annealing heat treatment can be quantitatively correlated with the crack tortuosity value which corresponds to the crack propagation behavior. How-ever, vibration fracture resistance was improved when the substrate was given a fully annealed prior heat treatment before FSP.
Acknowledgement
Financial support from the National Science Council of Taiwan is gratefully acknowledged (contract No. NSC 95-2221-E-006-118).
REFERENCES
1) I. Charit and R. S. Mishra: J. Mater. Res.19(2004) 3329–3342. 2) N. Saito, I. Shigematsu, T. Komaya, T. Tamaki, G. Yamauchi and
M. Nakamura: J. Mater. Sci. Lett.20(2001) 1913–1915.
12) K. T. Huang, T. S. Lui and L. H. Chen: Mater. Trans., JIM46(2005) 2268–2275.
13) H. Masumoto, M. Hinai and S. Sawaya: J. Japan Inst. Metals24(1983) 681–688.
14) A. Turnbull and E. R. De Los Rios: Fatigue Fract. Engng. Mater. Struct. 18(1995) 1355–1366.
15) G. W. J. Waldron: Acta Metall.13(1965) 897–906. 16) E. Pink: Acta Metall.37(1989) 1773.
17) B. H. Tian: Mater. Sci. Eng., A347(1998) 264.
18) M. C. Chen, L. H. Chen and T. S. Lui: Metall. Mater. Trans.27A(1996) 1691–1694.
19) J. M. Reed and M. E. Walter: Mater. Sci. Eng., A359(2003) 1–10. 20) X.-M. Cheng and J. G. Morris: Scripta Mater.43(2000) 651–658. 21) W. Wen and J. G. Morris: Mater. Sci. Eng., A354(2003) 279–285. 22) S. M. McGuire, M. E. Fine and J. D. Achenbach: J. Mater. Res.8
(1993) 2216–2223.
23) D. S. Jiang, T. S. Lui and L. H. Chen: Mater. Trans., JIM41(2000) 499–506.
24) F. J. Humphreys and M. Hatherly:RECRYSTALLIZATION and Related Annealing Phenomena, (Oxford, UK, Pergamon, Tarrytown, N. Y., U.S.A., 1996).