Enhancement of Impact Mass Estimation Algorithm for a Plate Type Structure
Doo-Byung Yoon
1, Jin-Ho Park
1, Young-Chul Choi
1, Hyu-Sang Kwon
2and Joon-Hyun Lee
3 1Korea Atomic Energy Research Institute, 150 Deokjin-dong Yuseong-gu, Daejeon-shi, 305-353, Korea2Korea Research Institute of Standards and Science, 1 Doryong-dong Yuseong-gu, Daejeon-shi, 305-340, Korea 3
Pusan National University, Jangjeon-dong Geumjeong-gu, Busan-shi, 609-735, Korea
A new method to more accurately estimate the impact mass when an elastic ball is impacting on a surface of an elastic plate is suggested. Conventionally, frequency ratio (FR) and center frequency techniques have been widely used for a mass estimation. However, these methods do not work when the mounting effect of a sensor is dominant and/or the operating background noise becomes high. Thus a new technique to eliminate these effects by using a time-frequency analysis is attempted and verified through an experiment. It is revealed that the proposed method is valid for estimating the center frequency of an impact response signal easily even in a noisy environment, thus making a mass estimation of an impact source on a plate type structure more successful than the conventional techniques.
[doi:10.2320/matertrans.I-MRA2007854]
(Received September 4, 2006; Accepted March 13, 2007; Published May 25, 2007)
Keywords: plate, impact source, mass estimation, frequency ratio, center frequency, time-frequency analysis, smoothed Wigner-Ville distribution
1. Introduction
The impact source localization and mass estimation techniques for an elastic dispersive medium such as plate and shell structures by using accelerometers have been two crucial issues for the detection and diagnosis of loose parts in
nuclear power plants.1–4) Presently, many a new source
localization method has been developed and successfully
applied in the industry.5–7) However, the mass estimation
problem has not been as successful as the localization one. This is because a one dimensional spectral analysis has been used to analyze the resultant impact signals. In other words, the conventional Fourier analysis provides the dynamic characteristics of a linear time invariant system by the definition that it has a whole waveform function as a basis. This means that a small amount of a local frequency perturbation at a particular time could not be identified in this analysis. Therefore this makes it very difficult to define the center frequency of the impact response signals, resulting in a poor estimation for the impact mass.
Recently, the two dimensional time-frequency analysis techniques have been addressed to estimate the transient behaviors of an impact response signal in a dispersive medium in which the higher frequency components in the
signal propagate faster than the lower frequency ones.5–7)
Thus the time-frequency analysis is expected to provide clear information on the center frequency embedded in a non-stationary impact response signal. In this paper, a new idea by using a smoothed Wigner-Ville distribution which is one of the popular time-frequency analysis techniques is suggested for a more reliable mass estimation of an impact source for a plate type structure. An experiment is also being conducted to verify the usefulness of the proposed technique.
2. Theory
2.1 Mass estimation method
Two typical methods have been widely used to estimate the impact mass of an elastic metal ball when impacted on an elastic metal plate. One is a center frequency method and the
other is a FR (Frequency Ratio) method.
The center frequency fc for a measured signal sðtÞ is
defined as3)
fc¼
X
i Rfifci
X
i
Rfi ð1Þ
where, i is the number of frequency intervals, f is a
frequency,fciis a center frequency at theith interval, andRfi
is a ratio ofSðfÞtoSnðfÞat theith frequency interval.SðfÞis an auto-power spectral density of a measured impact response signal sðtÞ, and SnðfÞ is an auto-power spectral density of a background noise.
Based on the center frequency of the measured impact response signal from eq. (1), the impact mass can be estimated by the Hertz’s impact theory6)as follows:
Td¼khm0:4V00:2R
0:2 ð2Þ
where,Td ¼1:6=ð2 fcÞ,khis a material constant which is a
function of the Young’s modulus and the Poisson’s ratio of the plate and impacting object,6)mis a mass of the impacting
object,V0is the velocity of the impacting object, andRis the
radius of the curvature at the contact point of the impacting object.
Next, the FR (Frequency Ratio) for a measured signalsðtÞ
is defined as4)
FR¼
Z fs;max
fs;min
SðfÞd f
Z fr;max
fr;min
SðfÞd f
ð3Þ
where f is a frequency, andSðfÞ is an auto-power spectral density of a measured signalsðtÞ. Thefr;minand fr;maxdenote
the minimum and maximum frequency of the higher frequency band, respectively. The fs;min and fs;max denote
the minimum and maximum frequency of the lower frequency band, respectively.
Then the FR becomes a function of the impact mass because the signal power in the lower frequency range is dependent on the impact duration which is also subjected to
Special Issue on Advances in Non-Destructive Inspection and Materials Evaluation
the impact mass. Accordingly, the impact mass can be obtained by using the ‘FR versus mass’ diagram previously obtained by an experiment.4)
It is noteworthy that both the center frequency and FR methods assess the impact mass by utilizing the frequency spectra of the impact response signal. Thus these techniques are only reliable when the multi path effect of the propagating response signal is negligible and the signal has a high signal-to-noise ratio (SNR). Actually, the measured response signals obtained from operating structures contain a background noise, a resonance component of a sensor mounting and reflected waves, etc. Therefore, in a noisy environment, the conventional methods using one dimensional power spectra may fail to estimate the impact mass. To overcome this, we propose a new technique for an impact mass estimation by using smoothed Wigner-Ville distributions with an asym-metric exponential kernel. The next section describes the details of the proposed method.
2.2 Proposed technique
Wigner-Ville Distribution (WVD) Wðt;fÞ and its ambi-guity functionAð; Þare defined as7–9)
Wðt;fÞ ¼
Z1
1
z tþ
2
z t
2
ej2fd ð4Þ
and
Að; Þ ¼
Z1
1
Z1
1
Wðt;fÞejð2t2fÞdtd f; ð5Þ
respectively. Where, zðtÞ is the analytic function of a
measured signalsðtÞ,is a time delay, jmeanspffiffiffiffiffiffiffi1 and
denotes a complex conjugate. By applying a two dimensional smoothing functionð; Þto the ambiguity functionAð; Þ,
the general form of a smoothed WVD can be obtained as7)
WSMðt;fÞ ¼
Z1 1 Z1 1 Z1 1
ð; Þz uþ
2
z u
2
ej2ðtþfuÞddud: ð6Þ
If we let a smoothing functionð; Þ ¼e22=
, then the corresponding smoothed WVD is represented as7)
WSMðt;fÞ ¼
Z1
1
Z1
1
z uþ
2
z u
2 ffiffiffiffiffiffiffi 2 r exp
2ðtuÞ2
2
ej2fdud: ð7Þ
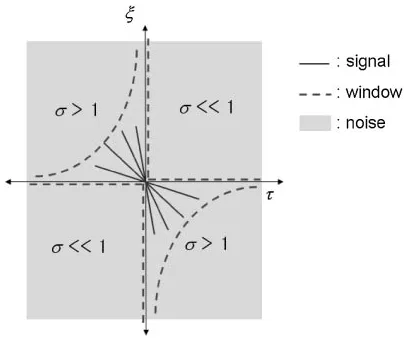
[image:2.595.308.549.113.198.2]where,is a weighting factor in the ambiguity domainð; Þ; a small value means an increase of the smoothing effect and a large value means a decrease of the smoothing effect. It has already been reported that the WVD of an impact response signal (the lowest mode of flexural wave) on an elastic plate shows a monotonic curve whose power is always located within the 2nd and 4th quadrants in the ambiguity domain, however, the random noise terms are scattered in every quadrant. Based on this property, we can weight the value of the weighting factor in each quadrant differently to exclude the noise power in the 1st and 3rd quadrants.
Figure 1 illustrates an asymmetric exponential window in the ambiguity domain for reducing the noise effect and the
cross terms, simultaneously.7) Then, the smoothed WVD
with an asymmetric exponential window can be used not only for reducing the noise effect in the signal, but also for estimating the center frequency of the direct path wave group of the impact response signals. Eventually, this makes it possible to enhance the mass estimation capability.
3. Experiment and Discussion
An experiment has been performed to investigate the validity of the proposed time-frequency analysis technique for estimating an impact mass on a plate. Figure 2 represents the experimental setup and schematic of the data acquisition and signal analysis of the impact response signals for an elastic square plate (2m2m, 10t). The plate is made of SUS304 stainless steel and it is vertically hinged. Four sensors were used for measuring the acceleration signals generated by the impact of a steel balls (17.6, 36.8, 67.6, and 131.6 gram). The impact is generated by dropping the steel
[image:2.595.47.546.295.397.2]ball onto the plates’ surface as shown in Fig. 2. Table 1 summarizes the basic conditions for experiment and signal processing.
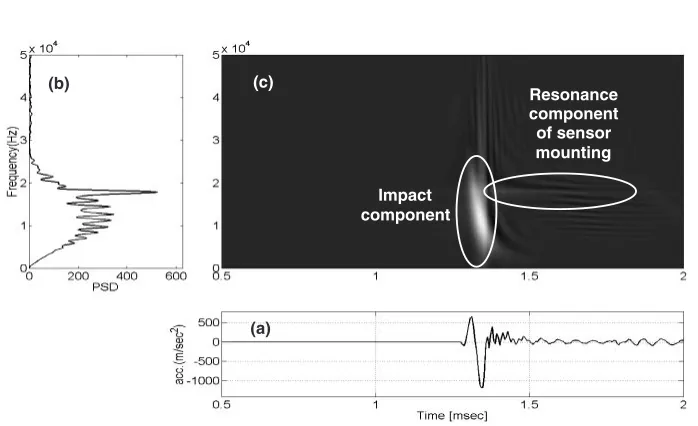
Figure 3 shows a smoothed WVD of the fourth sensor (S4) signal for an impact with a 17.6 gram steel ball. Figure 3(a) and (b) represent the time response and auto power spectral density of the measured acceleration, respectively. In Fig. 3(b), one could make a mistake by considering 18 kHz as the center frequency of the impact response. However, by observing the time-frequency analysis shown in Fig. 3(c), one can easily determine that the center frequency is 12.9 kHz, where the peak at 18 kHz is a mounting resonance component of the accelerometer.
[image:2.595.325.527.577.748.2]A simulation is performed to verify the applicability of the proposed method in a noisy environment. For this purpose, a
zero mean Gaussian random noise with2¼1is artificially
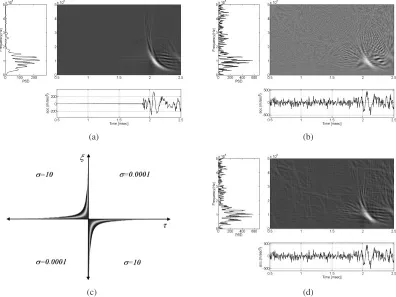
mixed with the acceleration signal measured at the third sensor (S3). Figure 4(a) represents a WVD of the measured acceleration signal due to an impact with a 36.8 gram steel ball. In Fig. 4(a), one can see that dispersive flexural wave component is represented as a curved line with a negative slope in the time-frequency domain. In addition, one can
easily identify the center frequency in the time-frequency domain. Figure 4(b) shows a WVD of the signal containing a Gaussian random noise with a SNR equal to 0.5. The SNR is a variance ratio of a measured signal to Gaussian noise. In Fig. 4(b), it is not easy to find out the impact response component and the center frequency due to the noise. An asymmetrically weighted exponential function used for reducing the noise effect is depicted in Fig. 4(c). As a result, the noise rejection capability of the proposed method
(a) (b)
[image:3.595.116.484.74.241.2]Fig. 2 Experimental setup for impact mass estimation. (a) View of the experimental setup, (b) Schematic of the experimental setup, where the locations of two impact point (p1 and p2) and four accelerometers (S1, S2, S3 and S4) are indicated.
Table 1 Basic condition for experiment and signal processing.
Mass and diameter of the ball 17.6 gram (15.9 mm), 36.8 gram (20.7 mm), 67.6 gram (25.4 mm), 131.6 gram (31.8 mm)
Impact velocity of the ball 0.76 m/s
Support condition of the plate Vertically hinged, (2m2m, 10 mm)
Sampling rate for data acquisition 197 kHz
Data length for WVD analysis 512 or 1024
Variance of Gaussian random noise 1
Resonance component
of sensor mounting
Impact component (c)
(b)
(a)
[image:3.595.53.535.296.623.2] [image:3.595.49.547.304.398.2] [image:3.595.124.473.406.619.2](smoothed WVD) is demonstrated in Figure (d). By compar-ing Fig. 4(d) to Fig. 4(b), one can see that the noise term has been remarkably reduced and therefore it is possible to identify an impact response component in the time-frequency domain.
Table 2 summarizes the comparison results of the mass estimation between the conventional center frequency meth-od and the proposed methmeth-od. In addition, Table 3 compares the FR values and mass estimation results obtained by the conventional FR method and the proposed technique.
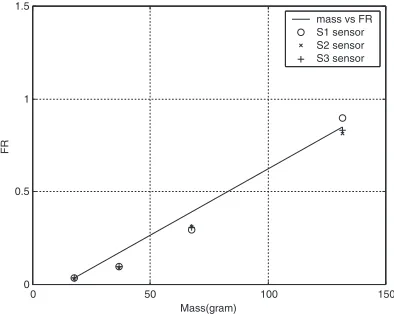
Figure 5 shows the ‘relation between the FR value and the impact mass’ that used for estimating the impact mass. To obtain the plot of ‘impact mass vs. FR value’, auto-power spectral density of the measured acceleration signals (S1, S2, and S3 sensor) due to impact of steel balls (16.7, 36.8, 67.6, and 131.6 gram) are used. In Table 2 and Table 3, it is observed that the errors of mass estimation increase as the SNR decreases. In addition, one can observe that overall estimation error of the smoothed WVD technique is relatively smaller than that of the conventional method. It
(a) (b)
(c) (d)
[image:4.595.100.496.74.371.2]Fig. 4 Time-frequency analysis results that demonstrate the noise rejection capability. (a) Wigner-Ville distribution of the measured impact signal which does not contain noise, (b) Wigner-Ville distribution of the impact signal which contains Gaussian random noise with a SNR equal to 0.5, (c) Smoothing function applied in ambiguity domain for reducing noise (d) Smoothed Wigner-Ville distribution obtained by applying the smoothing function to the noisy signal shown in Fig. 4(b).
Table 2 Result of mass estimation by using center frequency method (S1 sensor).
Estimated center frequency (kHz) Estimated mass (gram)
True Diameter Conventional method Proposed method Conventional method Proposed method
mass (mm)
Without With noise Without With noise Without With noise Without With noise (gram)
noise SNR¼2 noise SNR¼2 noise SNR¼2 noise SNR¼2
(error) (error) (error) (error)
17.6 15.9 12.4 12.2 12.9 12.8 18.0 18.9 16.0 16.4
(2%) (7%) (11%) (7%)
36.8 20.7 10.2 10.5 10.4 10.5 32.3 29.6 30.5 29.6
(12%) (20%) (17%) (20%)
67.6 25.4 8.3 9.1 8.1 7.8 59.9 45.5 64.5 72.3
(11%) (33%) (5%) (7%)
131.6 31.8 7.2 8.3 6.7 6.8 91.9 60.0 114.0 109.1
(30%) (54%) (13%) (17%)
[image:4.595.46.551.456.627.2]has been found that the smoothed WVD technique provides a useful means for an impact mass estimation, even in a noisy environment throughout Fig. 4(d), Table 2 and Table 3. Therefore, it is expected that the reliability of an impact mass estimation could be enhanced when the proposed time-frequency analysis technique is applied to an impact mass estimation problem for a plate type structure.
4. Conclusions
The objective of this work is to enhance the impact mass estimation capability of a loose parts monitoring in a noisy environment. For this purpose, a two dimensional time-frequency analysis technique by using a smoothed
Wigner-Ville distribution was proposed. Also, experiments were carried out to verify the validity of the proposed method. The results showed that even in a noisy environment, the smoothed Wigner-Ville distribution can provide a more reliable means for estimating an impact mass of a steel ball for a plate type structure. It is expected that the proposed method can be used to enhance the accuracy of an impact mass estimation for a loose parts monitoring.
Acknowledgement
This study has been supported by Korean Ministry of Commerce, Industry and Energy.
REFERENCES
1) R. C. Kryter and F. Shahrokhi: Summary of Studies on Methods for Detecting Locating, and Characterizing Metallic Loose Parts in Nuclear Reactor Coolant System (U.S. Nuclear Regulatory Commission Report NUREG/CR-2344, 1981).
2) B. J. Olma: Progress in Nuclear Energy.15(1985) 583–593. 3) I. K. Rhee, et al.: Development of Loose Parts Signal Location
Estimating Technique in High Pressurized Structure (Research Report KAERI/CM-102/94, 1994).
4) T. Tsunoda and T. Kato,et al.: Progress in Nuclear Energy.15(1985) 569–576.
5) L. Gaul and S. Hurlebaus: Mechanical Systems and Signal Processing.
12(1997) 783–795.
6) C. W. Mayo: Progress in Nuclear Energy.34(1999) 263–282. 7) Jin-Ho Park and Yang-Hann Kim: Measurement Science and
Technol-ogy.17(2006) 2757–2766.
8) F. Hlawatsch and G. F. Boudreaux-Bartels: IEEE SP Magazine 21
(1992) 21–67.
[image:5.595.45.551.92.253.2]9) L. Cohen: Time-Frequency Distribution, (Prentice Hall PTR, Engle-wood Cliffs, New Jersey, 1995).
Table 3 Mass estimation results of the impact signal (S3 sensor) which contains Gaussian random noise by using Frequency Ratio method.
True
Estimated FR Estimated mass (gram)
mass Diameter Conventional method Proposed method Conventional method Proposed method (gram) (mm)
SNR¼5 SNR¼2 SNR¼5 SNR¼2 SNR¼5 SNR¼2 SNR¼5 SNR¼2
(error) (error) (error) (error)
17.6 15.9 0.0277 0.0254 0.0285 0.0266 16.8 16.5 16.9 16.7
(5%) (6%) (4%) (5%)
36.8 20.7 0.0811 0.0746 0.0875 0.0753 24.4 23.4 25.3 23.5
(34%) (36%) (31%) (36%)
67.6 25.4 0.2765 0.2169 0.3114 0.2618 51.9 43.4 56.8 49.8
(23%) (36%) (16%) (26%)
131.6 31.8 0.6473 0.4806 0.7504 0.6578 104.1 80.6 118.6 105.6
(21%) (39%) (10%) (20%)
fr;min¼10kHz,fr;max¼30kHz,fs;min¼2kHz,fs;max¼6kHz,
Error =jEstimated massTrue massj/True mass
0 50 100 150
0 0.5 1 1.5
Mass(gram)
FR
mass vs FR S1 sensor S2 sensor S3 sensor
[image:5.595.70.267.300.457.2]