Automated Pyramid Scoring of Summaries using Distributional Semantics
Rebecca J. Passonneau∗ and Emily Chen† and Weiwei Guo† and Dolores Perin‡ ∗Center for Computational Learning Systems, Columbia University
†Department of Computer Science, Columbia University ‡Teachers College, Columbia University
(becky@ccls.|ec2805@|weiwei@cs.)columbia.edu, perin@tc.edu
Abstract
The pyramid method for content evaluation of auto-mated summarizers produces scores that are shown to correlate well with manual scores used in edu-cational assessment of students’ summaries. This motivates the development of a more accurate auto-mated method to compute pyramid scores. Of three methods tested here, the one that performs best re-lies on latent semantics.
1 Introduction
The pyramid method is an annotation and scor-ing procedure to assess semantic content of sum-maries in which the content units emerge from the annotation. Each content unit is weighted by its frequency in human reference summaries. It has been shown to produce reliable rank-ings of automated summarization systems, based on performance across multiple summarization tasks (Nenkova and Passonneau, 2004; Passon-neau, 2010). It has also been applied to assessment of oral narrative skills of children (Passonneau et al., 2007). Here we show its potential for assess-ment of the reading comprehension of community college students. We then present a method to au-tomate pyramid scores based on latent semantics.
The pyramid method depends on two phases of manual annotation, one to identify weighted con-tent units in model summaries written by profi-cient humans, and one to score target summaries against the models. The first annotation phase yields Summary Content Units (SCUs), sets of text fragments that express the same basic content. Each SCU is weighted by the number of model summaries it occurs in.
Figure 1 illustrates a Summary Content Unit taken from pyramid annotation of five model sum-maries of an elementary physics text. The ele-ments of an SCU are its index; a label, created by the annotator; contributors (Ctr.), or text fragments from the model summaries; and the weight (Wt.), corresponding to the number of contributors from distinct model summaries. Four of the five model
Index 105
Label Matter is what makes up all objects or substances Ctr. 1 Matter is what makes up all objects or substances Ctr. 2 matter as the stuff that all objects and substances
in the universe are made of
Ctr. 3 Matter is identified as being present everywhere and in all substances
Ctr. 4 Matter is all the objects and substances around us
Wt. 4
Figure 1:A Summary Content Unit (SCU)
summaries contribute to SCU 105 shown here. The four contributors have lexical items in com-mon (matter, objects, substances), and many dif-ferences (makes up, being present). SCU weights, which range from 1 to the number of model sum-mariesM, induce a partition on the set of SCUs
in all summaries into subsetsTw, w ∈ 1, . . . , M.
The resulting partition is referred to as a pyramid because, starting with the subset for SCUs with weight 1, each next subset has fewer SCUs.
To score new target summaries, they are first annotated to identify which SCUs they express. Application of the pyramid method to assessment of student reading comprehension is impractical without an automated method to annotate target summaries. Previous work on automated pyramid scores of automated summarizers performs well at ranking systems on many document sets, but is not precise enough to score human summaries of a single text. We test three automated pyramid scoring procedures, and find that one based on dis-tributional semantics correlates best with manual pyramid scores, and has higher precision and re-call for content units in students’ summaries than methods that depend on string matching.
2 Related Work
The most prominent NLP technique applied to reading comprehension is LSA (Landauer and Du-mais, 1997), an early approach to latent semantic analysis claimed to correlate with reading compre-hension (Foltz et al., 2000). More recently, LSA
has been incorporated with a suite of NLP metrics to assess students’ strategies for reading compre-hension using think-aloud protocols (Boonthum-Denecke et al., 2011). The resulting tool, and sim-ilar assesment tools such as Coh-Metrix, assess aspects of readability of texts, such as coherence, but do not assess students’ comprehension through their writing (Graesser et al., 2004; Graesser et al., 2011). E-rater is an automated essay scorer for standardized tests such as GMAT that also relies on a suite of NLP techniques (Burstein et al., 1998; Burstein, 2003). The pyramid method (Nenkova and Passonneau, 2004), was inspired in part by work in reading comprehension that scores con-tent using human annotation (Beck et al., 1991).
An alternate line of research attempts to repli-cate human reading comprehension. An auto-mated tool to read and answer questions relies on abductive reasoning over logical forms extracted from text (Wellner et al., 2006). One of the perfor-mance issues is resolving meanings of words: re-moval of WordNet features degraded performance. The most widely used automated content evalu-ation is ROUGE (Lin, 2004; Lin and Hovy, 2003). It relies on model summaries, and depends on ngram overlap measures of different types. Be-cause of its dependence on strings, it performs bet-ter with larger sets of model summaries. In con-trast to ROUGE, pyramid scoring is robust with as few as four or five model summaries (Nenkova and Passonneau, 2004). A fully automated approach to evaluation for ranking systems that requires no model summaries incorporates latent semantic dis-tributional similarities across words (Louis and Nenkova, 2009). The authors note, however, it does not perform well on individual summaries.
3 Criteria for Automated Scoring
Pyramid scores of students’ summaries correlate well with a manual main ideas score developed for an intervention study with community college freshmen who attended remedial classes (Perin et al., In press). Twenty student summaries by stu-dents who attended the same college and took the same remedial course were selected from a larger set of 322 that summarized an elementary physics text. All were native speakers of English, and scored within 5 points of the mean reading score for the larger sample. For the intervention study, student summaries had been assigned a score to represent how many main ideas from the source text were covered (Perin et al., In press).
Inter-rater reliability of the main ideas score, as given by the Pearson correlation coefficient, was 0.92.
One of the co-authors created a model pyra-mid from summaries written by proficient Masters of Education students, annotated 20 target sum-maries against this pyramid, and scored the re-sult. The raw score of a target summary is the sum of its SCU weights. Pyramid scores have been normalized by the number of SCUs in the summary (analogous to precision), or the average number of SCUs in model summaries (analogous to recall). We normalized raw scores as the aver-age of the two previous normalizations (analogous to F-measure). The resulting scores have a high Pearson’s correlation of 0.85 with the main idea score (Perin et al., In press) that was manually as-signed to the students’ summaries.
To be pedagogically useful, an automated method to assign pyramid scores to students’ sum-maries should meet the following criteria: 1) reli-ably rank students’ summaries of a source text, 2) assign correct pyramid scores, and 3) identify the correct SCUs. A method could do well on crite-rion 1 but not 2, through scores that have uniform differences from corresponding manual pyramid scores. Also, since each weight partition will have more than one SCU, it is possible to produce the correct numeric score by matching incorrect SCUs that have the correct weights. Our method meets the first two criteria, and has superior performance on the third to other methods.
4 Approach: Dynamic Programming
Previous work observed that assignment of SCUs to a target summary can be cast as a dynamic programming problem (Harnly et al., 2005). The method presented there relied on unigram overlap to score the closeness of the match of each eli-gible substring in a summary against each SCU in the pyramid. It returned the set of matches that yielded the highest score for the summary. It produced good rankings across summarization tasks, but assigned scores much lower than those assigned by humans. Here we extend the DP ap-proach in two ways. We test two new semantic text similarities, a string comparison method and a distributional semantic method, and we present a general mechanism to set a threshold value for an arbitrary computation of text similarity.
take order into account, we use Ratcliff/Obershelp (R/O), which measures overlap of common sub-sequences (Ratcliff and Metzener, 1988). To take the underlying semantics into account, we use co-sine similarity of 100-dimensional latent vectors of the candidate substrings and of the textual com-ponents of the SCU (label and contributors). Be-cause the algorithm optimizes for the total sum of all SCUs, when there is no threshold similarity to count as a match, it favors matching shorter sub-strings to SCUs with higher weights. Therefore, we add a threshold to the algorithm, below which matches are not considered. Because each sim-ilarity metric has different properties and distri-butions, a single absolute value threshhold is not comparable across metrics. We present a method to set comparable thresholds across metrics.
4.1 Latent Vector Representations
To represent the semantics of SCUs and candidate substrings of target summaries, we applied the la-tent vector model of Guo and Diab (2012).1 Guo
and Diab find that it is very hard to learn a 100-dimension latent vector based only on the lim-ited observed words in a short text. Hence they include unobserved words that provide thousands more features for a short text. This produces more accurate results for short texts, which makes the method suitable for our problem. Weighted ma-trix factorization (WMF) assigns a small weight for missing words so that latent semantics depends largely on observed words.
A 100-dimension latent vector representation was learned for every span of contiguous words within sentence bounds in a target summary, for the 20 summaries. The training data was selected to be domain independent, so that our model could be used for summaries across domains. Thus we prepared a corpus that is balanced across topics and genres. It is drawn from from WordNet sense definitions, Wiktionary sense definitions, and the Brown corpus. It yields a co-occurrence matrix
M of unique words by sentences of size 46,619 ×393,666. Mij holds the TF-IDF value of word
wi in sentence sj. Similarly, the contributors
to and the label for an SCU were given a 100-dimensional latent vector representation. These representations were then used to compare candi-dates from a summary to SCUs in the pyramid.
1http://www.cs.columbia.edu/˜weiwei/ code.html#wtmf.
4.2 Three Comparison Methods
An SCU consists of at least two text strings: the SCU label and one contributor. As in Harnly et al. (2005), we use three similarity comparisons
scusim(X, SCU), where X is the target summary
string. When the comparison parameter is set to
min (max, or mean), the similarity of X to each SCU contributor and the label is computed in turn, and the minimum (max, ormean) is re-turned.
4.3 Similarity Thresholds
We define a threshold parameter for a target SCU to match a pyramid SCU based on the distributions of scores each similarity method gives to the target SCUs identified by the human annotator. Annota-tion of the target summaries yielded 204 SCUs. The similarity score being a continuous random variable, the empirical sample of 204 scores is very sparse. Hence, we use a Gaussian kernel den-sity estimator to provide a non-parametric estima-tion of the probability densities of scores assigned by each of the similarity methods to the manually identified SCUs. We then select five threshold val-ues corresponding to those for which the inverse cumulative density function (icdf) is equal to 0.05, 0.10, 0.15, 0.20 and 0.25. Each threshold rep-resents the probability that a manually identified SCU will be missed.
5 Experiment
The three similarity computations, three methods to compare against SCUs, and five icdf thresh-olds yield 45 variants, as shown in Figure 2. Each variant was evaluated by comparing the unnormal-ized automated variant, e.g., Lvc, max, 0.64 (its 0.15 icdf) to the human gold scores, using each of the evaluation metrics described in the next sub-section. To compute confidence intervals for the evaluation metrics for each variant, we use boot-strapping with 1000 samples (Efron and Tibshi-rani, 1986).
To assess the 45 variants, we compared their scores to the manual scores. We also compared the sets of SCUs retrieved. By our criterion 1), an automated score that correlates well with manual scores for summaries of a given text could be used
(3 Similarities)×(3 Comparisons)×(5 Thresholds) = 45 (Uni, R/O, Lvc)×(min, mean, max)×(0.05, . . . , 0.25)
Variant (with icdf) P (95% conf.), rank S (95% conf.), rank K (95% conf.), rank µ Diff. T test LVc, max, 0.64 (0.15) 0.93 (0.94, 0.92), 1 0.94 (0.93, 0.97), 1 0.88 (0.85, 0.91), 1 49.9 15.65 0.0011 R/O, mean, 0.23 (0.15) 0.92 (0.91, 0.93), 3 0.93 (0.91,0.95), 2 0.83 (0.80, 0.86), 3 49.8 15.60 0.0012 R/O, mean, 0.26 (0.20) 0.92 (0.90, 0.93), 4 0.92 (0.90, 0.94) 4 0.80 (0.78, 0.83), 5 47.7 13.45 0.0046 LVc, max, 0.59 (0.10) 0.91 (0.89, 0.92), 8 0.93 (0.91, 0.95) 3 0.83 (0.80, 0.87), 2 52.7 18.50 0.0002 LVc, min, 0.40 (0.20) 0.92 (0.90,0.93), 2 0.87 (0.84, 0.91) 11 0.74 (0.69, 0.79), 11 37.5 3.30 0.4572
Table 1: Five variants from the top twelve of all correlations, with confidence interval and rank (P=Pearson’s, S=Spearman, K=Kendall’s tau), mean summed SCU weight, difference of mean from mean gold score, T test p-value.
to indicate how well students rank against other students. We report several types of correlation tests. Pearsons tests the strength of a linear cor-relation between the two sets of scores; it will be high if the same order is produced, with the same distance between pairs of scores. The Spearman rank correlation is said to be preferable for ordi-nal comparisons, meaning where the unit interval is less relevant. Kendall’s tau, an alternative rank correlation, is less sensitive to outliers and more intuitive. It is the proportion of concordant pairs (pairs in the same order) less the proportion of dis-cordant pairs. Since correlations can be high when differences are uniform, we use Student’s T to test whether differences score means statistically sig-nificant. Criterion 2) is met if the correlations are high and the means are not significantly different.
6 Results
The correlation tests indicate that several variants achieve sufficiently high correlations to rank stu-dents’ summaries (criterion 2). On all correla-tion tests, the highest ranking automated method is LVc, max, 0.64; this similarity threshold corre-sponds to the 0.15 icdf. As shown in Table 1, the Pearson correlation is 0.93. Note, however, that it is not significantly higher than many of its com-petitors. LVc, min, 0.40 did not rank as highly for Speaman and Kendall’s tau correlations, but the Student’s T result in column 3 of Table 1 shows that this is the only variant in the table that yields absolute scores that are not significantly different from the human annotated scores. Thus this vari-ant best balances criteria 1 and 2.
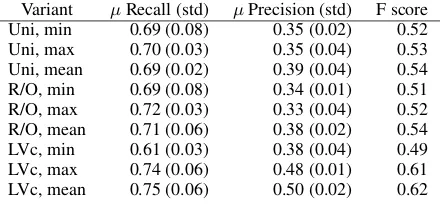
The differences in the unnormalized score com-puted by the automated systems from the score as-signed by human annotation are consistently posi-tive. Inspection of the SCUs retrieved by each au-tomated variant reveals that the auau-tomated systems lean toward the tendency to identify false posi-tives. This may result from the DP implementation decision to maximize the score. To get a measure of the degree of overlap between the SCUs that were selected automatically versus manually
(cri-terion 4), we computed recall and precision for the various methods. Table 2 shows the mean recall and precision (with standard deviations) across all five thresholds for each combination of similarity method and method of comparison to the SCU. The low standard deviations show that the recall and precision are relatively similar across thresh-olds for each variant. The LVc methods outper-form R/O and unigram overlap methods, particu-larly for the precision of SCUs retrieved, indicat-ing the use of distributional semantics is a supe-rior approach for pyramid summary scoring than methods based on string matching.
The unigram overlap and R/O methods show the least variation across comparison methods (min, mean, max). LVc methods outperform them, on precision (Table 2). Meeting all three criteria is difficult, and the LVc method is clearly superior.
7 Conclusion
We extended a dynamic programming frame-work (Harnly et al., 2005) to automate pyramid scores more accurately. Improvements resulted from principled thresholds for similarity, and from a vector representation (LVc) to capture the latent semantics of short spans of text (Guo and Diab, 2012). The LVc methods perform best at all three criteria for a pedagogically useful automatic met-ric. Future work will address how to improve pre-cision and recall of the gold SCUs.
Acknowledgements
We thank the reviewers for very valuable insights.
Variant µRecall (std) µPrecision (std) F score Uni, min 0.69 (0.08) 0.35 (0.02) 0.52 Uni, max 0.70 (0.03) 0.35 (0.04) 0.53 Uni, mean 0.69 (0.02) 0.39 (0.04) 0.54 R/O, min 0.69 (0.08) 0.34 (0.01) 0.51 R/O, max 0.72 (0.03) 0.33 (0.04) 0.52 R/O, mean 0.71 (0.06) 0.38 (0.02) 0.54 LVc, min 0.61 (0.03) 0.38 (0.04) 0.49 LVc, max 0.74 (0.06) 0.48 (0.01) 0.61 LVc, mean 0.75 (0.06) 0.50 (0.02) 0.62
[image:4.595.309.529.643.745.2]References
Isabel L. Beck, Margaret G. McKeown, Gale M. Sina-tra, and Jane A. Loxterman. 1991. Revising social studies text from a text-processing perspective:
Ev-idence of improved comprehensibility. Reading
Re-search Quarterly, pages 251–276.
Chutima Boonthum-Denecke, Philip M. McCarthy, Travis A. Lamkin, G. Tanner Jackson, Joseph P. Maglianoc, and Danielle S. McNamara. 2011. Au-tomatic natural language processing and the de-tection of reading skills and reading
comprehen-sion. InProceedings of the Twenty-Fourth
Interna-tional Florida Artificial Intelligence Research Soci-ety Conference, pages 234–239.
Jill Burstein, Karen Kukich, Susanne Wolff, Chi Lu, Martin Chodorow, Lisa Braden-Harder, and Mary Dee Harris. 1998. Automated scoring us-ing a hybrid feature identification technique. In Pro-ceedings of the 36th Annual Meeting of the Associ-ation for ComputAssoci-ational Linguistics and 17th Inter-national Conference on Computational Linguistics, pages 206–210, Montreal, Quebec, Canada, August. Association for Computational Linguistics.
Jill Burstein. 2003. The e-raterRscoring engine: Au-tomated essay scoring with natural language pro-cessing. In M. D. Shermis and J. Burstein, editors,
Automated Essay Scoring: A Cross-disciplinary Perspective. Lawrence Erlbaum Associates, Inc., Hillsdale, NJ.
Bradley Efron and Robert Tibshirani. 1986. Boot-strap methods for standard errors, confidence inter-vals, and other measures of statistical accuracy. Sta-tistical Science, 1:54–77.
Peter W. Foltz, Sara Gilliam, and Scott Kendall. 2000. Supporting content-based feedback in on-line
writ-ing evaluation with LSA. Interactive Learning
En-vironments, 8:111–127.
Arthur C. Graesser, Danielle S. McNamara, Max M. Louwerse, and Zhiqiang Cai. 2004. Coh-Metrix:
Analysis of text on cohesion and language.
Behav-ior Research Methods, Instruments, and Computers, 36:193202.
Arthur C. Graesser, Danielle S. McNamara, and Jonna M. Kulikowich. 2011. Coh-Metrix: Provid-ing multilevel analyses of text characteristics. Edu-cational Researcher, 40:223–234.
Weiwei Guo and Mona Diab. 2012. Modeling
sen-tences in the latent space. In Proceedings of the
50th Annual Meeting of the Association for Compu-tational Linguistics (ACL), pages 864–872.
Aaron Harnly, Ani Nenkova, Rebecca J. Passonneau, and Owen Rambow. 2005. Automation of summary
evaluation by the Pyramid Method. InRecent
Ad-vances in Natural Language Processing (RANLP), pages 226–232.
Thomas K Landauer and Susan T. Dumais. 1997. A solution to Plato’s problem: The latent semantic analysis theory of acquisition, induction, and
rep-resentation of knowledge. Psychological review,
pages 211–240.
Chin-Yew Lin and Eduard Hovy. 2003.
Auto-matic evaluation of summaries using n-gram
co-occurrence statistics. In Proceedings of the
Hu-man Language Technology Conference of the North American Chapter of the Association for Computa-tional Linguistics (HLT-NAACL), pages 71–78.
Chin-Yew Lin. 2004. ROUGE: A package for
au-tomatic evaluation of summaries. In Proceedings
of the Human Language Technology Conference of the North American Chapter of the Association for Computational Linguistics (HLT-NAACL), pages 463–470.
Annie Louis and Ani Nenkova. 2009. Evaluating con-tent selection in summarization without human
mod-els. InProceedings of the 2009 Conference on
Em-pirical Methods in Natural Language Processing, pages 306–314, Singapore, August. Association for Computational Linguistics.
Ani Nenkova and Rebecca J. Passonneau. 2004.
Evaluating content selection in summarization: The
Pyramid Method. In Proceedings of the
Hu-man Language Technology Conference of the North American Chapter of the Association for Computa-tional Linguistics, pages 145–152.
Rebecca J. Passonneau, Adam Goodkind, and Elena Levy. 2007. Annotation of children’s oral narra-tions: Modeling emergent narrative skills for com-putational applications. InProceedings of the Twen-tieth Annual Meeting of the Florida Artificial Intel-ligence Research Society (FLAIRS-20), pages 253– 258. AAAI Press.
Rebecca Passonneau. 2010. Formal and functional as-sessment of the Pyramid Method for summary con-tent evaluation. Natural Language Engineering, 16.
D. Perin, R. H. Bork, S. T. Peverly, and L. H. Mason. In press. A contextualized curricular supplement for
developmental reading and writing. Journal of
Col-lege Reading and Learning.
J. W. Ratcliff and D. Metzener. 1988. Pattern match-ing: the Gestalt approach.
Ben Wellner, Lisa Ferro, Warren R. Greiff, and Lynette Hirschman. 2006. Reading comprehension tests for
computer-based understanding evaluation. Natural