Munich Personal RePEc Archive
Incentives and the Supply of Effective
Charter Schools
Singleton, John
University of Rochester
25 September 2017
Online at
https://mpra.ub.uni-muenchen.de/83532/
Incentives and the Supply of Effective Charter Schools
∗John D. Singleton†
University of Rochester
September 2017
Abstract
Charter school funding is typically set by formulas that provide the same amount for all students regardless of advantage or need. In this paper, I present evidence that this policy skews the distribution of students served by charters towards low-cost populations by influencing where charter schools decide to open and whether they survive. I develop and estimate an empiri-cal model of charter school supply and competition to evaluate the effects of funding policies that aim to correct these incentives. To do this, I recover estimates of cost differentials across student populations by linking charter school effectiveness at raising student achievement with unique records of charter school expenditures gathered from Florida. I then leverage revealed preference with the exit and location choices of charter schools in an entry game to uncover how charter schools respond to competitive and financial incentives. The results indicate that a cost-adjusted funding formula would significantly increase the share of charter schools serving disadvantaged students with little reduction in the aggregate effectiveness of the sector.
∗I am grateful to Peter Arcidiacono, Pat Bayer, Hugh Macartney, and Chris Timmins for their guidance and
support. I also benefited from discussions with Atila Abdulkadiro˘glu, Allan Collard-Wexler, Paul Eliason, Paul Ellickson, Maria Marta Ferreyra, Helen Ladd, Carl Mela, Richard Murnane, Matt Panhans, Jimmy Roberts, Juan Carlos Su´arez Serrato, Ying Shi, Tedi Skiti, and Andrew Sweeting and thank seminar participants at AEFP, Duke, Penn State, Rochester, SOLE, UMass Amherst, UNC Chapel Hill, and Yale SOM. This work is supported by a National Academy of Education/Spencer Dissertation Fellowship.
1
Introduction
School choice reforms aim to improve school quality while expanding educational opportunity. In the United States, charter schools have become the primary vehicle for school choice, with a number of recent papers finding compelling evidence that charter schools are effective at improving student outcomes (Hoxby and Murarka, 2009; Abdulkadiro˘glu et al., 2011; Angrist et al., 2013a; Dobbie and Fryer, 2013). These findings have bolstered recent policy momentum behind charter schools, such as the Obama Administration’s Race to the Top, which is based in part on the belief that removing barriers to expansion will lead new, high-performing charter schools to serve underserved student populations.
Two common institutional features of the charter sector call this belief into question, however. First, charter schools, which are publicly funded but privately run, are typically funded by formulas that provide the same amount for all students regardless of advantage or need. Second, although charter schools are unable to screen students, they are differentiated by where they choose to locate and, due to travel costs, serve student compositions that closely reflect local demographics. Taken together, these features raise the question whether the current approach to funding skews the distribution of students served by charters towards low-cost student populations by influencing where charter schools decide to open and whether they survive.
To answer this question, I develop and estimate an empirical model of charter school supply and competition. The estimated model allows me to study counterfactual funding policies, in partic-ular a formula that ties revenue to the characteristics of students, in terms of equilibrium sector outcomes. In the model, charter schools choose a location in a school district based at least partly on expected revenues, which depend on enrollment and the statutory per-pupil funding rate, and costs. As variable costs depend on the composition of students served, the flat formula potentially presents a strategic incentive for new charter schools to spatially “cream skim” and creates dif-ferential likelihood of survival of incumbents. At the same time, due to competition with public and other charter schools for students, the exit and location choices of charter schools are mutually dependent in the model. I thus adapt the structure of an incomplete information entry game.
reflect their competitive and financial incentives and where those incentives can be measured in order to apply revealed preference. In this regard, Florida, which is characterized by limited au-thorization discretion for districts and an accordingly high charter penetration rate, is especially well-suited. I assemble a unique dataset that links detailed financial records gathered from inde-pendent audits filed by all Florida charter schools with student performance on end-of-grade state exams and school characteristics. I estimate school value-added or effectiveness at raising student achievement from the panel of student test scores, while the financial statements of charter schools enable me to separate cost from demand-side determinants for a charter school’s choice of location in the data.
I use the empirical model to evaluate the effects of funding policies on the composition of students served and the aggregate effectiveness of the charter sector. This latter outcome, which is sensi-tive to competisensi-tive incensensi-tives, is important for capturing a key policy tradeoff: funding policies that raise equity may do so by sustaining ineffective charter schools in the market. Three policy simulations are of interest: First, a cost-adjusted funding formula that ties revenue to student char-acteristics corrects the financial incentives to skim. I use this counterfactual to answer whether the current funding approach has unintended consequences. Second, targeted grants for entry into un-derserved markets may also incentivize charters to serve disadvantaged student populations. Lastly, a general increase in the per-pupil funding rate quantifies the elasticities of charter school supply and effectiveness with respect to funding. The predictions thus shed light on the value of expanded social investment in charter schooling.
rich heterogeneity across charter schools and a large number of locations for entrants to choose from, I implement a computationally light, two-stage estimator that uses choice probabilities estimated semi-parametrically offline.
The policy simulations reveal evidence that the flat funding formula leads charter schools to un-derserve disadvantaged student populations. Implementing a cost-adjusted funding formula yields about a 4% increase in the share of subsidized lunch students and a 9% increase in the share of black students attending charter schools. In addition, because the charter schools sustained in the market by this policy change are not low effectiveness schools, this gain in equity is associated with little change in the aggregate effectiveness of the charter sector. By comparison, a location targeted start-up grant successfully shifts the location choices of new charter schools to underserved areas, but yields little net change in outcomes. Furthermore, though the total number of charter schools predictably increases, aggregate effectiveness responds only marginally due to an overall increase in charter school funding. This reinforces the general finding that gains in access to school choice do not appear costly in terms of the quality of charter schooling.
These findings are important as they are informative about school choice policy. In particular, a mismatch between funding and costs may generate significant inequities in access to and benefits from school choice. This point, which is largely unrecognized in both the existing literature on education markets and ongoing policy debate, has potentially broad implications for the design of school choice programs. The findings also underscore that funding policy, an element of both private school voucher and charter school programs, may provide an effective policy instrument for directing competition via supply-side incentives.
2
Related Literature
School choice reforms embody two policy ambitions. The first is to enhance the quality of public education. Mechanisms supporting this include both direct access to better school alternatives for students and improvements in school quality stimulated by competition. The second ambition is to expand educational opportunities for underserved students. The growing empirical school choice literature, which combines evidence from international and domestic school choice programs (often private school vouchers and charter schools, respectively), can be viewed as attempts to asses the ability and conditions under which school choice policies may fulfill these ambitions.
A major strand of literature evaluates the effectiveness at improving student outcomes of school alternatives supported by school choice policies. Examples include evaluations of private schools and voucher programs, which in general find positive effects of private school attendance.1 Evalu-ations of charter schools typically rely on either student-level administrative data or on admissions lotteries. Papers that estimate charter school effects from changes in exam performance for stu-dents who switch between sectors find largely mixed results overall (Sass, 2006; Hanushek et al., 2007; Booker et al., 2007).2 On the other hand, lottery designs provide compelling evidence of improvement in student outcomes (Hoxby and Murarka, 2009; Abdulkadiro˘glu et al., 2011; Angrist et al., 2013a; Dobbie and Fryer, 2013), and the benefits of charter school attendance appear highest for students from disadvantaged backgrounds (Angrist et al., 2012, 2013b).3 These findings have partly motivated policy efforts to expand charter schooling.4
Charter expansion, though, raises questions about the role of competition in education markets. To the degree that households value school quality, school choice creates competitive incentives intended to enhance the quality of public education. This rationale, for instance, is explicitly written in to a number of charter laws, including Florida’s. One mechanism for this may be that school choice induces government and public schools to improve. Neilson (2013), for example, studies an
1
In the U.S. context, a number of authors have examined the effectiveness of Catholic private schools (Neal, 1997; Altonji et al., 2005). International evidence, relying on lottery designs, finds largely positive impacts of attending private schools (Angrist et al., 2002, 2006; Muralidharan and Sundararaman, 2015).
2
Similarly, CREDO (2009) uses matching techniques with student level-data from fifteen states and D.C., finding considerable heterogeneity in average charter quality.
3
A major limitation of lottery designs, however, is that they can only be applied to evalute oversubscribed charter schools.
4
expansion of a private school voucher program in Chile, finding an increase in the quality of public schools in response. Papers examining the competitive effects of charters on public school quality, on the other hand, find ambiguous results.5 Competition may nonetheless discipline the quality of
school choice alternatives. Baude et al. (2014) present evidence of improvements in charter school quality in Texas over a ten-year period due to the exit and replacement of low-performing charter schools.
At the same time, scholars have long recognized the potential for school choice policies to generate inequities, compromising the second ambition. While households choosing schools based on char-acteristics other than school quality will tend to weaken competitive incentives, heterogeneity in prefereneces may also lead to stratification (Hastings et al., 2006; Bayer et al., 2007). Weiher and Tedin (2002) present evidence that racial composition predicts households’ choice of charter school and Bifulco and Ladd (2007) attribute widening black-white achievement gaps to sorting along racial lines. Such patterns raise the question whether differences across households in the exercise of school choice enables the re-segregation of education.6 Moreover, how households choose schools and the extent to which preferences for quality vary have supply-side implications that may cut against policy goals. Walters (2014) presents evidence from Boston that although disadvantaged students are most likely to benefit from charter schools, they are significantly less likely to apply and attend.
The role of costs in shaping outcomes remains largely neglected by both of these strands of literature, however. Costs, which influence the supply of school choice alternatives, are important for two reasons: First, fixed costs of entry may undermine competitive incentives by, for instance, leading to excessive or insufficient entry (Spence, 1976; Dixit and Stiglitz, 1977; Mankiw and Whinston, 1986). School choice is only effective if school alternatives are available and underperforming schools face competitive pressure. Second, costs may be an independent source of disparities in education outcomes by generating inequities in access to school choice.7 With differences in the cost
5
For example, Sass (2006), Booker et al. (2008), and Winters (2012) report positive, if modest, effects, but Bettinger (2005), Bifulco and Ladd (2006), and Zimmer and Buddin (2009) find no competitive effects. Using an IV strategy to overcome endogenous charter location, Imberman (2011) finds mixed or even negative effects.
6
More recently, Ladd et al. (2015) show that apparent improvements in charter school performance in North Carolina may be driven primarily by positive student selection.
7
of providing education to disadvantaged students (Duncombe and Yinger, 2005), such inequities may stem from program funding that provides the same amount for all students. In recognizing and quantifying the effects of this incentive, this paper thus has parallels with the literature on cost-based cream skimming in health care markets (Ma, 1994; Currie and Fahr, 2005) and advances the literature on estimation of education costs by linking cost differentials to school behavior and the design of school choice policy (Downes and Pogue, 1994).8
In this paper, I estimate the full cost structure of charter schools, which includes entry costs and operating cost differences across student populations. The empirical entry model I develop then allows me to connect education market equilibrium outcomes with funding policy through the strategic location choices of charter schools. In adapting these methods to my setting, the paper fits into the growing empirical literature using these methods to analyze policy questions (Berry and Reiss, 2007). Limited prior work has examined the determinants of charter school supply and location, such as Glomm et al. (2005) and Hoxby (2006), but these studies take a descriptive approach that is unable to separate demand from cost determinants and does not permit studying counterfactual policy changes. In work related to my apporach, Ferreyra and Kosenok (2015) model demand for and entry of charter schools in Washington D.C., finding prospective welfare benefits of expansion, but do not model or consider the implications of strategic behavior by charter schools.9 In addition, this paper differs in focusing on how policies affect the equilibrium quality of charter schooling, which I am able to measure in value-added terms from the panel of student test scores.
3
Background and Data
I describe the institutional background of charter schooling in Florida in this section to highlight the features that make it well-suited to studying charter school supply and competition. In particular, Florida, by limiting discretion of school districts when authorizing new charter schools, provides a setting in which charter schools’ entry and location choices reflect their competitive and financial incentives and where those incentives can be measured.
8
Relatedly, targeted private school vouchers have been studied as a means of minimizing cream skimming due to peer-based externalities in education production (Nechyba, 2000; Epple and Romano, 2008).
9
The unique dataset I assemble combines detailed records gathered from financial audits filed by all Florida charter schools with student performance on end-of-grade exams and school characteris-tics. The merged panel facilitates estimating cost differentials across student populations from the relationship between expenditures, student composition, and gains in student achievement across charter schools. In addition, school locations are key as a choice variable for charters and for cal-culating the spatial distances between schools. After describing the institutional background and data sources for the panel, which tracks charter schools between the 2006-7 and 2012-13 school years, I also present summary statistics in this section.
3.1 Charter Schooling in Florida
Laws authorizing charter schools aim to strike a balance between operational autonomy and ac-countability. For instance, charter schools are generally granted considerable independence in terms of curricular design and focus, human resources, and choice of location. To ensure equity, how-ever, charter schools may not screen students or apply any admissions criteria, such as tuition or entrance exams. If a charter school is oversubscribed, an admissions lottery must be held to randomly allocate places in the school. Further, charter schools are not exempt from state account-ability and reporting requirements. Florida charter schools, for example, must participate in the School Grades program which assigns letter grades to schools based on student performance on end-of-grade exams.10 While accountability provisions require intervention in cases of persistently
poor performing charters, instances of forced shutdown are relatively rare. A Center for Education Reform report, for example, found that just 18% of charter closures nationally were attributable to academic reasons (Consoletti, 2011).
Although the level varies by state or district, charter school funding typically provides the same amount for all students served by a school. For example, Florida charter schools receive per-pupil disbursements through the Florida Education Finance Program (FEFP) according to a statutory formula. A base funding rate for each full-time equivalent student is multiplied by a district cost differential and totaled. While additional cost adjustments are made for disabled and English language learner students, charter school enrollment of these student populations is low.11 This
10
The School Grades program accounts for both achievement and learning gains.
11
funding source may be supplemented by federal programs, such as Title 1, other state sources, or private contributions, but the FEFP program provides the vast majority of operating support for charter schools.12 The implication of this is that two charter schools serving student populations
with different educational needs or advantages, but located in the same school district, will receive largely the same per-pupil support.
Charter schools are authorized by public school officials. In this regard, Florida’s distinctive in-stitutional environment provides a number of advantages for studying charter school supply and competition. First, in contrast with a number of other settings such as Massachusetts and Wash-ington D.C., caps on the number of schools are not and have never been in place. Second, school districts, which are coterminous with counties in Florida, retain sole authorization responsibility. This ensures that accountability standards are uniform for large, well-defined education markets that contain significant internal heterogeneity, such as both rural areas and urban centers.13 Fi-nally, Florida statutes spell out the criteria that school districts may apply in reviewing applications for new charter schools. A prospective charter school must outline its guiding principles and ob-jectives, an “innovative” curriculum that meets state requirements for reading instruction, and a financial plan. This authorization process thus differs dramatically from other settings. A prospec-tive new charter school in Massachusetts, for example, competes with a number of other applicants for authorization and is vetted based partly upon perceived need and expected success. In contrast, Florida provides a setting in which the entry and location choices of charter schools can be viewed as reflecting revealed preference.
The combined effect of Florida’s charter-friendly environment is a vital charter sector, characterized by both rapid growth and significant turnover. The first Florida charter schools opened for the 1996-7 school year. Since then, the sector has expanded into one of the largest nationwide in both enrollment terms and the number of charter schools. For the 2014-15 school year, 646 charter
compares to 14% and 5% respectively for the median public school in Florida. Recent evidence indicates this enrollment gap is explained by the combination of a lower baseline probability to apply and a reduced likelihood of special education classification in charter schools (Setren, 2016; Winters et al., 2017; Winters, 2015).
12
Charter schools are not considered separate Local Education Agencies in Florida and may receive capital funding or apply for state grants, but these account for little of operational revenues. Florida school districts are not required to share local revenues with charters and almost all do not. However, because Florida’s school finance system is largely centralized through FEFP, charters are less disadvantaged in funding relative to public schools than in many other states.
13
schools served over 8% of all Florida public school students, including more than 13% in Broward and Miami-Dade counties. In addition to the high penetration of charter schooling in Florida, there is a great deal of entry and exit. For instance, 75 new charter schools schools opened just for the 2013-14 school year, while 38 shut down and closed.
3.2 Data Sources
I combine newly collected financial records for Florida charter schools with existing data on all Florida public schools. Per Florida statute, all charter schools must file an independent financial audit with their district and the state for each year of operation. Containing revenue, itemized expenditures, assets, and capital investment, the audits richly characterize the spending patterns and financial health of each charter school. I gathered and digitized all audits on file with the Auditor General for the 2006-7 through 2012-13 schools years. As a source of financial data, the audits provide two added advantages (beyond their availability): (1) the audits correspond to an individual school year rather than a fiscal year; and (2) an audit must be filed for each individual school.
I use reported total expenditures to measure the variable costs of charter school operation in a given year.14 These costs therefore include salaries paid to teachers, staff, and administrators, facility rent or mortgage payments, and any management fee paid, among other expenses incurred during a school year. In using expenditures to measure variable costs, two points of clarification are important: First, these expenditures represent variable costs in that they reflect annually adjustable input purchases and exclude the opportunity costs of entering the market and of operation (which inherently cannot appear on an accounting statement). As explained later, such sunk or fixed “costs” are identified from the entry and continuation decisions of charter schools. Second, the expenditures reported in the audits are not necessarily costs at the frontier (i.e. the costs that would be incurred were a charter school efficient in its input usage). Rather, the expenditures embed any allocative inefficiency, presenting a potential challenge for identification.
Three data sources provide information about the characteristics of Florida charter and public schools. First, I obtain enrollment, grade level, and student body characteristics for all schools
14
from the National Center for Education Statistics’ Common Core of Data for the 2006-7 through 2013-14 school years.15 I define a school as open (i.e. operational) if enrollment in any primary grade (K through 5) is positive and calculate the number of years since opening for each charter school. Second, I merge these records with the Florida Department of Education’s master school database. This database is used to identify schools as a charter school or not per state records and to obtain each school’s exact address.16 The last data source for school characteristics pertains to their locations and spatial relationship. I geocode the school addresses to 2000 Census tracts, for which I obtain American Community Survey estimates of the local demographics.17 This is important as it allows me to relate the composition of each school’s student body to the composition of the tract where it is located. The spatial distances between tracts also allow me to identify each school’s set of competitors.
Finally, I obtain summaries of student achievement by school and grade on end-of-grade Florida Comprehensive Assessment Tests (FCAT) from the Florida Bureau of K-12 Assessment for years 2006-7 through 2013-14. Students attending charter and public elementary schools in grades 3 through 5 are examined in math and reading. For each tested grade in a given year, the data contain both the average current score and average prior year’s score by grade and school for the set of students for whom records for both years are available.18 Since testing begins in the third grade, I use only fourth and fifth grade performance to have a measure of prior learning for all grades. These score averages, which I normalize across schools within grade and year, allow me to estimate the value-added or effectiveness of each school at raising student achievement. I describe the specification and estimation of education production fully later.
My final merged panel tracks 341 charter elementary schools in Florida between the 2006-7 and 2012-13 school years. I restrict the sample to non-conversion and non-municipal charter schools, charter schools that are not a virtual school or laboratory school, and charter schools not specialized
15
For grade-level demographics, subsidized lunch, English language learner, and disabled status, I supplement these data with FCAT Demographic Reports.
16
A limitation of this data source is that only the present address of charter schools is recorded, so I do not observe moves or model charter school location changes.
17
I use 5-year Census tract estimates for 2005-9 through 2009-13, treating the middle year as corresponding to the spring of that school year. I impute data for 2012 and 2013. I then calculate location characteristics within a given distance of each Census tract using distances between centroids and population weights.
18
in serving disabled student populations. 193, or 57%, of the charter schools began operation during the seven year sample period, while 67 (20%) exit at some point. The median charter school is tracked for four school years.19 Included in the sample are also all traditional public elementary
schools in Florida.
3.3 Preliminary Evidence
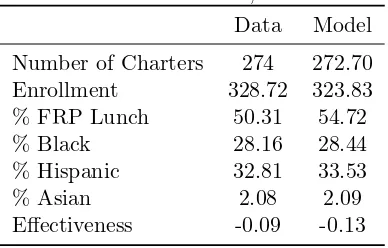
In this subsection, I present preliminary evidence that suggests that cost differences not reflected in statutory funding formulas influence charter school supply. To begin with, I compare the location and student characteristics of charter schools in Florida with public schools in Table 1. Concerns that charter schools underserve disadvantaged students may be largely misplaced if, as the literature suggests (Epple et al., 2015), charter schools tend to serve more urban areas and minority student populations. However, such comparisons are typically made across education markets, rather than within them. In Florida, for example, many low population and rural school districts have no charter schools at all, potentially biasing the comparison. Florida charter schools As a result, I compare charter and public schools that are located in the same school district, which defines an education market in Florida.20 The resulting comparisons in Table 1 reveal that, charter schools actually operate in less dense locations and serve a slightly larger share of students who are non-minority on average than public schools located in the same school district.21
A complementary approach to assessing the importance of cost differentials would potentially be to examine, similar to Glomm et al. (2005) and Hoxby (2006), the determinants of charter school presence in a market or location. The value of this exercise, however, is limited because many determinants, principally the demographic mix, simultaneously influence charter school presence through both demand and costs (variables and fixed). Instead, I propose a test based on whether an incumbent charter school continues or exits from the market: with a flat funding formula, cost differentials predict that, all else held equal, exit should be associated with the characteristics of the student population a charter school serves. This exercise thus leverages a charter school’s
19
I am able to match expenditure data for 92% of charter school-year observations. The match rate is particularly low in the school year that a charter school closes, however.
20
I regress each variable on district fixed effects, then use the residual (plus the constant for Palm Beach) for the comparisons. In the Appendix, I provide summaries for just charter schools in the 2012-13 school year.
21
enrollment (in combination with the funding formula) to implicitly condition on expected revenue, using the independent variation in enrolled student composition to proxy for cost differentials.
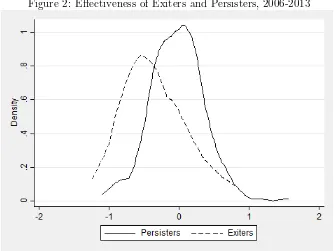
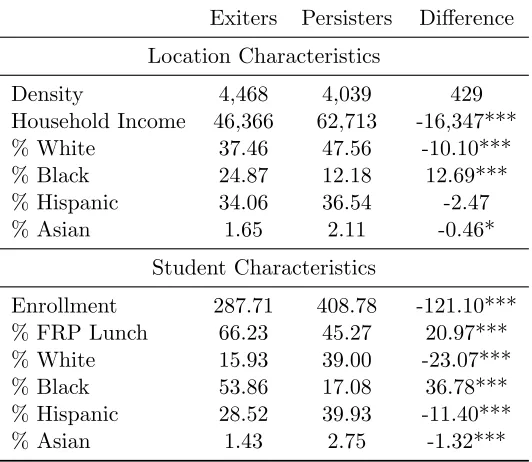
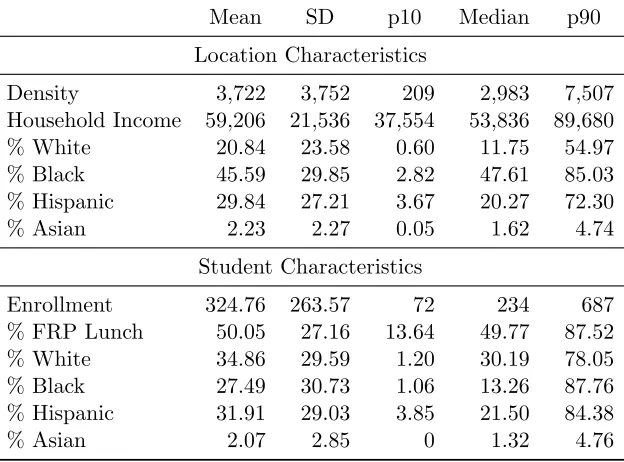
Before performing this test, I first present summary statistics in Table 2 that compare charter schools that ever exit during the sameple with those that persist (i.e. are either open in 2007-8 or open at some point after, but do not exit by 2012-13).22 Indicative of the importance of location
and travel costs, the summaries show a close correspondence between the characteristics of charter schools’ locations and the characteristics of students they serve. Additionally, the comparisons also reveal a number of striking differences between exiters and persisters. In particular, the locations of charter schools that exit are higher density and much lower income on average (about $16,000 less mean household income). Accordingly, the average exiter charter school serves a 21 percentage point larger share subsidized lunch student composition. Exiters also serve a 37 percentage point larger share black student composition on average.
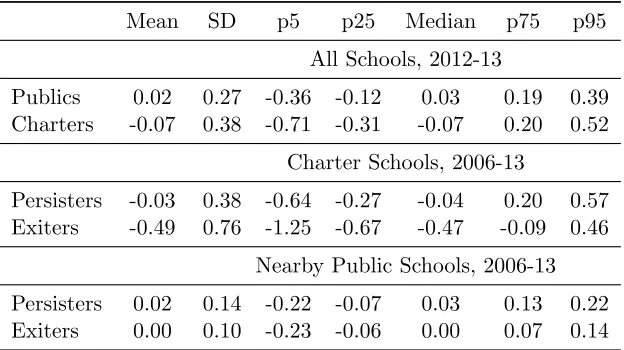
Table 3 compares exiter and persister charter schools in terms of expenditure per pupil and stu-dent performance on end-of-grade exams. The comparisons reveal that charter schools that exit spend nearly $900 more per pupil (approximately 10% of total expenditure) per year than those that persist in the sample. In terms of achievement in math and reading performance, students attending exiter charter schools perform dramatically worse on average. The average math score for exiter charter schools, for example, is nearly 1 standard deviation on average below that of persister charter school. Nonetheless, these comparisons are ambiguous about the mechanisms structuring the education market. For instance, though exiters both serve more disadvantaged student pop-ulations and spend more per pupil on average, this association may be explained by where they locate rather than cost differences across student populations. Similarly, the large differences in student test performance may indicate differences in effectiveness at raising student achievement, consistent with market efficiency, or just reflect the differences in socioeconomic advantage between students attending exiter and persister charter schools
To get at the possible role of cost differentials, the proposed test thus examines how characteristics of the student population a charter school serves predict exit from the market. Such an association
22
would be consistent with cost differences across student populations not reflected in the statutory funding formula. To implement the test, I estimate linear probability models of the form:
Exitit=βf(Zit) +γXit+ǫit (1)
In this equation,Exititis an indicator variable for whether charter schooliexits the sample between
period t and t+ 1 and Zit represents the characteristics of the student body at charter school j,
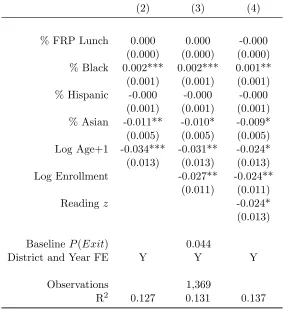
including demographics and free or reduced price lunch status. These characteristics proxy for differences in socioeconomic status, household wealth, and other sources of advantage. I use f() to indicate that I allow for nonlinearities (interactions and quadratic terms) in the percentage of each student group in the specification. Xitis the set of control variables, including characteristics of the school’s location, the charter school’s age, measures of local competition, enrollment, and reading test scores. Importantly, expenditure per pupil is not included as a control because costs are the channel through which student characteristics are proposed to affect exit. ǫjt represents a
mean-independent error term. Table 4 presents the results.
The estimates in column (1) indicate that a 10 percentage point increase in the share of black students attending a charter school is associated with a 0.02 point increase in the probability of exit, all else held constant. This magnitude represents a nearly 50% increase in the exit probability from the baseline level. The share of Hispanic students is not statistically associated with exit, while the share of Asians student is negatively related. Reflecting significant collinearity with the demographic shares, the composition of free and reduced price lunch is not significantly related to exit.23 By conditioning on enrollment, which proxies for expected revenues, column (2) implements the proposed test. The share of black students remains positively associated with exit and of similar magnitude, while the marginal effect of the share of Asian students does not differ from 0 at the 95% significance level. Finally, column (3) also controls for the reading achievement of students. While this control attenuates the estimate by around half, the the marginal effect of the share of black students on exit remains statistically and economically significant.
These results provide indirect evidence for the presence of cost differences across students that
23
are not reflected in the funding formula. Nonetheless, these results are not able to rule out unob-served differences across schools that may influence survival, including differences in value-added or effectiveness. Moreover, applying this interpretation presumes that student characteristics shift costs and, further, that charter schools respond to those differences. The empirical model, which I describe in the next section, aims to directly quantify these mechanisms by, respectively, esti-mating variable costs across student populations from the expenditure data and applying revealed preference to exit and the location choices of new charter schools in an incomplete information entry game. These sources of evidence facilitate establishing the extent to which funding policy may skew the distribution of students served by charters towards low-cost student populations as well as evaluating counterfactual policies in terms of equilibrium sector outcomes.
4
Empirical Model
This section presents the empirical model of charter school supply and competition that I develop to study the effects of funding policy on equilibrium sector outcomes. Absent suitable empirical variation in funding policy, the model links the competitive and financial incentives of charter schools with their location and operation choices to apply revealed preference. For this purpose, there are two key elements of the model: First, I allow charter schools to differ in their effectiveness at raising student achievement (i.e. value-added), which is valued by households on the demand side. This allows for competition to drive ineffective charter schools from business and for assessing the effects of funding policy on the aggregate quality of the charter sector. Second, the variable costs of operating a charter school depend on the characteristics of students served. As a result, given the statutory funding formula, new charter schools may strategically locate to attract fewer costly-to-serve students and incumbents’ survival may be linked to differences in the needs or advantages of the students they serve.
the school year and, if so, on a location in the school district. These choices, predicated in part on expected revenues (which depend on the per-pupil funding rate) and costs, define the set of active schools from which households may choose. Households then choose a school to attend at the beginning of the school year. Given enrollments and the effectivenesses of schools in operation, variable costs and student achievement are realized at the end of the school year.
Charter schools’ entry and exit choices are made in an incomplete information setting. Given the payoff-relevant information summarized by a commonly observed state vector, charter schools’ choices constitute a Bayesian Nash equilibrium. The state vector then evolves between periods as a result of those choices. I adapt this basic entry game setup in a few ways for my setting. First, competition contains a spatial dimension and entering charter schools choose a location, which is characterized as a bundle of expected enrollments and costs. Second, I treat charter schools as not-for-profit maximizers that may behave as if they value output and effectiveness along with net income. Charter schools are characterized by their effectiveness at raising student achievement, profit status, age, and incumbency status in the model.
While the model endogenizes the composition of students served by charter schools (via location choices and demand) and the aggregate effectiveness of the charter sector (through differential survival), I abstract from other aspects of the education market. For instance, though they compete for students with charter schools, the locations and effectivenesses of public schools are treated as exogenous.24 Additionally, while entry and exit dynamics may shift effectiveness in the aggregate, I do not model changes in effectiveness over time at the school level. Instead, effectiveness is an idiosyncratic characteristic drawn post-entry, and thereby an added source of uncertainty in the model, that evolves in a deterministic fashion.
This section is divided into three parts. In the first subsection, I define a school’s effectiveness as its contribution to student learning in the context of a value-added education production function. In the second subsection, I detail the elements of the location choices of potential entrant charter schools and exit choices of incumbent charter schools, which are predicated on the “primitives” of demand and costs. I describe the equilibrium concept and evolution of states in the last subsection. Throughout, I suppress district-specific notation to simplify the exposition.
24
4.1 Education Production
In the model, both public and charter schools combine their inputs with those of households to pro-duce education outcomes, measured by student performance on end-of-grade exams. Performance also depends on accumulated impacts of inputs up to the present, which I assume are fully sum-marized by exam performance the prior year. As a result, education is produced in a value-added fashion:
Aknit=ρkAknt−1+βkZnt+µit+νnitk (2)
In this equation,Anitis studentn’s achievement from attending schooliduring school yeart, while
Ant−1 represents prior learning. The k superscripts index subjects, e.g. math and reading. The
contribution of household inputs to learning is represented by βkZnt, while νk
nit is a mean-zero
measurement error.
I term the contribution or value-added of school i to student learning gains, represented by µit,
its effectiveness. This term summarizes the productive contribution of all of a school’s inputs to student learning, including teacher quality, learning environment, infrastructure, management, etc., in a single index. In this way, effectiveness, which might equally be thought of as quality, vertically differentiates schools in the model.
4.2 Charter School Utility and Income
Based on their status in the prior period, charter schools in the model are either incumbents, who choose whether to exit, or potential entrants, who choose whether to enter and a location. While these choices are based in part on expected revenues and costs, I model charter schools as not-for-profit maximizers that potentially behave as if they value enrollment per se and their own effectiveness in addition to net income.
The latent utility for charter school ioperating in locationj at statest is given by:
Uij(st) =Ui(Πij(st), Dij(st), µit) (3)
formula-tion of not-for-profit utility, which shares commonalities with numerous health sector applicaformula-tions (Lakdawalla and Philipson, 2006), is intended to capture charter school operation for altruistic or mission-oriented reasons (Malani et al., 2003). An implication of this utility is that the degree to which charter schools respond to financial incentives, such as a counterfactual change to the funding formula, is an empirical question. In the estimation, I allow the parameters of the utility function (3) to be heterogeneous by whether a charter school is managed by a for-profit organization.25
Represented by Πij(st), net income is determined by revenue, variable costs, and fixed costs of
operation, F Cjt:
Πij(st) =τtDij(st)−V Cij(st)−F Cjt (4)
The product of the funding rate, τt, and enrollment yields revenue. Each location in a school district,j, is associated with an enrollment level,Dij(st), and variable costs of operation,V Cij(st). Charter schools’ choices of where to locate or whether to exit therefore depend on these “primitives.” I describe the structure I place on these objects, from which competitive and strategic incentives derive, in turn next.
4.2.1 Demand
Households’ school choice determines charter school enrollment in the model. Households weigh characteristics, including effectiveness, which may be imperfectly observed, travel distance, and the enrollment of peers, in selecting a school to attend from among the available alternatives in their district. As a result, the locations and effectiveness of public and other charter schools have competitive implications for charter schools’ enrollment.
For parsimony, I abstract from the household-level choice problem to model the enrollment of a given household type z at each charter school as a function of its effectiveness, the enrollment of other household types, location, and competition. Household types include demographic and
25
socioeconomic groups. The total enrollment of student groupzin schooliin locationjis given by:
Dzij(st) =Dz(µit,Dij−z(st), xzjt, a−it, µ−it) (5)
In this expression, demand depends in part on the effectiveness,µit, of a charter school as well as the size of the market in location j for typez, denoted xz
j(t. Additionally, enrollment of student group zdepends on the enrollment of other types of students, represented by vectorD−ijz(st), in equation (5). This is consistent with the evidence on school sorting that indicates preferences for peer groups influence households’ school choice (Rothstein, 2006). Note that such preferences over peers may be direct or induced by, for example, preferences over test score levels, which households may use to imperfectly infer effectiveness. Finally, reflecting local competition, a−it and µ−it represent the
locations and effectivenesses, respectively, of competing charter and public schools schools.
This formulation of demand captures a number of important features of education markets: First, the demand function incorporates competitive effects of nearby public and competing charter schools, which may be magnified by closer proximity. In this way, competition between schools is spatial, reflecting the imperfectly competitive nature of the education market. Second, effective-ness, to the degree that is valued by households, will also differentiates schools in that, all things being equal, greater own effectiveness increases enrollment. These features are important for mod-eling the horizontal and vertical aspects of school competition. Finally, the formulation allows for heterogeneity in how households, characterized by type, evaluate school alternatives, such as how they weight effectiveness and peers in their choice.
From (5), the total enrollment for a charter schooliin locationjis given by summing demand over mutually-exclusive household types:
Dij(st) =
X
z
Dzij(st) (6)
4.2.2 Variable Costs
Operating a charter school incurs costs that can be conceptually separated into variable and fixed. Variable costs represent the minimum expenditure for a charter school in a given state. Unlike fixed costs, variable costs therefore depend on input prices, which may vary across locations and with student composition, and a charter school’s outputs. These relationships are summarized by charter schools’ variable cost function:
V Cij(st) =V C(Dij(st), µit,Zij(st), xCjt) (7)
Expressed in this way, each charter school is a “firm” that produces effectivenessµit for a given en-rollment,Dij(st), and composition of students,Zij(st).26 As effectiveness represents a combination
of inputs, this formulation recognizes it as potentially costly to supply.
Since student composition is tied to a charter school’s location through demand, a strategic incen-tive to “cream skim” potentially derives from the dependence of costs on the student composition served in equation (7). While I do not model the mechanism through which they arise, such cost differentials may in general stem from two sources: the production surface or input prices. For in-stance, teaching assistants or non-classroom school inputs, such as social services, may be especially important for effectively serving disadvantaged students. This is consistent with recent evidence from school finance reforms that spending improves later life outcomes of low socioeconomic status students in part by increasing support services and staff (Jackson et al., 2015).27 As a result,
the optimal mix of inputs may vary with the composition of students. To input prices, evidence from teacher sorting suggests that teachers view concentrations of disadvantaged students as a disamenity, necessitating compensating differentials (Lankford et al., 2002; Jackson, 2009; Clotfel-ter et al., 2011).28 I assume that input prices are fully captured by the combination of a charter school’s student composition and location-specific characteristics,xC
jt.
26
The variable cost function is derived from a cost-minimization problem over inputs conditional on effectiveness and enrollments.
27
Relatedly, students in schools with concentrated low-income populations disproportionately benefit from non-instructional spending (Sorensen, 2016).
28
4.3 Entry Location and Exit
Charter schools decide where to locate (if a potential entrant) and whether to exit (if an incumbent) in the model. These choices are made simultaneously in an incomplete information setting.29 In other words, while state variables such as market characteristics and the effectivenesses of public schools and incumbents are commonly observed, the actions of competitor schools are stochastic from the point of view of a given charter school. In addition, the effectiveness of potential entrants is only revealed (to them and to rivals) post-entry, so charter schools also take expectations over this vector to evaluate the choice alternatives in expected utility terms.
For describing charter schools’ choice problems in the game, it is useful to divide the state vector,
st, into four sub-components. First, a−it represents the actions of other charter schools, which
may be either a location in the market or decision to exit/remain out, and the locations of public schools. Second, sit lists the characteristics of charter school i, which include its effectiveness, its profit status, its age and incumbency (i.e. whether in operation the prior period). Vectors−it, on
the other hand, lists the characteristics of charter schools other than iand of public schools, while
xt summarizes the exogenous characteristics of all market locations that shift demand and variable
costs and also contains the per-pupil funding rate τt. Unlike potential entrants’ effectiveness, the profit status of all charter schools in the market is commonly known.
Incumbent charter schools in statestmake the choice of remaining in operation in their present loca-tionjor exiting the market. Operation yields expected utilityE[Uij(st)] =E[Uj(a−it, sit, s−it, xt)],
while I normalize the value of exiting to 0. Each choice alternative is associated with a correspond-ing private information draw that is known to the charter school, but unobserved to competitors and to the econometrician. Thus, incumbent i’s choice problem can be expressed as to remain in operation (in location j) if:
E[Uj(a−it, sit, s−it, xt)] +ǫijt≥ǫi0t (8)
and to close otherwise. ǫijt and ǫi0t represent i’s private information regarding the utility of
con-tinuing operation and exiting, respectively. The expectation in (8) is taken over competing charter
29
schools’ simultaneous entry location and exit decisions and the effectivenesses of potential entrants.
For a charter school deciding to enter the market, the choice problem also contains a location choice. An entering charter school weighs the alternative locations in a school district, indexed by
j, by computing the expected utility of each alternative. Entering the market incurs entry costs that are denotedECt, which represent both monetary and non-monetary costs associated with the
application, authorization, and opening process, including organizing a board, curriculum, staffing, and securing facilities. The choice problem facing potential entrants can be written as:
max{E[Uj(a−it, sit, s−it, xt)]−ECt+ǫijt, ..., E[UJ(a−it, sit, s−it, xt)]−ECt+ǫiJ t, ǫi0t} (9)
Recall that, in addition to the entry and exit choices of competitors, potential entrants take expec-tations over their own (and all other potential entrants’) effectiveness, which is revealed post-entry. Importantly, this uncertainty over their own effectiveness generates, via heterogeneity in how house-holds value quality on the demand side, uncertainty for potential entrants in the composition of students they will serve when selecting a given location. Potential entrants may choose to remain out of the market, which yields only the associated private information draw, in addition to the set of locations in the school district district.
4.4 Equilibrium and State Evolution
Equations (8) and (9) map charter schools’ expected utility, given their beliefs about the choices of other charter schools, into ex ante choice probabilities. Since the choice shocks are private information, each charter school’s decision rule is a function of the common state variables and its private information, but not the private information of other charter schools. I denote by Pt the
set of all charter schools’ choice probabilities to re-express the expected utility for charter schooli
of location j as:
E[Uj(a−it, sit, s−it, xt)] = ˜uij(st,Pt) (10)
Given this expected utility, (8) and (9) represent a system of best response probability functions that define the Bayesian Nash equilibrium of the game wherein strategies and beliefs are consistent.30
30
Charter schools’ choices determine the equilibrium outcomes in the current period and the state vector evolves as a result of those choices.
The vector of charter schools’ effectivenesses, µt, is a state that influences choices and thereby
outcomes. While competitive entry and exit dynamics endogenize the aggregate effectiveness of the charter sector in the model, I specify a deterministic law of motion for the evolution of a given school’s effectiveness between periods:
µit=µ1i+µ2log(ait+ 1) (11)
In this process, µ1i represents an idiosyncratic and permanent component of effectiveness that is
drawn upon entry, while µ2 scales the rate at which effectiveness accumulates with age, ait, of a
charter school. This process, which is similar to returns to teacher quality with experience, captures improvement over time within charter schools.
5
Estimation and Identification
Estimation of the empirical model broadly consists of three steps: (1) recovering effectiveness of schools from the panel of test score data; (2) estimating the demand and variable cost functions, which shape the incentive structure of charter school operation; and (3) plugging-in the “offline” es-timates to leverage revealed preference with the entry game to uncover how charter schools respond to the incentive structure. In this section, I detail each step and the identification assumptions made to recover the model parameters.
5.1 Offline Elements
5.1.1 Effectiveness
I use the panel of end-of-grade exam scores by school and grade to estimate the effectiveness of each school at raising student achievement. Averaging (2) to the grade level and substituting in
charter schools’ law of motion for effectiveness (11) yields the equation that I take to the data:
Akigt=ρkgAkigt−1+βkZigt+µ1i+µ2log(ait+ 1) +δkgt+νigtk (12)
The dependent variable, Ak
igt, is the normalized average subject k score of grade g students in
school j at timet, while Ak
igt−1 is their average score the prior year.31 Net of subject-grade-year
intercepts, δk
gt, effectiveness at raising student achievement is constant across subjects and grades.
The primary identification challenge in recovering estimates of school effectiveness stems from potential household sorting on unobservables across schools. As a result, the control for prior year’s achievement in (12), assumed to capture unobserved inputs into student learning prior to t, is key to guard against this. Recent evidence regarding teachers’ value-added, for example, indicates that controlling for prior student test scores is most important for obtaining unbiased estimates (Chetty et al., 2014). In addition to the prior scores, however, I also control for all observed grade-level student characteristics, including demographics, subsidized lunch, special education, English language learner, and gifted student status inZigt.32 To allow for differential sorting across public
and charter schools, I also interact the household variables with a charter indicator.
I estimate (12) by school fixed effects pooling charter and public schools, while allowing ρ to vary by grade and subject andβ to vary by subject. In the estimation, I weight each observation in the data by the number of students going into calculation of the achievement score averages. The fixed effects for charters schools are taken as estimates of µ1i, while the effectivenesses of public schools
are assumed to be fixed over time. Residual average growth in student performance across grades and years therefore identifies the effectiveness of each school.
5.1.2 Demand
To estimate charter school demand, I pool the elementary enrollment of household types across charter schools and years. I use Asian, black, Hispanic, white, other demographic, and subsidized
31
Note that the averaging in both years is over the same students, although the prior score may have been received at a different Florida public or charter school if the student switched schools. I normalize current and prior scores separately.
32
lunch status, a proxy for household income, as the types of households. To take equation (5) to the data, I first collect the endogenous enrollments on the left hand side:
Dzit= ˜Dz(µit,x−j(zi)t, x z
j(i)t, a−it, µ−it) (13)
In re-writing the equation this way, peer spillovers are captured by dependence of a given household type’s enrollment on the market size for other type households, contained in vector x−j(zi)t where the subscript j(i) indicates that charter i is located in j. This dependence is in addition to the market size of the “own” type (e.g. the enrollment of Hispanic students depends on the population of Hispanics and the Asian population), represented by xz
j(i)t.
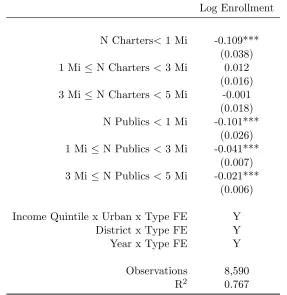
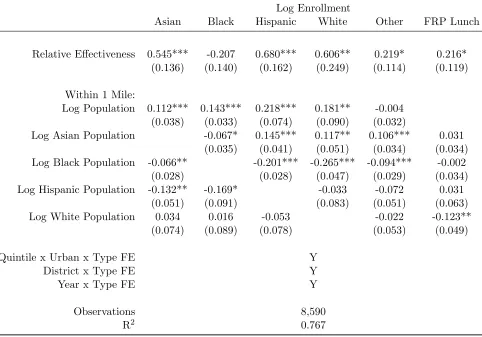
To capture spatial competition, I then bin counts of nearby charter and public schools into mutually-exclusive distance bands centered around each school’s location, while conditioning on charter school effectiveness and location characteristics. The equation I estimate is given by:
log(Ditz+ 1) =αZ(µit−µ¯Pj(i)t) +̺zxzj(i)t+̺−zx−j(zi)t+X
d
γcdN Cjd(i)t+X
d
γpdN Pjd(i)t+πzj(i)t+ǫzit (14)
N Cd
j(i)t and N Pjd(i)t represent the number of charter and public schools, respectively, in distance
banddfrom charter schooli’s location at timet. Theγ parameters are thus interpretable as semi-elasticities of enrollment with respect to an additional competitor (public or charter) in a given distance band. I use three distance bands in the estimation: within one mile, between one and three miles, and between three and five miles. For the sizes of the local market by household type, which enter xz
j(i)t or x
−z
j(i)t, I similarly include the logged school aged population of each demographic
group within the one, three, and five mile distance bands.
Demand also depends on charter school i’s effectiveness relative to effectiveness of public schools nearby locationj, given byµit−µ¯P
j(i)t in equation (14). For the latter term, I compute the average
effectiveness of public schools within five miles. As a result,αz, which I allow to be heterogeneous
There are two major identification concerns in estimating equation (14). First, the number of competing charter schools nearby, which enters on the right hand side, is a function of school i’s supply decision, potentially leading to simultaneity bias. The spatial nature of competition, how-ever, provides sources of exogenous variation in competitors’ supply choices. To take an illustrative example, while the influence of market characteristics on charter schooli’s enrollment is bounded at five miles, the choice of an incumbent competitor located five miles away fromiwill be influenced by the presence of public schools (and cost conditions) beyond five miles from i. More generally, the location choices of potential entrants will be influenced by the presence of public schools (and incumbent charters) and cost conditions across the entire school district, while only local character-istics directly affecti’s enrollment. In addition, it is instructive to consider the implications of any simultaneity bias for the estimates. Simultaneity would lead to overestimates of the competitive effects (i.e. more negativeγs). In terms of recovering how charter schools choose among locations, if profits are increasing in enrollment, such bias would then translate into underestimates of charter schools’ responsiveness to financial incentives. This in turn implies that the results reported for the impact of the flat funding formula on inequity would be a lower bound.
The second identification concern stems from market characteristics that may be unobserved. This omitted variable bias, such as unobserved characteristics of locations that may reduce fixed costs and thereby produce agglomeration of schools, is likely to attenuate the estimates of γ towards zero (or even make them positive). As a result, in estimating (14), I include income quintile-by-urban-by-household type, district-by-type, and year-by-type fixed effects, represented by πz
j(i)t,
in addition to the observed market characteristics in xz
j(i)t and x
−z
j(i)t. Intuitively, this identifies
5.1.3 Variable Costs
To estimate the variable costs of charter school operation, I combine the recovered estimates of charter school effectiveness with the panel of expenditures, student compositions, and location characteristics. As described earlier, the variable cost function embeds cost differences across student populations.
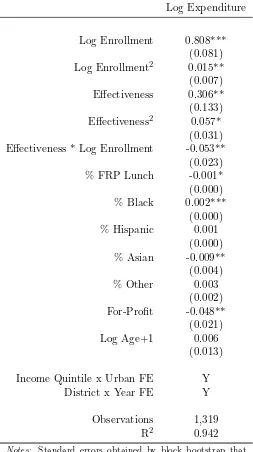
The specification I estimate is given by:
logV Cit =κT(logDit, µit) +λZit+ηxCj(i)t+ǫit (15)
The dependent variable in this equation is the reported total expenditure of charter schooliduring school year t, which depends on enrollment, effectiveness, student composition Zit, and
charac-teristics of the location, xC
j(i)t.33 The location characteristics I include in the estimation include
income quintile-urban and district-year intercepts. To allow for possible nonlinearities, such as a quantity-quality tradeoff, I specifiy T(logDit, µit) by a quadratic polynomial (akin to a translog)
in log enrollment and effectiveness.
Cost estimation in education settings is subject to a number of endogeneity concerns (Costrell et al., 2008; Duncombe and Yinger, 2011; Gronberg et al., 2011). For example, effectiveness or quality of education is often poorly measured due to non-random sorting of students across schools. By estimating the education production (12) in a first stage, however, I obtain a measure of effectiveness identified by residual student achievement growth. As a result, the cost estimates obtained from equation (15) implicitly condition on students’ unobserved prior inputs into education.34
Nonetheless, unobserved differences across schools in allocative efficiency may confound naive re-gressions of expenditure on measures of outcomes and student characteristics. In this case, the error term in (15) can be decomposed into an efficiency term and measurement error:
ǫit=uit+ζit
33
In addition to the student compositions endogenized by the model (demographics and subsidized lunch status), I also control for the share of gifted, special education, and English language learner students in the cost estimation.
34
If efficiency in input usage, represented byuit, is correlated with effectiveness or enrollment, then ordinary least squares estimates will be subject to omitted variable bias.35 Teacher salary schedules, bureaucracy, and rent-seeking are likely sources of allocative inefficiency in public school districts. While the more competitive charter school market may lessen some of this worry, I also assume that any allocative inefficiency across charter schools is fully captured by the age and profit status of a charter school. I therefore include these as additional controls when estimating equation (15).
5.2 Entry Game
Estimating how charter schools respond to incentives relies on pairing the offline estimates of demand and variable costs with the logic of revealed preference in the entry game. This requires placing a functional form on the latent utility function of charter schools and a distributional assumption on the choice shocks. In this subsection, I also discuss the sources of identifying variation of the entry game parameters in the presence of unobserved market heterogeneity. Given the computational burden required to solve the game, I implement a modified two-step approach for estimation, described below.
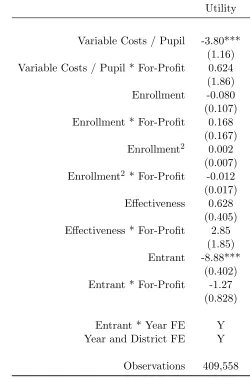
I specify charter schools’ utility as quasi-linear in net income per pupil:
Uij(st) =θiΠij(st)/Dij(st) +gi(Dij(st), µit) (16)
θitherefore represents the marginal utility of net income per pupil and governs how charter schools respond to financial incentives. On the other hand, gi represents how, whether for altruistic or
other reasons, charter schools may value enrollment and effectiveness independently. Using the equation for profit, I re-write (16) as follows:
Uij(st) =θi(τtDij(st)−V Cij(st)−F Cjt)/Dij(st) +gi(Dij(st), µit)
=θi(τt−V Cij(st)/Dij(st)−F Cjt/Dij(st)) +gi(Dij(st), µit)
=θi(τt−V Cij(st)/Dij(st)) + ˜gi(F Cjt, Dij(st), µit) (17)
35
The cost estimation literature typically models unobserveduitusing parametric distributional assumptions. See
This expression is useful for considering the potential sources of variation in the data that identify
θi, the key parameter of interest for the purpose of conducting counterfactuals. For instance, the rearrangement in the last equation reflects that if fixed costs,F Cjt, are parameterized by a linear
index of location characteristics (including at least a constant), those parameters are just scaled byθi. Moreover, variation in demand will only help identifyθi to the extent it shifts variable costs
per pupil due to any scale economies.
Instead, consider the difference in expected utility for a potential entrant ichoosing between loca-tionsj and j′:
E[Uij(st)]−E[Uij′(st)] =θi(τt−E[V Cij(st)/Dij(st)]) +E[˜gi(F Cjt, Dij(st), µit)]
−θi(τt−E[V Cij′(st)/Dij′(st))] +E[˜gi(F Cj′t, Dij′(st), µit)]
=θi(−E[V Cij(st)/Dij(st)] +E[V Cij′(st)/Dij′(st)])
+E[˜gi(F Cjt, Dij(st), µit)]−E[˜gi(F Cj′t, Dij′(st), µit)]
Across the locations, the above reveals that the per-pupil funding rate τt is constant and thus drops out of the comparison. As a result,θi is informed by revealed preference over locations: the sensitivity of charter schools’ location choices to expected variable cost differences (all else held equal). Potentially, however, the per-pupil funding rate τt can inform the identification ofθi from the decision of a potential entrant to enter (vs. staying out of the market altogether) or of an incumbent to continue in operation. Consider the latter choice in expected utility terms:
E[Uij(st)]−E[Ui0(st)] =θi(τt−E[V Cij(st)/Dij(st)]) +E[˜gi(F Cjt, Dij(st), µit)] (18)
The expected utility of exiting, denoted as alternative 0, is normalized to 0, so the comparison resolves to evaluating whether the expected utility of remaining in operation in locationjis positive. As can be seen, the statutory funding rate, τt, like expected costs per pupil, therefore informs the identification of θi through revealed preference by shifting the expected profits of continued
operation.
How-ever, it is important to consider the presence of unobserved heterogeneity, which can create omitted variable bias and is a principal focus in the empirical games literature (Seim, 2006). In this context, market-level unobservables, which I denote byξt, also limit the variation for identifyingθi. To see
this, consider again the incumbent decision, but now incorporating unobserved heterogeneity:
E[Uij(st)]−E[Ui0(st)] =θi(τt−E[V Cij(st)/Dij(st)]) +E[˜gi(F Cjt, Dij(st), µit)] +ξt
The expression makes clear thatξtis collinear with the statutory funding rate,τt. As a result, taking
unobserved heterogeneity seriously in the estimation absorbs this potential source of variation in the data, leaving only expected variable costs per pupil to identify θi. This highlights the importance
of the expenditure data used to estimate variable costs offline.
As I observe multiple school districts for each time period, I capture the unobserved market-level heterogeneity in the estimation by including year and district fixed effects. Because the parameters that enter ˜gare not of direct interest in the analysis, I flexibly specify this function with a quadratic polynomial in enrollment and the urban and income quintile intercepts and demographic shares of the one mile radius surrounding each location. As mentioned earlier, I also allowθi and ˜gi to vary by whether a charter is for-profit managed, allowing for the sensitivity to expected costs per pupil (versus other determinants) to depend on a charter school’s profit status. Entry costs are similarly allowed to vary with profit status.
I assume that the private information draws in (8) and (9) are distributed i.i.d. type I extreme value. This assumption produces familiar closed-form expressions for the probability of continu-ing for incumbents (which I superscript by I) and for choosing a location for potential entrants (supercripted E). These are given by
PijI(st) =
exp (˜uij(st,Pt))
1 + exp (˜uij(st,Pt))
(19)
PijE(st) =
exp (−ECit+ ˜uij(st,Pt))
1 +Pjexp (−ECit+ ˜uij(st,Pt))
(20)
There are two primary approaches for dealing with the equilibrium structure of this system of equations. The nested fixed point approach, adapted from Rust (1987), requires solving the game for all equilibria for every parameter guess to evaluate the likelihood. Due to heterogeneity across charter schools and the large set of locations (for example, there are nearly 350 Census tracts in Miami-Dade), this approach is computationally prohibitive. For this reason, I adopt a two-step approach based on insights from Hotz and Miller (1993) that semi-parametrically recovers conditional choice probabilities of entry location and exit, ˆPt, in a first step. The second step then
uses the choice probabilities as estimates of charter schools’ beliefs to calculate ˜uij(st,Pˆt) offline
using simulation. This two-step approach, which conditions estimation on the equilibrium played in the data, is also more robust to possible multiplicity of equilibria.36
I estimate the model by pooling the 26 school districts in Florida with at least 3 total charter school entries during the sample. A potential entrant’s choice set consists of all Census tracts in their assigned school district.37 As the demand model (5) overdetermines total enrollment, I use the predicted enrollment of the five mutually exclusive demographic groups (Asian, black, Hispanic, other, white) to predict total enrollment in each location and require predicted enrollment to be at least one while capping the subsidized lunch share at one. For the first stage, I estimate a multinomial logit with a flexible polynomial in the state variables that includes district and year fixed effects. Finally, an entrant’s initial effectiveness is drawn from the empirical distribution of
µ1i, which I discretize.
6
Results
This section presents the estimates of the empirical model and results of the counterfactual exercises. In the first subsection, I present the parameter estimates of the offline functions and from the entry game. As successive estimation steps use estimates obtained from prior ones, I compute standard errors using a block bootstrap that samples markets (district-years) with replacement. To assess goodness-of-fit, I then simulate the empirical model. Finally, I examine three counterfactual policy
36
Bajari et al. (2010) apply the two-step estimator to a static game. Two-step estimators have been extended to the estimation of dynamic games (Aguirregabiria and Mira, 2007; Bajari et al., 2007; Pakes et al., 2007).
37