Munich Personal RePEc Archive
The Effect of Information on Financial
Markets: A Survey
Chouliaras, Andreas
Luxembourg School of Finance
17 May 2016
Online at
https://mpra.ub.uni-muenchen.de/71426/
The Effect of Information on Financial Markets: A Survey
Andreas Chouliaras∗
Luxembourg School of Finance∗∗
Abstract
Researchers in finance have since long ago been attempting to quantify information, and assess its impact on financial markets. Recent advances in computational linguistics, natural language processing, machine learning and econometrics, along with improved data access to media arti-cles, online discussions and social networks, have enabled researchers to apply such techniques in multiple fields of financial research. The applications include (but are not limited to): the effect of media columns and online discussions on stock prices, the relationship between media coverage and institutional trading, the effect of media during mergers and acquisitions (M&As), and initial public offerings (IPOs). The paper surveys a key part of the literature, and discusses possibilities for further research.
JEL classification: G10, G14.
Keywords: Information, Financial Markets, Textual Analysis, News, Media.
In the 1970’s we saw the rise of Wall Street quantitative analysts. Then came program trading. Perhaps computational linguistics and textual data mining will become the new hot technologies in financial economics.
Hal R. Varian, Sept. 23, 2004, ”Good Stock Advice or Online Noise?”, New York Times
1.
Introduction
Since decades, researchers have been trying to analyse sources of information, and associate the
content of information to financial returns. One of the first studies in this topic is Niederhoffer (1971),
which analyses ”world events”, i.e. events that were ”significant” enough for the New York Times to
cover them with using a five to eight column headline. The author uses untrained observers to classify
the headlines into twenty categories, using a good/bad scale with seven points. The most interesting
finding of this paper is that ”large changes” in the stock market are much more likely following ”world
events” than on random days. The paper ends with the author saying ”I hope that this study will
stimulate other quantitative research on the effect of information on markets.”
Indeed, a lot of papers in the following years tried to quantify the impact of information on financial
markets: in one of them, Mitchell and Mulherin (1994) analyse the number of daily Dow Jones news
and associate these to trading volume and stock market returns. The vast majority of the studies
between 1970 and the early 2000s, used rought and unprocessed proxies to quantify information, such
as a simple count of the number of news. It was not until Antweiler and Frank (2004) that researchers
attempted to programmatically quantify the content of information. This paper uses computational
linguistics techniques - more specifically, the Naive Bayes algorithm, to quantify the content of online
board messages, and classify them as bullish or bearish1
. The authors study the messages posted in
two message boards that were quite popular in the beginning of 2000s: Yahoo! Finance and Raging
Bull. This paper drew quite a lot of attention, with the New York Times asking Professor Hal Varian
to write an editorial on the topic2
. By then, it was quite clear that the field of textual analysis
1
The authors used a software package that was developed in the Carnegie Mellon University (CMU), under the project name Rainbow, which can be found athttp://www.cs.cmu.edu/~mccallum/bow/rainbow/
2
would become rather popular in Finance, with Hal Varian writing ”in the 1970’s we saw the rise of
Wall Street quantitative analysts. Then came program trading. Perhaps computational linguistics and
textual data mining will become the new hot technologies in financial economics.”.
A major breakthrough in the field of textual analysis came in 2007, with the publication of Tetlock
(2007): the author quantified the content of a particularly famous financial column (”Abreast of the
Market”) of the Wall Street Journal3
. This seminal paper quantifies the content of media articles using
the Harvard IV-4 psychosocial dictionary4
, which is used in the General Inquirer content analysis
software5
. The paper was a big success, with the author winning the First Prize, Amundi Smith
Breeden Prize of the Journal of Finance6
. It is worth noting that the General Inquirer was developed
in the beginning of the 1960s (Stone, Bales, Namenwirth, and Ogilvie (1962), Stone, Dunphy, and
Smith (1966)), which means that -quite surprisingly- it took researchers in finance over 40 years to
realise how useful such tools can be for Finance research7
.
Since then, the field of textual analysis in finance took off, with multiple papers being written
attempting to exploit these new computational tools, and to study the effect of information on financial
markets under a new perspective. Another big breakthrough in the field was the publication of
Loughran and McDonald (2011), who report that 73.8% of words classified as negative in the Harvard
IV-4 dictionary, are not necessarily negative in a financial piece of text. Such words include the words
”tax, cost, capital, vice”. The authors fine tune the Harvard IV-4 dictionary, keeping the words that
are relevant to finance, and classify words in a series of word lists (Negative, Positive, Uncertainty,
Litigious, Constraining, Superfluous, Interesting, Modal)8
.
Another interesting approach to quantify textual sentiment is presented in Jegadeesh and Wu
(2013): the authors collapse the positive and negative words from the Loughran and McDonald (2011)
word lists (LM), keeping one word for every different inflection. The initial LM list contains 353
3
http://www.wsj.com/news/types/abreast-of-the-market. The column used to be written on a daily basis when
the Tetlock (2007) paper was published, but is now written on a weekly basis
4
http://www.wjh.harvard.edu/ inquirer/homecat.htm
5
http://www.wjh.harvard.edu/~inquirer/ 6
http://www.afajof.org/details/page/2870731/Prizes.html 7
To the best of my knowledge, Tetlock (2007) is the first study in finance to use the General Inquirer
8
positive words and 2337 negative words, which are brought down to 123 positive and 718 negative
words using the Jegadeesh and Wu (2013) approach. Instead of manually classifying words in positive
and negative categories, they use 10-K (US listed firms annual reports) filing returns to obtain a
”score” for every word separately. This is based on a weighting scheme that calculates the number
of of documents in which every word occurs, taking into account the (abnormal) stock returns that
occurred during the release of the filing that contained the specific word(s). Another application of
textual analysis on annual reports is proposed in Chouliaras (2015b) which associates 10-K returns
with the previous period stock market return of the firm.
Finally, a recent trend in the finance research, makes use of machine learning techniques. One of
these techniques, deals with topic detection. One the most widely used algorithm in this field was
proposed in Blei, Ng, and Jordan (2003), and is called ”Latent Dirichlet Allocation” (LDA). This
approach sees documents as a collection of topics, and depending on which words are used in the text,
it statistically associates a given piece of text with a topic. One of the papers in finance that use the
LDA algorithm is Hoberg and Lewis (2015) who study the Management’s Discussion and Analysis
(MD&A) section of 10-Ks to see how similar the topics of firms that commit fraud are.
This survey paper is organized as follows: Section 2 presents the data that have been used in
previous studies as far as the information data sources and the financial data sources are concerned.
Section 3 presents a few studies that have used the raw count of news as a proxy for information, and
possibilities for further research quantifying the content of such news. Section 4 discusses a few papers
that study the effect of information on institutional investors’ trading behavior. Section 5 presents
how some studies were able to obtain the relevant news. Section 6 presents some causal evidence of
the effect of news on financial markets. Section 7 discusses a few possibilities for further research on
2.
Data sources used to study the effect of information on financial
markets
2.1. News media sources
Niederhoffer (1971), being the first paper (to the best of my knowledge) to study the effects of
information on financial markets, used the headlines of the New York Times as the source of news
articles. Mitchell and Mulherin (1994) uses the Dow Jones announcements (known as the ”Broadtape”)
and the Wall Street Journal articles. Antweiler and Frank (2004) uses the Yahoo! Finance and the
Ragingbull.com online message boards. Fang and Peress (2009) and Fang, Peress, and Zheng (2014))
use major US newspapers articles provided by the LexisNexis platform. Another popular source of
news has been the Dow Jones Factiva database. This news database has been used in quite a few of
the studies, such as Tetlock, Saar-Tsechansky, and Macskassy (2008). A newspaper database that has
been used much less is the Proquest Historical Newspapers database, used in Engelberg and Parsons
(2011).
2.2. Financial data sources
As far as the financial data are concerned, these are typically obtained from the Wharton Research
Data Services (WRDS) for the Dow Jones Industrial Average index returns (Tetlock (2007)). Stock
price data are obtained from the Center for Research on Security Prices (CRSP), while analyst forecasts
are typically the ones provided by the Institutional Brokers’ Estimate System (I/B/E/S). Accounting
information data are usually obtained from Compustat (Tetlock et al. (2008)).
3.
Count (number) of news as a metric of information
Even though most of the recent studies have focused on quantifying the content of news in order
to examine its impact on financial markets, a part of the literature has mainly used the number of
news as a metric of information. For example, Fang and Peress (2009) use a sample of all NYSE
news articles from four major US newspapers (New York Times, USA Today, Wall Street Journal and
Washington Post) from LexisNexis. The authors use the ”relevance” score of LexisNexis as a cutoff
for keeping or discarding firm-specific news, keeping articles above the 90% relevance cutoff. The
authors report that firms that are not mentioned in the media perform better than stocks that receive
frequent media attention. Quite interestingly, the authors do not examine the content of news at all.
The finding that stocks with higher media coverage outperform stocks with high media coverage is very
interesting, but it would be useful to study what the actual news say. For example, firms that severely
miss targets, report extreme losses, and/or are involved in some catastrophic incidence (such events
can be accidents like plane crashes, earthquakes and other physical catastrophes) would be expected
to receive very high media coverage. The same would be true for firms that severely beat earnings
estimates, and/or produce some major discovery or unleash a product which ends up selling very well
(for example, products such as the Apple iPhone). In a similar paper by the same authors, Fang et al.
(2014) find that mutual funds have a tendency to buy more of stocks that are mentioned quite a lot
in the media. The authors report evidence that funds that tend to buy highly media-covered stocks,
tend to underperform on a yearly basis. Once more, the authors do not perform textual analysis to
calculate the tone of articles. The authors use the stock returns and try to calculate the tone of the
articles based on whether the stock had a negative or a positive return on the day the articles were
released. For every day that a news article exists for a stock, the authors use the sign of returns to
classify the article as negative or positive. Then, they sum up the number of negative and positive
days per firm per quarter. Even though this approach is interesting, in reality it neglects the actual
content of the articles. The authors report that they did not have access to the content of articles,
but it would be very helpful to quantify the actual tone of news and then study whether the results
hold once more9
.
Another recent paper to use the count of news as a proxy of information is Engelberg, McLean,
and Pontiff (2015). The paper makes use of 97 anomalies that have been reported in the finance
9
It is not clear how LexisNexis calculate the relevance scores. Some information is provided in
https://www.lexisnexis.com/infopro/resource-centers/product_resource_centers/b/smartindexing/archive/
2013/09/06/relevance-scores-50-99.aspx and https://www.lexisnexis.com/communities/academic/w/wiki/100.
relevance-score.aspxbut not much is revealed on how the index itself is calculated. It might be interesting to study
research papers. The research question here is whether anomaly returns are different on days with
earnings announcements and on days with news. The authors report that anomaly returns are found
to be 7 times higher on earnings announcement days and 2 times higher on days with corporate news.
The authors use 489,996 earnings announcements and over 6 million Dow Jones news stories. Once
more, the authors do not actually study the content of news, and they do not study whether the firm
has beaten or missed the expectations on an earnings announcement day. The findings of this paper
seem to indicate that news and earnings announcements are channels through which new information
is released, which causes investors to change their beliefs, this is why ”anomalies” are observed.
4.
Information, textual analysis and institutional investors
An area of research in finance that has not adequately been explored from the current papers is
how do institutional investors use information to invest on financial markets. Apart from Fang et al.
(2014) which uses the number of firm-specific news as a proxy for information, not many other studies
have attempted to provide such a connection. An exception is Solomon, Soltes, and Sosyura (2014)
who finds that fund holdings with high returns in the previous period affect higher flows, but only
if the mentioned stocks have also received media attention in the previous period. Finally, another
paper that studies the effect of information on institutional trading is Chouliaras (2015a), a paper
which associates 10-K textual analysis tone with insitutional holdings (via 13-F filings) and analysts’
recommendations. Overall, the effect of information on institutional investors’ trading has not been
thoroughly examined in the current literature.
5.
Techniques to keep relevant news
An interesting question that does not have a common answer in the research literature is how
should one keep relevant news? Different papers have used different approaches to tackle this issue.
For example, Tetlock et al. (2008) uses over 350,000 firm specific news stories which are retrieved
The authors use stories that refer to S&P firms and require that the story mentions the name of the
firm at least once in the first 25 words. On top of that, the authors require the name of the firm to
be at least twice mentioned in the full content of the article. Furthermore, the authors keep stories
that have at least 50 words, at least 5 of which must belong to the ”Positive” or ”Negative” word
lists. 3 of these 5 positive or negative words must be unique. A similar approach is followed by
Chen, De, Hu, and Hwang (2014): they require the CRSP company name to show up at least once
in the first 50 words of the Dow Jones News Services (DJNS) articles. The authors acknowledge that
this process is not perfect because many times the name of subsidiaries are mentioned instead of the
holding company (e.g. Cadbury instead of Kraft Foods), or the product is mentioned instead of the
company (e.g. Camry instead of Toyota). The problem of picking up relevant stories appears mostly
for papers that use the Dow Jones Newswires as the news source. On the other hand, stories that use
LexisNexis do not appear to have this problem, since LexisNexis provides a relevance score for each
story, and researchers can keep news articles above a certain cutoff (90% is used in Fang and Peress
(2009) and Fang et al. (2014)). Chen et al. (2014) obtain online ”opinions” and comments from the
website Seeking Alpha (seekingalpha.com) using the relevant stock tickers provided by the website.
Another approach to select relevant news, is through the use of keywords (in the title and the content
of news articles), as has been used in Chouliaras and Grammatikos (2015).
6.
The causal impact of media on financial markets
The majority of research studies in finance exhibit correlations between media articles and the
stock markets. In some cases, researchers attempt to exhibit acausal link among the two. In one of
these studies, Engelberg and Parsons (2011) were able to obtain trading data from a large discount
brokerage database. This way they were able to associatelocal trading with the media coverage bylocal
media. They find that local media coverage of an earnings announcement, strongly affects whether
local trading occurs, as well as its magnitude, establishing a causal relationship between the media
financial markets is Dougal, Engelberg, Garcia, and Parsons (2012)10
. The authors fixed effects for
different journalists on daily regressions of the Dow Jones Industrial Average (DJIA) stock index. The
financial column they study is the Wall Street Journal’s ”Abreast of the Market” (AOTM) column11
.
The exogenous variation comes from the rotations of financial journalists. Journalists’ personal writing
styles (captured by their fixed effects) are able to explain daily stock returns to a large extent, being
evidence of a causal link between the media and financial markets.
7.
Future directions for Textual Sentiment Analysis
The approaches that are based on financial dictionaries appear to be working quite well, and have
found a lot of applications in the financial domain. These approaches started off from the use of
General Inquirer in Tetlock (2007), and have led to the creation of specialised financial word lists
in Loughran and McDonald (2011). Even though these approaches do not perfectly capture the
tone of text, they appear to be working quite well. Yet, obstacles remain, that have to do with the
grammatical syntax of text, the weighting of words (most current approaches place equal weights to
negative/positive words), how should one deal with negators (Jegadeesh and Wu (2013) report that not
counting positive/negative words within three words of a negator appears to increase the performance
of their models). Perhaps a way forward would be to combine techniques developed in other fields,
such as Computer Science, to see if the current finance sentiment metrics can be further improved. For
example, a very popular sentiment analysis implementation is the Python Natural Language Toolkit
(NLTK) platform12
. The Python NLTK uses techniques that actually take into account the content
of sentences and their grammatical/syntactical structure. The drawbacks of such tools is that they
are usually constructed using corpora such as customer reviews13
and movie reviews14
. In a finance
setting, such classifications may not be very powerful (Chouliaras (2015c)). A hybrid approach, one
that uses tools such as Python NLTK, but combines them with word lists relevant to finance, such as
10
Michael J. Brennan Best Paper Award, Review of Financial Studies, 2013: http://rfssfs.org/awards/ 11
the same column has been used by Tetlock (2007)
12
http://www.nltk.org/
13
http://www.nltk.org/_modules/nltk/corpus/reader/reviews.html 14
Loughran and McDonald (2011), might prove to perform better.
One way to view the big picture of the field is that five interacting entities provide and receive
information from (and to) one another: analysts, firms, institutions retail investors and the media.
The analysts provide recommendations through their buy, sell recommendations as well as their target
prices. Firms provide information through their corporate filings, press conferences and interviews.
Institutions provide information through their trading behavior and possible interventions they make
(in the case of activist investors, but also in the case of letters to investors). The media provide
information through articles, through interviews, and generally through the information they release.
The information that each of these entities provides, is the information that the other entities receive
(and vice versa). The question that emerges is how does information from and to each of these
entities affect the other entities: do subgroups exist, such that they outperform their peers (star
analysts, star fund managers)? Is this outperformance related to a better/faster access (processing,
interpretation) of information signals? Investors have storng incentives to invest heavily in information
processing mechanisms, which can allow them to profit in financial markets. Analysing the cross
section of investors is not sufficient: there exists significant heterogeneity between different classes of
investors (mutual funds, hedge funds, high frequency traders, algorithmic traders, et cetera). Does
the information processing capacity of these investors play a role in their behavior (and ultimately
success or failure in the financial markets? Does investing in IT infrastructure and state of the art
technology, hiring people from top universities, with top grades, top publications, PhD degrees and
so on also play a role? What role do network effects play? Such networks could be LinkedIn networks
(or other social media networks such as Twitter and Facebook), studying at the same university at
the same time/program, having graduated from the same school might significantly affect investment
decisions (friends might chat and influence each other’s decision making).
8.
Conclusion
The field of financial research that studies the effect of information on financial markets has
”good” or ”bad”, researchers were able to automatically quantify the content of informational sources.
Fields that this type of research has been applied recently include media articles (Tetlock (2007), Garcia
(2013)), quarterly earnings (Tetlock et al. (2008)), annual reports (Loughran and McDonald (2011)),
institutional investors trading (Solomon et al. (2014)), the study of financial anomalies (Engelberg
et al. (2015), Hillert, Jacobs, and M¨uller (2014)), mergers and acquisitions (M&As) negotiations
(Ahern and Sosyura (2014), Ahern and Sosyura (2015)).
The field has evolved from the use of agents classifying the headlines of articles (Niederhoffer
(1971)) to the use of psychosocial dictionaries (Tetlock (2007)) which were later fine tuned to develop
financial word lists (Loughran and McDonald (2011)). Other techniques used include computationally
comparing the similarity of pieces of text (Hanley and Hoberg (2010). Moving forward, researchers
are starting to use tools developed in computer science and machine learning, such as topic modeling
techniques (Latent Dirichlet Allocation - LDA) (Hoberg and Lewis (2015)). There is a lot of room
for further research on this field. One thing is certain: looking backwards, Niederhoffer (1971) was
definitely right when he was saying ”I hope that this study will stimulate other quantitative research
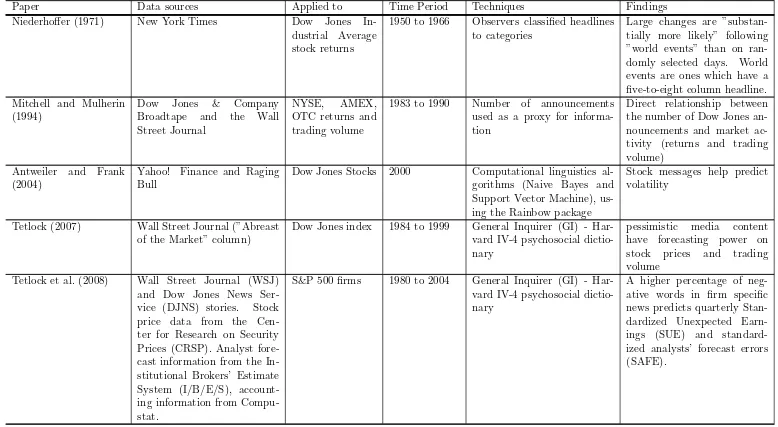
Table 1: Summary table for papers, data sources, techniques, time periods and findings
Paper Data sources Applied to Time Period Techniques Findings Niederhoffer (1971) New York Times Dow Jones
In-dustrial Average stock returns
1950 to 1966 Observers classified headlines to categories
Large changes are ”substan-tially more likely” following ”world events” than on ran-domly selected days. World events are ones which have a five-to-eight column headline. Mitchell and Mulherin
(1994)
Dow Jones & Company Broadtape and the Wall Street Journal
NYSE, AMEX, OTC returns and trading volume
1983 to 1990 Number of announcements used as a proxy for informa-tion
Direct relationship between the number of Dow Jones an-nouncements and market ac-tivity (returns and trading volume)
Antweiler and Frank (2004)
Yahoo! Finance and Raging Bull
Dow Jones Stocks 2000 Computational linguistics al-gorithms (Naive Bayes and Support Vector Machine), us-ing the Rainbow package
Stock messages help predict volatility
Tetlock (2007) Wall Street Journal (”Abreast of the Market” column)
Dow Jones index 1984 to 1999 General Inquirer (GI) - Har-vard IV-4 psychosocial dictio-nary
pessimistic media content have forecasting power on stock prices and trading volume
Tetlock et al. (2008) Wall Street Journal (WSJ) and Dow Jones News Ser-vice (DJNS) stories. Stock price data from the Cen-ter for Research on Security Prices (CRSP). Analyst fore-cast information from the In-stitutional Brokers’ Estimate System (I/B/E/S), account-ing information from Compu-stat.
S&P 500 firms 1980 to 2004 General Inquirer (GI) - Har-vard IV-4 psychosocial dictio-nary
A higher percentage of neg-ative words in firm specific news predicts quarterly Stan-dardized Unexpected Earn-ings (SUE) and standard-ized analysts’ forecast errors (SAFE).
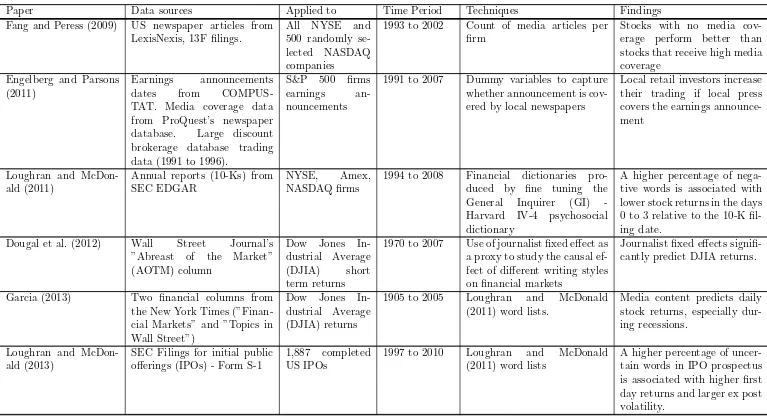
Table 1: Summary table for papers, data sources, techniques, time periods and findings
Paper Data sources Applied to Time Period Techniques Findings Fang and Peress (2009) US newspaper articles from
LexisNexis, 13F filings.
All NYSE and 500 randomly se-lected NASDAQ companies
1993 to 2002 Count of media articles per firm
Stocks with no media cov-erage perform better than stocks that receive high media coverage
Engelberg and Parsons (2011)
Earnings announcements dates from COMPUS-TAT. Media coverage data from ProQuest’s newspaper database. Large discount brokerage database trading data (1991 to 1996).
S&P 500 firms earnings an-nouncements
1991 to 2007 Dummy variables to capture whether announcement is cov-ered by local newspapers
Local retail investors increase their trading if local press covers the earnings announce-ment
Loughran and McDon-ald (2011)
Annual reports (10-Ks) from SEC EDGAR
NYSE, Amex, NASDAQ firms
1994 to 2008 Financial dictionaries pro-duced by fine tuning the General Inquirer (GI) -Harvard IV-4 psychosocial dictionary
A higher percentage of nega-tive words is associated with lower stock returns in the days 0 to 3 relative to the 10-K fil-ing date.
Dougal et al. (2012) Wall Street Journal’s ”Abreast of the Market” (AOTM) column
Dow Jones In-dustrial Average (DJIA) short term returns
1970 to 2007 Use of journalist fixed effect as a proxy to study the causal ef-fect of different writing styles on financial markets
Journalist fixed effects signifi-cantly predict DJIA returns.
Garcia (2013) Two financial columns from the New York Times (”Finan-cial Markets” and ”Topics in Wall Street”)
Dow Jones In-dustrial Average (DJIA) returns
1905 to 2005 Loughran and McDonald (2011) word lists.
Media content predicts daily stock returns, especially dur-ing recessions.
Loughran and McDon-ald (2013)
SEC Filings for initial public offerings (IPOs) - Form S-1
1,887 completed US IPOs
1997 to 2010 Loughran and McDonald (2011) word lists
A higher percentage of uncer-tain words in IPO prospectus is associated with higher first day returns and larger ex post volatility.
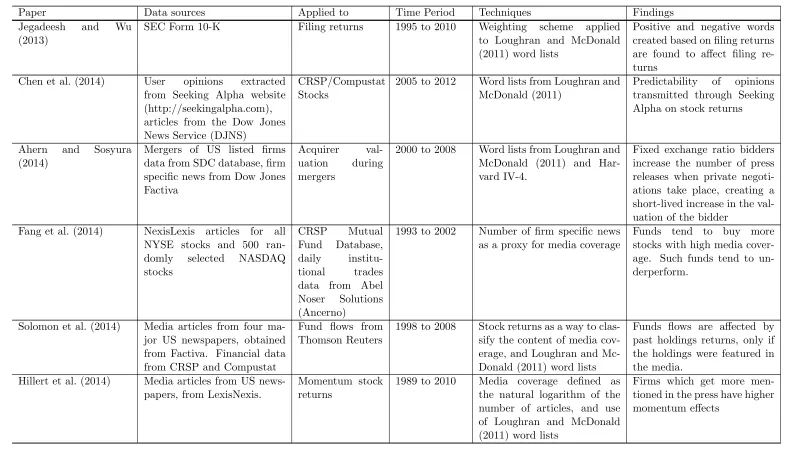
Table 1: Summary table for papers, data sources, techniques, time periods and findings
Paper Data sources Applied to Time Period Techniques Findings Jegadeesh and Wu
(2013)
SEC Form 10-K Filing returns 1995 to 2010 Weighting scheme applied to Loughran and McDonald (2011) word lists
Positive and negative words created based on filing returns are found to affect filing re-turns
Chen et al. (2014) User opinions extracted from Seeking Alpha website (http://seekingalpha.com), articles from the Dow Jones News Service (DJNS)
CRSP/Compustat Stocks
2005 to 2012 Word lists from Loughran and McDonald (2011)
Predictability of opinions transmitted through Seeking Alpha on stock returns
Ahern and Sosyura (2014)
Mergers of US listed firms data from SDC database, firm specific news from Dow Jones Factiva
Acquirer val-uation during mergers
2000 to 2008 Word lists from Loughran and McDonald (2011) and Har-vard IV-4.
Fixed exchange ratio bidders increase the number of press releases when private negoti-ations take place, creating a short-lived increase in the val-uation of the bidder
Fang et al. (2014) NexisLexis articles for all NYSE stocks and 500 ran-domly selected NASDAQ stocks
CRSP Mutual Fund Database, daily institu-tional trades data from Abel Noser Solutions (Ancerno)
1993 to 2002 Number of firm specific news as a proxy for media coverage
Funds tend to buy more stocks with high media cover-age. Such funds tend to un-derperform.
Solomon et al. (2014) Media articles from four ma-jor US newspapers, obtained from Factiva. Financial data from CRSP and Compustat
Fund flows from Thomson Reuters
1998 to 2008 Stock returns as a way to clas-sify the content of media cov-erage, and Loughran and Mc-Donald (2011) word lists
Funds flows are affected by past holdings returns, only if the holdings were featured in the media.
Hillert et al. (2014) Media articles from US news-papers, from LexisNexis.
Momentum stock returns
1989 to 2010 Media coverage defined as the natural logarithm of the number of articles, and use of Loughran and McDonald (2011) word lists
Firms which get more men-tioned in the press have higher momentum effects
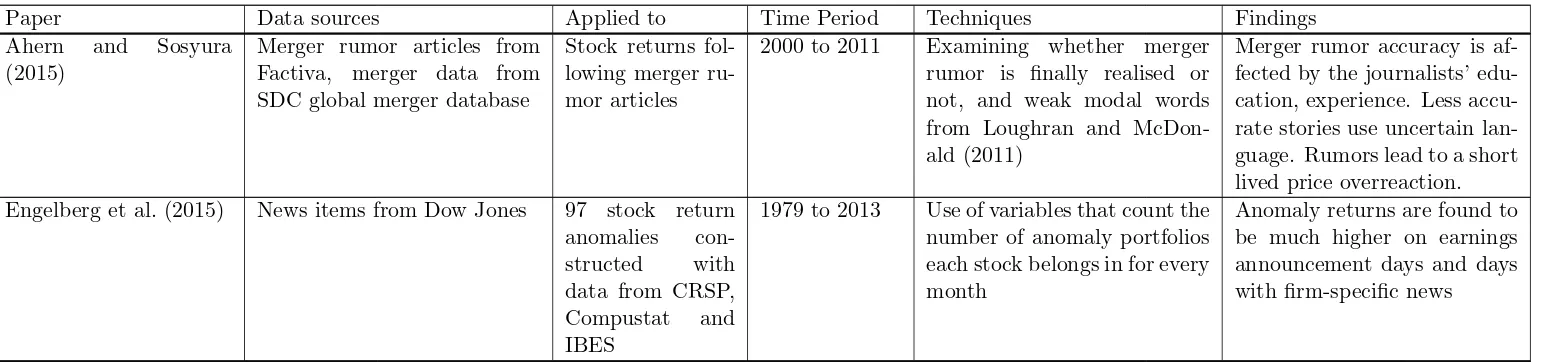
Table 1: Summary table for papers, data sources, techniques, time periods and findings
Paper Data sources Applied to Time Period Techniques Findings Ahern and Sosyura
(2015)
Merger rumor articles from Factiva, merger data from SDC global merger database
Stock returns fol-lowing merger ru-mor articles
2000 to 2011 Examining whether merger rumor is finally realised or not, and weak modal words from Loughran and McDon-ald (2011)
Merger rumor accuracy is af-fected by the journalists’ edu-cation, experience. Less accu-rate stories use uncertain lan-guage. Rumors lead to a short lived price overreaction. Engelberg et al. (2015) News items from Dow Jones 97 stock return
anomalies con-structed with data from CRSP, Compustat and IBES
1979 to 2013 Use of variables that count the number of anomaly portfolios each stock belongs in for every month
Anomaly returns are found to be much higher on earnings announcement days and days with firm-specific news
References
Ahern, K. R., Sosyura, D., 2014. Who writes the news? corporate press releases during merger
negotiations. The Journal of Finance 69, 241–291.
Ahern, K. R., Sosyura, D., 2015. Rumor has it: Sensationalism in financial media. Review of Financial
Studies p. hhv006.
Antweiler, W., Frank, M. Z., 2004. Is all that talk just noise? the information content of internet stock
message boards. The Journal of Finance 59, 1259–1294.
Blei, D. M., Ng, A. Y., Jordan, M. I., 2003. Latent dirichlet allocation. the Journal of machine Learning
research 3, 993–1022.
Chen, H., De, P., Hu, Y. J., Hwang, B.-H., 2014. Wisdom of crowds: The value of stock opinions
transmitted through social media. Review of Financial Studies 27, 1367–1403.
Chouliaras, A., 2015a. Institutional investors, analysts’ recommendations, annual reports, textual
analysis and stock returns: Evidence from sec edgar 10-k and 13-f forms .
Chouliaras, A., 2015b. The pessimism factor: Sec edgar form 10-k textual analysis and stock returns .
Chouliaras, A., Grammatikos, T., 2015. News flow, web attention and extreme returns in the european
financial crisis .
Chouliaras, A. S., 2015c. High frequency newswire textual sentiment: Evidence from international
stock markets during the european financial crisis. Available at SSRN 2572597 .
Dougal, C., Engelberg, J., Garcia, D., Parsons, C. A., 2012. Journalists and the stock market. Review
of Financial Studies 25, 639–679.
Engelberg, J., McLean, R. D., Pontiff, J., 2015. Anomalies and news. Available at SSRN .
Engelberg, J. E., Parsons, C. A., 2011. The causal impact of media in financial markets. The Journal
Fang, L., Peress, J., 2009. Media coverage and the cross-section of stock returns. The Journal of
Finance 64, 2023–2052.
Fang, L. H., Peress, J., Zheng, L., 2014. Does media coverage of stocks affect mutual funds’ trading
and performance? Review of Financial Studies 27, 3441–3466.
Garcia, D., 2013. Sentiment during recessions. The Journal of Finance 68, 1267–1300.
Hanley, K. W., Hoberg, G., 2010. The information content of ipo prospectuses. Review of Financial
Studies 23, 2821–2864.
Hillert, A., Jacobs, H., M¨uller, S., 2014. Media makes momentum. Review of Financial Studies p.
hhu061.
Hoberg, G., Lewis, C. M., 2015. Do fraudulent firms produce abnormal disclosure? Vanderbilt Owen
Graduate School of Management Research Paper .
Jegadeesh, N., Wu, D., 2013. Word power: A new approach for content analysis. Journal of Financial
Economics 110, 712–729.
Loughran, T., McDonald, B., 2011. When is a liability not a liability? textual analysis, dictionaries,
and 10-ks. The Journal of Finance 66, 35–65.
Loughran, T., McDonald, B., 2013. Ipo first-day returns, offer price revisions, volatility, and form s-1
language. Journal of Financial Economics .
Mitchell, M. L., Mulherin, J. H., 1994. The impact of public information on the stock market. The
Journal of Finance 49, 923–950.
Niederhoffer, V., 1971. The analysis of world events and stock prices. The Journal of Business 44,
193–219.
Solomon, D. H., Soltes, E., Sosyura, D., 2014. Winners in the spotlight: Media coverage of fund
Stone, P. J., Bales, R. F., Namenwirth, J. Z., Ogilvie, D. M., 1962. The general inquirer: A computer
system for content analysis and retrieval based on the sentence as a unit of information. Behavioral
Science 7, 484–498.
Stone, P. J., Dunphy, D. C., Smith, M. S., 1966. The general inquirer: A computer approach to content
analysis. .
Tetlock, P. C., 2007. Giving content to investor sentiment: The role of media in the stock market.
The Journal of Finance 62, 1139–1168.
Tetlock, P. C., Saar-Tsechansky, M., Macskassy, S., 2008. More than words: Quantifying language to