Influence of Current Density on the Reduction
of TiO
2in Molten Salt (CaCl
2+ CaO)
*1Keiichi Kobayashi
*2, Yuichi Oka
*3and Ryosuke O. Suzuki
Department of Materials Science, Graduate School of Engineering, Hokkaido University, Sapporo 060-8628, Japan
Titanium dioxide (TiO2) was successfully reduced at 1223 K by calcium, which was deposited due to the molten salt electrolysis of CaO
dissolved in CaCl2. The current density and the Ca concentration near the cathode were changed by varying the electrodes’ surface areas and the
distances between an anode and cathode, respectively. At the initial stage of reduction, metallic Ti powder with a lower oxygen concentration was obtained at a lower current density; in this case, most of the electrochemically deposited Ca was efficiently used for reduction. Meanwhile, at the final stage of deoxidation, Ti powder with a much lower oxygen concentration was obtained at a higher current density. In order to obtain metallic powder with a low oxygen concentration, the formed Ca should penetrate the inner part of the sintered sample.
[doi:10.2320/matertrans.MA200910]
(Received June 2, 2009; Accepted August 31, 2009; Published October 21, 2009)
Keywords: titanium oxide, reduction, current density, molten salt, calcium chloride
1. Introduction
Titanium is currently produced by the Kroll process, which consists of two reactions:1)
TiO2þ2Cl2þ2C!TiCl4þ2CO
and TiO2þ2Cl2þC!TiCl4þCO2 ð1Þ
TiCl4þ2Mg!Tiþ2MgCl2 ð2Þ
This process cannot continuously give the product because it is carried out as a batch operation. This low rate of productivity becomes a technical barrier in minimizing the production cost of titanium and the related energy consump-tion, resulting in the price of titanium being high. Although titanium has many favorable characteristics such as high strength, high corrosion resistance, and low weight, the application of titanium has been limited. A process with greater productivity and lower energy consumption is required Ono and Suzuki began work on a new titanium reduction process in the 1980s. They proposed the concept of a new smelting method that could reduce TiO2 using the reducing ability of Ca formed from electrolysis of CaO. This is now called the OS process.2–4)
The main reactions in the OS process at the cathode are
CaOþ2e¼CaþO2 ð3Þ
TiO2þ2Ca¼Tiþ2CaO ð4Þ
At the anode, the carbon electrode reacts with oxygen ions and produces carbon dioxide or carbon monoxide as
CþnO2¼nCOþ2ne ðn¼1or 2Þ ð5Þ
In other words, oxygen from titanium oxide at the cathode is converted to a gas at the anode and is removed from the furnace. Calcium produced by the molten salt electrolysis of CaO at the cathode is used as a reductant. In this process, the efficiency of Ca reaction with TiO2 is important and the
technique of keeping them in close contact is the key to obtaining lower oxygen content in titanium.
The purpose of this study is to find a guideline for the industrialization of the consecutive production of high purity Ti by the OS process. We were studied especially to provide more efficient contact of the Ca reductant with TiO2. To obtain a lower oxygen concentration in titanium in the re-duction of TiO2, the optimum current density was examined from the viewpoints of generation rate and generation site of Ca at the cathode by changing the shape of the electrode and the distance between the anode and the cathode.
2. Experimental
2.1 Experimental apparatus and procedure
A furnace, equipped with SiC heating elements, was controlled within 1 K. The current was calculated by measuring the low voltage of the leading wire from a constant power supply once every second. The supplied charge was evaluated from data on electric current.
Two different setups were used, as shown in Fig. 1. The anodes were graphite crucibles, 75 mm in diameter and 240 mm in depth, or graphite bars of 10 mm in diameter. A dense MgO crucible (90 mm in diameter and 200 mm in depth) was filled with approximately 600 g of anhydrous CaCl2and 1.5 g of calcined CaO so that the concentration of the molten salt became CaCl2-0.5 mol%CaO. When the graphite crucible was used, the bottom of the crucible was covered with alumina plates to prevent carbon dioxide and carbon monoxide generation. A cylindrical basket made of a titanium net (#100) was used as the cathode. The basket was filled with TiO2 powder (rutile, >99:9% in purity, <0:1mmin size).
The crucible and the electrodes were placed in the furnace and heated in a vacuum to 873 K. The furnace was maintained at this temperature for 43 ks to eliminate water present in calcium chloride. Then, molten salt was heated to 1223 K in an argon atmosphere and the electrodes were inserted into the molten salt. A constant voltage of 3.0 V, which lies between the theoretical voltages of decomposition
*1This Paper was Originally Published in Japanese in J. Japan Inst. Metals 72(2008) 916–920.
*2Graduate Student, Hokkaido University
*3Graduate Student, Hokkaido University. Present address: Kobelco Co. Ltd., Kobe, Japan
Special Issue on Low Cost Reduction Processes, Roles of Low Cost Elements and Interstitial Elements, and Microstructural Control for Generalization of Titanium Alloys
for CaCl2 (3.21 V) and CaO (1.63 V), was applied between the anode and the cathode. The experimental temperature was set at 1223 K.5)
After electrolysis at 1223 K, the electrodes were pulled off from the molten salt, and cooled in the argon atmosphere. The fouling attached to the cathode were removed by rinsing with distilled water. The sample obtained from the Ti basket was cleaned with dilute acetic acid, distilled water, ethanol, and acetone to eliminate CaO, CaCl2, and H2O, respectively. The phases in the sample were identified by X-ray diffraction (XRD) measurement and the oxygen concentra-tion in the sample was analyzed by inert gas melting—an infrared absorption method—using LECO TC500. The microstructure was observed using a scanning electron microscope (SEM).
2.2 Experimental conditions
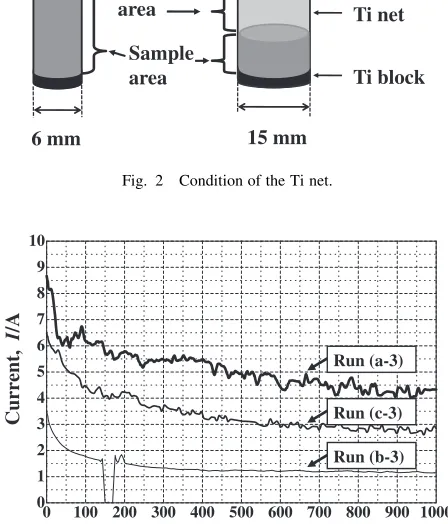
Three kinds of electrodes were used to survey the influence of the current density on the reduction/deoxidation of TiO2. The experimental conditions are listed in Table 1. In this paper, the combinations of electrodes are referred to as Methods (a)–(c). The diameter of the Ti basket was chosen as either 6 mm or 15 mm, so the baskets are referred to as ‘‘6-mm basket’’ and ‘‘15-mm basket’’, respectively. The filling level of the powderous TiO2 is illustrated in Fig. 2. Because the same amount of TiO2 powder was set in all the baskets, the level of sample in Method (a) and (b) is lower than the levels of samples in Methods (c).
The anodic surface area is defined as the surface area where the electrode came in contact with the molten salt. Although the cathodic basket was made of a doubly wound titanium flat net, the double rolling was not considered in the estimation of current density. The apparent cathodic area
was evaluated by simply assuming the smooth surface of dense cylinder. This assumption was verified at the later stage of the deoxidation, as reported later.
3. Result and Discussion
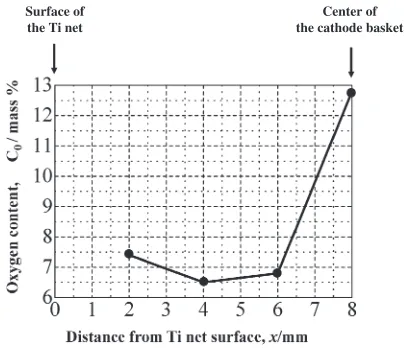
3.1 Time dependency of the current
The current at the initial stage of electrolysis (t<103s) in the three methods are shown in Fig. 3. The time dependency of current for the individual run was similar in the same Method, when the sample charge and electrode arrangements were normalized by Q0. As typically shown in Fig. 3, the current decreased in descending order in Methods (a), (c), and (b). In other words, the largest current was observed when the larger surface area of the anodic carbon crucible and the cathode was combined with the 15-mm basket. Thus, the current depended on the surface area of the electrode. It should be noted that that the zero current at 150 s in Method (b) was due to the accidental shorting of electrodes; the current returned to the original value when the electrodes were set at the correct positions.
[image:2.595.62.278.72.229.2]The supplied charge, Q, is evaluated by integrating the current with respect to time. When Q0 was defined as the theoretical charge that generates the stoichiometric amount of the Ca reductant for the reduction of the charged amount of TiO2, the ratioQ=Q0 can be used as a parameter for the Table 1 Materials and areas of three kinds of electrodes.
Anode Cathode
Material Area of
electrode(m2) Material
Area of electrode(m2)
Method (a) C crucible 141104 Ti net 12104
Method (b) C rod 13104 Ti net 8104
Method (c) C rod 13104 Ti net 19104
Apparent area of cylinder made from titanium mesh.
15 mm 6 mm
Sample area No sample area
Method (a)(b) Method (c)
Ti rod
Ti block
Ti net
Ti block
Fig. 2 Condition of the Ti net.
0 100 200 300 400 500 600 700 800 900 1000 0
1 2 3 4 5 6 7 8 9 10
Current,
I
/A
Time, t/s
Run (a-3)
Run (c-3)
Run (b-3)
Fig. 3 Relationship between electrolysis time and current.
(a) (b)
[image:2.595.323.527.75.239.2] [image:2.595.313.537.165.427.2] [image:2.595.47.291.287.368.2]amount of electricity supplied. Percentage values of Q=Q0 are used in this paper.
3.2 Reduction
Figure 4 shows the relationship between the supplied charge and the analytical concentration of oxygen in the sample. The oxygen concentration generally decreased with an increase in the supplied charge. The phases in the samples were identified by XRD measurements and are listed in Table 2. When a small amount of charge was supplied for electrolysis, the lower-valent oxides in the Ti-O binary system, such as Ti2O and TiO (they are referred to as the lower oxides in this paper), were mixed with the oxides in the Ca-Ti-O ternary system, such as CaTiO3and CaTi2O4. This shows that these ternary oxides were readily formed by reaction with the residual TiO2and the CaO produced in the sample until the byproduct, CaO, dissolved into bulk CaCl2. When a larger amount of electrical charge was supplied, lower-valent oxides such as TiO0:325, Ti6O, and Ti3O, in the
Ti-O binary system were formed after the disappearance of the ternary compounds containing Ca. It is noteworthy that these binary oxides are transformed to a single phase of -Ti when they are heated to the experimental temperature, 1223 K, according to the binary phase diagram of Ti-O. In other words, they were precipitated from-Ti when they were cooled from 1223 K. A TiO stoichiometric phase with
25.1 mass%O should have formed when the reductions were homogeneous at the supplied charge of Q=Q0¼50%. However, the analytical oxygen values were 20–23 mass%, as shown in Fig. 4 and Table 2.
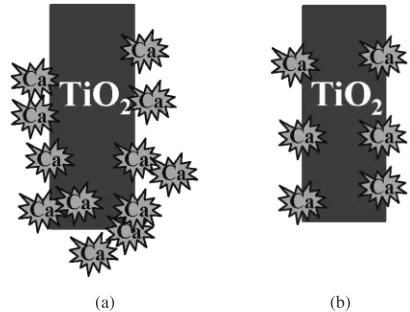
Three possible reasons for this result are discussed below. The first reason is the direct reaction between TiO2 powder and the Ti basket. This can reduce the analytical oxygen concentration. The second reason is Ti metal contamination because the Ti basket became brittle after the electrolysis, and the fragments from it were mixed with the recovered sample powder. Although special care was taken in Run (b-1) to avoid such contamination, the average oxygen concen-tration from several analytical runs was 20.7 mass%, i.e., lower than 25.1%. Therefore, this second reason was not dominant. The third reason is the oxygen inhomogeneity formed in the sample. Figure 5 illustrates an inhomogenous example such as Run (c-2), where the 15-mm basket was used withQ=Q0¼200%. In order to find the oxygen distri-bution in this slightly reduced sample, the specimens were carefully sliced to approximately every 2 mm thickness from the slightly sintered cylindrical sample obtained in Run (c-2), and they were separately of distance from the outer surface where the specimen is attached to the Ti basket. The central part showed a higher oxygen concentration, which means that this part experienced delayed reduction. There was a varying distribution of oxygen in the sample, and the average value was taken from several analytical values. The analytical deviation is shown in the form of error bars in Fig. 4.
[image:3.595.53.284.70.238.2]For example, sample (b-2) contained 9.9 mass%O, and CaTiO3was also identified. This phase could not be detected in sample (b-3) containing 7.1 mass%O. A part from the supplied charge, ternary compounds such as CaTiO3 and CaTi2O4 decomposed below a boundary of approximately 8 mass%O. This oxygen level corresponds to the stable region of -Ti in the binary Ti-O phase diagram. At first glance, it seems curious CaTiO3 coexisted with -Ti, considering that electrolysis is conducted in the Ca-Ti-O ternary system, not in the Ti-O binary system. If we consider the ternary system containing Ca, it is reasonable to consider that CaTiO3 can be stable at such an extremely low partial oxygen pressure. It is noteworthy that the coexistence of Fig. 4 Relationship between supplied charge and oxygen content.
Table 2 Phase identification by XRD measurements and oxygen concen-trationCo.Q=Q0is the supplied charge.
Method Run Q=Q0(%) C0(mass%) Phase identified
by XRD
(a-1) 51.8 23.2 CaTi2O4, Ti2O
(a) (a-2) 157.3 5.9 Ti6O, TiC
(a-3) 523.6 1.0 TiO0:325, TiC
(b-1) 52.0 20.7 CaTiO3, Ti2O
(b) (b-2) 150.3 9.9 TiO0:325, CaTiO3
(b-3) 350.3 7.1 TiO0:325, TiC
(b-4) 522.3 1.9 Ti, TiC
(c-1) 54.6 23.4 CaTiO3, TiO
(c) (c-2) 200.1 6.8 Ti3O
(c-3) 271.5 2.1 Ti6O, TiC
(c-4) 517.8 0.8 Ti6O, TiC
Center of the cathode basket Surface of
the Ti net
[image:3.595.324.526.72.246.2] [image:3.595.46.291.295.458.2]CaTiO3 and -Ti during the FFC process was previously reported by Dringet al.7)
Table 2 indicates that TiC sometimes coexisted with-Ti, as previously reported.6) The formation of TiC can be
explained as follows. Carbon is unwillingly formed by the parasite reaction with CO or CO2gas, as indicated in eq. (5), where Ca reduces these gases. In particular, when the oxygen level in the obtained Ti decreases, the amount of Ca consumed for deoxidation of Ti decreases, and the fairly large amount of Ca formed y electrolysis can diffuse from the cathode to the bulk material. The concentration of Ca in the molten salt increases and Ca dissolved in the salt contributes to the reaction represented by eq. (5). Therefore, the formed carbon easily reacts with Ti to form TiC. This TiC was detected by XRD measurement.
3.3 Effects of anodic surface area
3.3.1 Initial stage of reduction
The oxygen concentration decreased when Q=Q0 in-creased. In this study, the difference between reduction and deoxidation can be specified as follows. ‘‘Reduction’’ is referred to as the process required to obtain metallic Ti from oxides containing an amount of oxygen greater than 14.2 mass%O, because metallic -Ti can contain 14.2 mass%O at 1223 K.8) ‘‘Deoxidation’’ is referred to as the process
required to remove the residual oxygen from metallic Ti containing an amount of oxygen less than 14.2 mass%. As shown in Fig. 4, when the average oxygen level was high, a slight difference was found between the experiment using the carbon crucible and that using the carbon bar with regard to the oxygen level at the initial stage of reduction. The reasons for this observation will now be discussed.
The average cathodic current density (CCD) is defined as (total supplied charge)/(total time for electrolysis)/(cathodic surface area); by this definition, the average CCD was 7.4 kA/m2 and 3.3 kA/m2 for Run (a-1) and Run (b-1), respectively. The average CCD for Run (a-1) is about twice as large as that for Run (b-1) because the anodic surface area of the carbon crucible was larger. In other words, about twice as much Ca per unit of time and surface area was generated for Run (a-1). It is noted that the total amount of Ca generated is equivalent for both experiments because the same amount of electric charge was supplied; thus, in theory, the obtained oxygen concentrations should be equivalent.
After starting the electrolysis, the Ti basket is surrounded by the Ca reductant, as illustrated in Fig. 6. Figures 6(a) and (b) show the distribution of calcium when the carbon crucible and carbon bar were used, respectively. The Ca concentration near the cathode in Run(a-1) (carbon crucible) becomes higher than that in Run(b-1) (carbon bar). When the Ca reductant is generated at a faster rate than the rate of consumption during reduction of TiO2, a portion of Ca dissolves into the melt because the solubility of Ca in the CaCl2 melt is about 4 mol%Ca; thus, in this case, Ca is not effectively used for reduction of TiO2. Therefore, the lower CCD at the initial stage is more favorable to effectively form lower oxides containing lesser amounts of oxygen.
3.3.2 Later stage for deoxidation
Low oxygen concentration was achieved in Method (a), particularly whenQ=Q0was larger than 100%. Here, we will
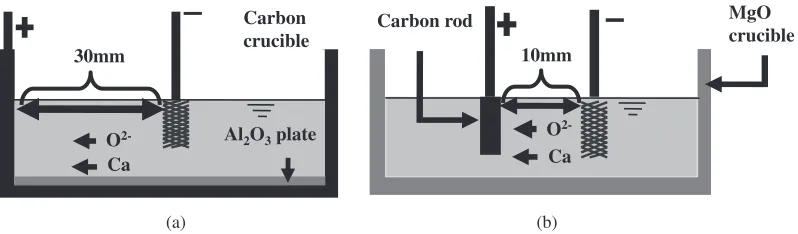
discuss why the carbon crucible served as a better anode than the carbon bar at the deoxidation stage. Figure 7 illustrates the experimental positions of the electrodes. The electrode distances were approximately 10 mm and 30 mm for the experiments using the carbon bar and carbon crucible, respectively. Alumina was used as an insulator in order to suppress the possible parasite reaction (5) between the gas bubbles at the crucible bottom and Ca generated at the cathode, because the distance between the crucible bottom and the cathode was only 5 mm.
The CO2 gases formed should be extracted toward the outside of the reactor; some parasite reactions can occur with Ca at the cathode. For example, the Ca reductant may be consumed by a reaction with CO2gas such as
2CaþCO2¼2CaOþC ð6Þ
Because the electrode distance in Fig. 7(b) is lesser than that in Fig. 7(a), the Ca consumption represented by eq. (6) can more easily occur in the experiment of Fig. 7(b). Therefore, the Ca concentration near the cathode in Fig. 7(b) becomes lower, and Ca supply toward the inside of the Ti basket is decreased. As a result, deoxidation of the sample in Fig. 7(a) is delayed when compared to that in Fig. 7(b).
3.4 Effects of the diameter of the Ti basket
Here, the change in the amount of residual oxygen in Ti will be discussed from the viewpoint of CCD by using the change in the cathodic diameter of the Ti basket. The results obtained by Methods (b) and (c) are compared, as shown in Fig. 4. At the initial stage of reduction, e.g.,Q=Q0¼50%, a lower oxygen concentration was achieved by Method (b) where the 6-mm basket was used. However, at the later stage of deoxidation, a lower oxygen concentration was achieved by Method (c) where the 15-mm basket was used.
3.4.1 Initial stage of reduction
The surface area where the oxide sample was attached to the Ti basket was different in Methods (b) and (c). Because Ca deposited on the surface of the cathodic Ti net reduces the Ti oxides, Ca should be more efficiently utilized if the thin cylinder comes in contact with a larger specific area per amount of oxide. It is reasonable to consider that a lower oxygen concentration was achieved using the thin cylinder.
(a) (b)
3.4.2 Later stage of deoxidation
Figure 8 illustrates the macroscopic structure after the electrolysis, at the later stage of deoxidation, where the oxygen concentration of the sample were less than about 8 mass%. The cathode consisted of the Ti basket, sintered body, and lower Ti oxides obtained from the outer surface to the center. In the vicinity of the Ti basket, a very tight and hard sinter was obtained. The sintered layer at the 15-mm basket was not so tight and hard as that at 6-mm basket, and more porous than it.
A delay in deoxidation occurred below 10 mass%O in Method (b) (6-mm basket), as shown in Fig. 4, while efficient deoxidation occurred in Method (c) (15-mm basket). This behavior indicates that the formation of the hard sintered layer in the vicinity of the Ti basket disturbs the rate of inward penetration of Ca and, as a result, delays the deoxidation of the sample. In addition, the larger basket has open space at the upper part of the basket, into which the Ca reductant can enter for deoxidation. Thus, although TiO2 powder was used instead of the TiO2 pellets that were commonly used in previous studies of the FFC process,9)the existence of the sintered metallic layer determined the deoxidation rate in our experiments. Therefore, it is neces-sary to incorporate a cathodic structure that can hold a loose packing and has a sufficiently large open volume per oxide volume.
The sintering of Ti was not significant on the surface of the 15-mm basket and open space in the upper part of the Ti basket assisted effective penetration of the Ca reductant to reduce TiO2 and to deoxidize the formed Ti powder. In this study, the reduction rate was determined by the formation of a tightly sintered layer. It is desirable for the cathode to have a sufficiently large inner capacity for the sample volume, as in the case of the 15-mm basket.
4. Conclusion
We carried out detailed investigation of the thermochem-ical reduction of TiO2 in molten CaCl2 by the OS process.
The sequential behavior of reduction and deoxidation was studied by changing the current density. From the analytical oxygen content and phase identification of the obtained powders, the optimum conditions for the electrodes were determined. The obtained results are summarized below.
(1) When the 6-mm basket was used, the oxygen content in the sample decreased slightly because a sintered titanium layer formed near the surface of the Ti basket at the initial stage and it blocked further Ca penetration. The oxygen concentration decreased rapidly when the 15-mm basket was used as the cathode, allowing an open space to remain above the sample.
(2) It was found that pure-titanium powder whose oxygen content was as low as 8000 mass ppm when the cathodic current density was high and a carbon crucible was used as the anode.
(3) The conditions suitable for the achievement of a lower oxygen concentration included a higher cathodic current density and the use of a cathode that had an inner capacity large enough to easily contain the sample volume.
(4) A greater electrode distance minimizes the parasite reaction between the CO/CO2gas and the Ca reductant.
Acknowledgements
This work was financially supported in part by the Grant-in-aid for Scientific Research from the Japan Society for the Promotion of Science (#183603367 and #20360341), the Light Metal Educational Foundation, Iketani Science and Technology Foundation, and the ISIJ Research Promotion Grant.
REFERENCES
1) T. Suzuki and Y. Moriguchi: The Story of Titanium, (Japanese Standards Association, Tokyo 1995).
2) K. Ono and R. O. Suzuki: Materia Japan41(2002) 28–31. 3) K. Ono and R. O. Suzuki: JOM Feb. (2002) 59–61.
4) R. O. Suzuki and S. Inoue: Metall. Mater. Trans.34B(2003) 277. 5) D. A. Wenz, I. Johnson and R. D. Wolson: J. Chem. Eng. Data.14(1969)
250–252.
6) R. O. Suzuki, K. Teranuma and K. Ono: Metall. Mater. Trans.34B (2003) 287.
7) K. Dring, R. Dashwood and D. Inman: J. Electrochem. Soc.152(2005) D184-190.
8) T. B. Massalski (Ed.):Binary Alloy Phase Diagrams, 2nd ed., (ASM International, Ohio 1990).
9) D. J. Fray: JOM Oct (2001) 26. O
2-Carbon crucible
Ca
Al2O3plate 30mm
Carbon rod
O
2-Ca 10mm
MgO crucible
(a) (b)
Fig. 7 Illustration of experimental arrangements using the carbon crucible (a) and the carbon rod (b).