Effect of Microstructure before Cold Rolling on Texture
and Formability of Duplex Stainless Steel Sheet
Jun-ichi Hamada
1;*and Naoto Ono
2;*1
Steel Research Laboratories, Nippon Steel Corporation, Futtsu 293-8511, Japan
2Nagoya Sales Office, Nippon Steel & Sumikin Stainless Steel Corporation, Nagoya 450-0003, Japan
The evolution of the microstructure and texture of type 329J4L duplex stainless steel (DSS) sheet during cold rolling and annealing were examined, and the effect of the initial microstructure before cold rolling on texture and formability was investigated. The texture of thephase in the hot-rolled and annealed sheet had a strong-fiber texture, and this was stable even in cold-rolled and annealed sheet. However, in the case of a coarsegrain caused by high-temperature annealing prior to cold rolling, the-fiber texture and colony withh100i==NDorientation in the
phase were reduced in cold-rolled and annealed sheet. This control of the-fiber texture in thephase in cold-rolled and annealed sheet improved the elongation,r-value, and ridging characteristics. These results showed that the texture and the formability of type 329J4L DSS cold-rolled and annealed sheet depended on the texture of thephase and the initialphase morphology before cold rolling.
[doi:10.2320/matertrans.MG200907]
(Received September 28, 2009; Accepted January 7, 2010; Published March 25, 2010)
Keywords: duplex stainless steel, hot rolling, cold rolling, annealing, microstructure, texture, orientation distribution function, recrystallization, elongation,r-value, ridging
1. Introduction
Duplex stainless steels (DSS), such as type 329J4L, which
have a two-phase ferrite () and austenite () microstructure,
are widely used in the construction of chemical plants, vessels, and tanks, because they have good corrosion
resistance and strength.1,2)In recent years, DSS sheets have
been adopted for the fabrication of water tanks and heat
exchange panels having complicated forms.3) DSS sheets
are inferior in terms of ductility compared with austenitic
stainless steel sheet such as type 304,2) and therefore an
improvement in the ductility of DSS sheet is required.3)The
effects of manufacturing conditions on the tensile properties of DSS sheet, especially elongation at room temperature, have been studied by few researchers, and it has been shown that the elongation is related to the hot-rolling texture, as well as the annealing temperature after hot rolling and cold
rolling.4–7)However, the mechanism is not clear, and there
have been few studies on the characteristics of microstructure
and texture in hot rolling, cold rolling, and annealing.8–10)
In addition, the microstructural evolutions in (þ)
microduplex stainless steel caused by thermo-mechanical processing, which combines deformation and heat treatment,
were investigated.11–21) Huang et al.14–16) showed that no
recrystallization of thematrix took place when the initial
structure before cold rolling was fine, but recrystallization
occurred in thematrix withf111gh011iinitial orientation
when the initial structure was coarse. This finding indicates
that the recrystallization of the matrix in (þ)
micro-duplex structures strongly depends on the initial structure prior to cold rolling. If the above results obtained by Huang
et al.14–16) are taken into consideration, it can be assumed that the change in the microstructure prior to cold rolling causes a change in the texture and formability of cold-rolled and annealed sheets.
The object of this study is to understand the formation of the texture in the consecutive process of sheet manufacture and the effect of the microstructure before cold rolling on the cold-rolling and annealing texture, as well as on formability,
such as tensile elongation,r-value, and ridging properties in
type 329J4L DSS sheet. In particular, attention is paid to the
phase morphologies prior to cold rolling and the formation
of texture after cold rolling and annealing.
2. Experimental Procedures
The chemical composition of commercial type 329J4L hot-rolled sheet used in this study is given in Table 1. The thickness (t) of the plate was 4.5 mm. The stable phase at various temperatures of this material calculated by Thermo-Calc and the experimental process are shown in Fig. 1.
From this calculation, in this steel the matrix phase is bcc
and the second phase is fcc, which is precipitated from the
matrix. The stable phase issingle phase above 1300C,
the fractions of precipitated phase change below 1300C.
Hot-rolled specimens were annealed for 60 s at temperatures
ranging from 1000 to 1250C to obtain different size of
grains and particles, and this process was followed by air
cooling. These annealed specimens, with different structure sizes, were cold-rolled to a 67% reduction on a laboratory rolling mill, and the cold-rolled sheets were annealed for 30 s
at 1050C, 1075C, and 1200C, followed by air cooling.
Microstructural observations were carried out by optical microscopy in the longitudinal section in the center of the
specimens in each process. The ratio of the area of the
[image:1.595.304.548.756.785.2]phase in the sheets heat treated under various conditions was measured using image analysis equipment. A line analysis
Table 1 Chemical composition of steel used (mass%).
C Si Mn P S Ni Cr Mo N
0.02 0.5 0.7 0.02 0.003 6.9 25.2 3.0 0.11
*Formerly at Research & Development Center, Nippon Steel & Sumikin
Stainless Steel Corporation
of the nickel, chromium, and molybdenum concentrations in the annealed sheets was performed in the direction of thickness by EPMA (Electron Probe Micro Analysis,
accelerated voltage 15 kV, beam step 0.5mm). The textures
were quantitatively examined using the orientation distribu-tion funcdistribu-tion (ODF). Incomplete pole figures of (200), (211),
and (310) for the phase, and those of (200), (220), and
(311) for the phase were measured in steps 5 on the
sections perpendicular to the normal direction (ND-section) in the center layer of the sheets by means of the Schultz
reflection method using Mo K radiation. From these pole
figures, the ODF was determined using the iterative
series-expansion method.22) Figure 2 shows the most important
texture components and fibers for the phase in ’2¼45
section of ODF (Bunge’s notation). Moreover, EBSD (Electron Back Scatter Diffraction) measurements were performed using OIM (Orientation Imaging Micrograph) software (Ver.4.6) equipped on field emission type scanning electron microscopy (accelerated voltage 25 kV, beam step
1mm). These observations were made on the rolling plane
(ND plane) in the center of some final annealed sheets. Tensile tests of the cold-rolled and annealed sheets were carried out at room temperature in the longitudinal and transverse directions using JIS 13B test pieces. Moreover,
the lankford values (r-values) and the ridging characteristics
of some final annealed sheets were determined to confirm the influence of the recrystallization textures on formability.
The r-values were measured after 10% tensile strain along
the longitudinal, transverse, and diagonal directions using
JIS 13B test pieces. The average r-values (rm) and the
planar anisotropy parameters (r) were calculated using the
following equation,
rm¼ ðr0þ2r45þr90Þ=4 ð1Þ
r¼ ðr02r45þr90Þ=2 ð2Þ
where, r0,r45, and r90 are the r-values of the longitudinal,
diagonal, and transverse directions, respectively. The ridging characteristics of the final annealed sheets were determined
after 16% tensile strain along the rolling direction using JIS 5 test pieces. The surface roughness profiles of the transverse to the rolling direction of the deformed samples were measured by means of a two-dimensional surface roughness instrument, and the ridging height was defined by the convex (hill) and concave (valley) intervals.
3. Results and Discussions
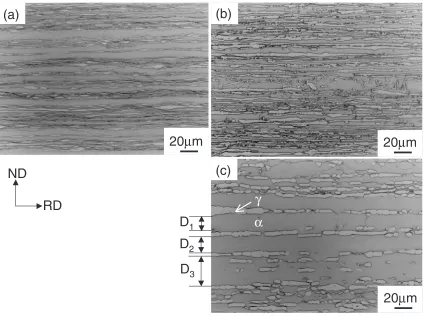
3.1 Microstructures and textures before cold rolling Figure 3 shows the microstructures (TD plane) of the hot-rolled (a) and annealed sheets (b) and (c). The hot-hot-rolled
sheet contained thephase (dark) elongated parallel to the
rolling direction, and thephase (white) precipitated during
hot rolling. The interval of the phase in the specimen
annealed at 1200C (c) was wider than that in the specimen
annealed at 1050C (b). Figure 4 shows the fractions of the
Temperature,
800
900
σ
Cold rolling
0
20
40
60
80
100
Fraction of phases (%)
A.C
67%
A.C
(
α
+
γ
)
(
α
+
γ
)
Fig. 1 Calculated fraction of phases and experimental procedures.
0 10 20 30 40 50 60 70 80 90 90
80 70 60 50 40 30 20 10 0
Φ
ϕ
1{100}<011>{100}<001> {100}<011>
{211}<011>
{211}<111>
{111}<011> {111}<011>
{111}<112>
{110}<011> {110}<112> {110}<001> {411}<148>
α
-fiber
γ
-fiber
{554}<225> {111}<112>
[image:2.595.108.490.74.299.2] [image:2.595.321.536.330.537.2]phase by measurement and calculation results, and the
thickness of the phase in the thickness direction after
annealing. The thickness of thephase (D) was determined
by the interval of phase, as it is indicated as D1{3 in
Fig. 3(c) for example. As for the fraction of thephase, both
tendencies were almost the same, and the amount of the
phase before cold rolling changes to about 60% to 90% during heat treatment. At the same time, the grain size became coarser with high-temperature annealing, and the
specimen annealed at 1050C had a coarseness of 5:5
6:8mm and that of the specimen annealed at 1200C was
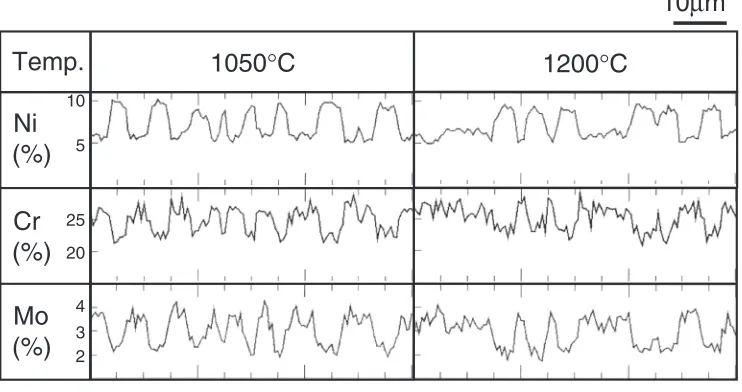
28:634:2mm. Figure 5 shows the concentration profiles
of nickel, chromium, and molybdenum by EPMA
measure-ment for the specimens annealed at 1050C and 1200C.
As for the phase with high concentration of chromium
and molybdenum, it was found that the size of thephase
under high-temperature annealing was larger than that under low-temperature annealing.
Figure 6 shows the ’2¼45 sections of the ODFs
measured in the hot-rolled sheets. After hot rolling, the
phase (a) had a strong -fiber (f100gh011i f111gh011i)
especially f100gh011i and a weak fiber (f111gh011i
f111gh112i), and the phase (b) had f110gh112i
(Brass-orientation) andf112gh111i(Copper-orientation). The results
for hot-rolling textures of theand phases in DSS sheet
were the same as for the rolling textures of bcc and fcc metals, respectively, and were similar to the previous
results.7–9,23) Figure 7 shows the ’
2¼45 sections of the
ODFs measured in the hot-rolled and annealed sheets. After
annealing at 1050C (a) and (b), in the phase (a) there
was still a strong presence of -fiber, and the texture of
the phase (b) was about the same as the texture in
hot-rolled sheet. Even under high-temperature annealing at
1200C, there was still a strong presence of -fiber in the
phase (c), and in thephase (d)f110gh112iwas weakened
by high-temperature annealing. No investigations were carried out into the recrystallization behavior of DSS
hot-rolled sheets. It is concluded that the phase in type
329J4L DSS hot-rolled sheets is very hard to recrystallize during annealing.
RD
ND
(a)
(b)
(c)
20
µ
m
D
1D
2D
320
µ
m
20
µ
m
γ
α
Fig. 3 Optical microstructures of (a) hot-rolled sheet, (b) annealed sheet at 1050C, and (c) annealed sheet at 1200C.
0.0 0.2 0.4 0.6 0.8 1.0
900 1000 1100 1200 1300
Annealing temperature of hot-rolled sheet, T / °C
Fraction of
α
phase
0 10 20 30 40 50 60 70 80
Thickness of
α
phase,
D
/
µ
m
Experiment
Calculation by Thermo-calc.
[image:3.595.87.510.71.387.2] [image:3.595.64.274.430.610.2]3.2 Microstructures and textures after cold rolling and annealing
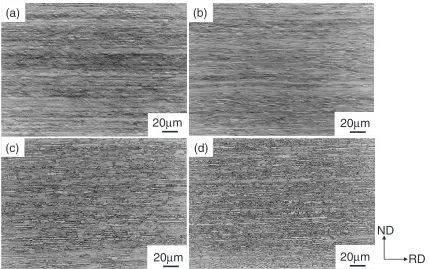
Figure 8 shows the microstructures (TD plane) of cold-rolled (a and b) and annealed sheets (c and d). The final
annealing temperature of these samples is 1075C. Shear
bands were seen in cold-rolled structure, but the effect of the initial structure could not be identified clearly by optical
microscopy. Blicharski20)stated that the formation of shear
bands was induced by the presence ofphase in thematrix,
and there might be influence of the fractions of the phase
prior to cold rolling. A detailed investigation of the
inhomogeneous deformed structures betweenand phase
will be necessary in future. The effect of the initial structure before cold rolling on the microstructure of final annealed
sheets was not clear. In addition, the fractions of thephase
in the final annealed samples at 1075C were about the same
with around 63%, without affecting the annealing temper-ature after hot rolling.
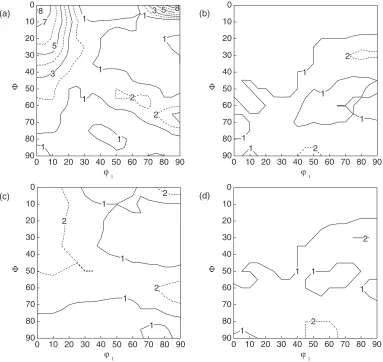
Figure 9 shows the ’2¼45 sections of the ODFs
measured in the cold-rolled sheets. Both the specimen
annealed at 1050C after hot rolling (a) and (b) and the
specimen annealed at 1200C after hot rolling (c) and (d) had
similar textures. In thephase, they had the-fiber that was
a typical cold-rolling texture of bcc. In thephase, they had
f110gh112i orientation that was typical of the cold-rolling
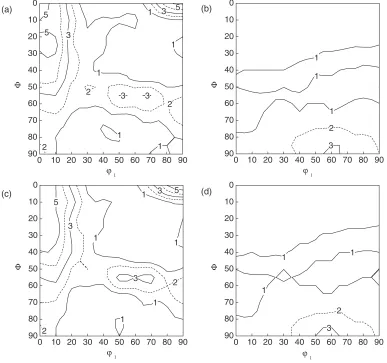
texture of fcc. Figure 10 shows the’2¼45 sections of the
ODFs measured in the final annealed sheets. In thephase
(a) and (c), both the specimen annealed at 1050C after hot
rolling (a) and the specimen annealed at 1200C after hot
rolling (c) had an-fiber texture. The feature of-fiber in the
phase was similar to the results of previous studies,8,10)but
the intensity of thephase texture in the specimen annealed
at 1200C after hot rolling (c) was much lower than that
annealed at 1050C after hot rolling (a). This result suggests
that the texture of the phase in DSS cold-rolled and
annealed sheet is affected by the initial structure prior to cold
rolling. On the contrary, in thephase (b) and (d), the effect
of the initial structure was not clearly observed. Figure 11
shows the relation between thephase morphologies before
cold rolling and the orientation densities of each preferred
orientation in the final annealed sheets. In thephase, the
orientation densities of the -fiber components after final
(%)
Mo
(%)
20
2 3 4
Fig. 5 Concentration profiles of Ni, Cr, and Mo in the specimens annealed at 1050C and 1200C.
0 9
1
3 5 7 9
0
(a) (b)
1 1 2 1
30 20 10 7
5
3 1
1
1 30
20 10
1
1 1
70 60 50 40
Φ
4 3
1
4
70 60 50 40
Φ
1 3 90
80
ϕ
1 1
0 10 20 30 40 50 60 70 80 90
90 80
ϕ1 1
0 10 20 30 40 50 60 70 80 90
5
[image:4.595.113.484.81.277.2] [image:4.595.107.489.312.500.2]1 1
2 3 1
1
2
4 1
1
90 80 70 60 50 40 30 20 10 0
Φ
ϕ1
1
1
2 1
1 1 2
90 80 70 60 50 40 30 20 10 0
Φ
ϕ1
(a) (b)
(c) 12 (d)
11 9
7
5
3
1 1
1
1 3
1
5
3 7 9
2 11
4 2
90 80 70 60 50 40 30 20 10 0
Φ
ϕ1
7
5
3 1
1
1
1
1 3
3 1 5 7
0 10 20 30 40 50 60 70 80 90
90 80 70 60 50 40 30 20 10 0
Φ
ϕ1 0 10 20 30 40 50 60 70 80 90
0 10 20 30 40 50 60 70 80 90
0 10 20 30 40 50 60 70 80 90
Fig. 7 ’2¼45sections of the ODFs of (a) and (c)phase and (b) and (d)phase after annealing at (a) and (b) 1050C and (c) and (d) 1200C.
20
µ
m
(a)
(b)
20
µ
m
20
µ
m
(c)
(d)
ND
RD
20
µ
m
Fig. 8 Optical microstructures of (a) and (b) cold-rolled and (c) and (d) final annealed sheets annealed at (a) and (c) 1050C and (b) and
[image:5.595.107.490.76.436.2] [image:5.595.84.513.488.757.2]annealing, especiallyf100gh011iandf211gh011i, decreased
with coarsening grain prior to cold rolling. On the other
hand, the microstructure prior to cold rolling had very little
influence on the orientation in the phase after final
annealing.
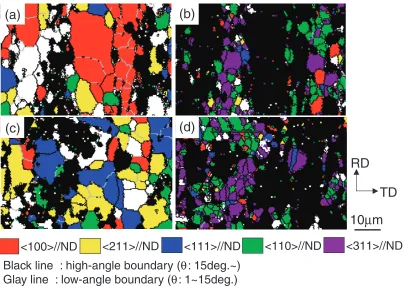
Figure 12 shows the local orientation maps obtained for
the sheets with a final annealing temperature at 1075C using
EBSD measurements. In the phase (a and c), both the
specimens annealed at 1050C (a) and 1200C (c) after hot
rolling had four dominant orientations;h100i,h110i,h111i,
andh211i==ND. In the specimen annealed at 1050C after
hot rolling, the grain colony havingh100i==NDwas clearly
observed and this was identified withf100gh011icolony by
analysis. By contrast, in the specimen annealed at 1200C
after hot rolling, the colony was barely observed and the
grain having h111i==ND increased. In the phase (b) and
(d), both the specimens annealed at 1050C (b) and 1200C
(d) after hot rolling had two dominant orientations;h110iand
h311i==ND, and the difference of both was uncertain. It
was made clear by macro and micro measurements of the crystal orientation that the microstructure prior to cold rolling had an influence on the crystal orientation distribution of the
phase of cold-rolled and annealed sheet. Huang et al.14)
showed that no recrystallization of thematrix took place
when the initialsub-grain size was not larger than 10mm,
but recrystallization occurred in anmatrix withf111gh011i
initial orientation when the initial sub-grain size was
15.6mm. Although the decision methods of the initialgrain
size are different, this is similar to the result obtained by
Huanget al.14)from a point of view that the initialstructure
before rolling has the influence on the recrystallization
behavior of the phase in duplex structure. Additionally,
there are some reports that the recrystallization progresses
when the ratio ofphase is high;10,19)it is guessed that the
phase morphology prior to cold rolling affects the local
inhomogeneous deformation during cold rolling, the
nucle-ation sites, or the growth of subgrains.10,14,19)
3.3 Tensile elongations of cold-rolled and annealed sheets
Figure 13 shows the relation between the phase
morphologies prior to cold rolling and the elongation of
final sheets annealed at 1075C for 30 s. The elongation
improved with a coarse grain prior to cold rolling.
Although the elongation in the transverse direction was low compared with the elongation in the longitudinal direction,
both elongations were improved by a coarsegrain prior to
cold rolling. Figure 14 shows the effect of the final annealing temperature on the elongation of the specimen with various
sizes ofphase before cold rolling. In this paper, grain was
(c) (d)
5
3 1
1 2
1 3
1
1
5
2
3
90 80 70 60 50 40 30 20 10 0
Φ
ϕ1
1 1
2 1
3 90
80 70 60 50 40 30 20 10 0
Φ
ϕ1
2
3 90
80
ϕ1
1 2
1
0 10 20 30 40 50 60 70 80 90
90 80
ϕ1
0 10 20 30 40 50 60 70 80 90 0 10 20 30 40 50 60 70 80 90
0 10 20 30 40 50 60 70 80 90
[image:6.595.105.492.76.439.2]classified as ‘‘fine’’ when the size of the grain prior to
cold rolling was D¼5:56:8mm, and as ‘‘coarse’’ when
D¼28:632:4mm, and the influence of the final annealing
temperature was taken into consideration. Moreover, the=
phase fraction after final annealing is described throughout
the figure. In the case of high-temperature annealing such as
1200C, the elongation was lower than that of the specimens
annealed at 1050C and 1075C. The change in final
annealing temperature brought about the change in the
fraction of the phases, and thephase increased with
high-temperature annealing as shown throughout the figure. Although it is known that the ductility is affected by the
fraction of phases,4,5)even if the final annealing temperature
is changed, the influence of the initial microstructure, i.e. the microstructure before cold rolling, does not change. It is concluded that the tensile elongation of DSS sheet is strongly
dependant on thephase morphologies before cold rolling.
This improvement in the elongation may not be drastic; but even an improvement at this level is effective with regard to
the severe press processing, as it has been reported.3)
3.4 Effects onr-value and ridging properties
With ferritic stainless steel and mild steel sheets, it is well
known that the r-value is improved by promotion of the
h111i==NDrecrystallization orientations.24,25)Moreover, the
ridging phenomenon in ferritic stainless steel sheet has been explained by the anisotropic plastic flow caused by the orientational colonies that originate mainly in cast and
hot-rolling structures and are of -fiber texture.26–33) That is to
say, the textures and orientation distributions of thephase
(a) (b) (c) (d) 1 2 1 1 1 2 90 80 70 60 50 40 30 20 10 0 Φ ϕ1 2 1 1 1 1 2 2 90 80 70 60 50 40 30 20 10 0 Φ ϕ1 8 7 5 3 1 1 1 1 2 3 1 5 1 8 1 2
0 10 20 30 40 50 60 70 80 90
90 80 70 60 50 40 30 20 10 0 Φ ϕ1 1 1 1 2 2 1 1 90 80 70 60 50 40 30 20 10 0 Φ ϕ1
0 10 20 30 40 50 60 70 80 90
0 10 20 30 40 50 60 70 80 90
[image:7.595.107.490.74.436.2]0 10 20 30 40 50 60 70 80 90
Fig. 10 ’2¼45 sections of the ODFs of (a) and (c)phase and (b) and (d)phase in final annealed sheets annealed at (a) and (b) 1050C and (c) and (d) 1200C before cold rolling.
0 1 2 3 4 5
Thickness of α phase before cold rolling, D / µm
Orientaion density, f(g) 0 2 4 6 8 10
0 10 20 30 40 50
Thickness of α phase before cold rolling, D / µm
Orientaion density, f(g) {100}<011> {211}<011> {111}<011> {111}<112>
(a) α phase (b) γ phase
{110}<112>
{211}<111>
{100}<001>
0 10 20 30 40 50
[image:7.595.50.288.490.678.2]influence both characteristics. There are few studies aboutr
-value and ridging of DSS sheet,7,8)and the change of these
characteristics is expected when the texture of the matrix
phase changes as mentioned above. Table 2 shows the effect
of the size of thephase before cold rolling on ther-value
and ridging characteristics. With a coarsening of thegrain
before cold rolling, high r-values at the longitudinal and
transverse directions, low planar anisotropy ofr-value, and
low ridging height were yielded. It is thought that the change
of the texture and colony structure of thephase influenced
both characteristics. These results suggest that the texture
of the phase in (þ) DSS sheet is dominant over the
mechanical properties, and is greatly dependent upon the initial structure before cold-rolling.
10 15 20 25 30
0 10 20 30 40
Thickness of α phase before cold rolling, D / µm
Elongation (%)
[image:8.595.97.501.70.357.2]: Longitudinal direction : Transverse direction Solid : Total elongation Open : Uniform elongation
Fig. 13 Relation between size of phase before cold rolling and elongation of final annealed sheets.
TD
RD
<100>//ND
<211>//ND
<111>//ND
<110>//ND
<311>//ND
10
µ
m
Black line : high-angle boundary (
θ
: 15deg.~)
Glay line : low-angle boundary (
θ
: 1~15deg.)
[image:8.595.65.268.406.603.2](c)
Fig. 12 Orientation maps of (a) and (c)phase and (b) and (d)phase in final annealed sheets annealed at (a) and (b) 1050C and (c) and
(d) 1200C before cold rolling. A deviation angle of 15 degrees was used for the classification.
10 15 20 25 30
1000 1050 1100 1150 1200 1250
Annealing temperature of cold-rolled sheets, T / °C
Elongation (%)
: D=5.5~6.8µm : D=28.6~32.4µm Solid : Total elongation Open : Uniform elongation 60/40 63/37
[image:8.595.322.532.410.599.2]80/20 α/γ=
Fig. 14 Effect of final annealing temperature on elongation of final annealed sheets with different sizephase before cold rolling.
Table 2 Effect of size ofphase before cold rolling onr-value and ridging height of final annealed sheets.
Initialstructure r0 r45 r90 rm r
[image:8.595.305.549.683.736.2]4. Conclusions
To clarify the formation of the texture in type 329J4L DSS sheet and the effects of the microstructure prior to cold rolling on the textures and the formability, the cold rolling and annealing textures and the formability of sheets with
different phase morphologies before cold rolling were
investigated. The main results can be summarized as follows:
(1) The texture of the phase in hot-rolled sheet had a
strong -fiber texture, and this was stable even in
cold-rolled and annealed sheet. However, in the case of a coarse
grain due to high-temperature annealing prior to cold
rolling, the -fiber texture and colony with h100i==ND
orientation of thephase in cold-rolled and annealed sheet
were reduced.
(2) By controlling the -fiber texture of the phase in
cold-rolled and annealed sheet, the elongation, r-value, and
ridging characteristic improved. It was concluded that the formability of type 329J4L DSS sheet greatly depended on
the texture of thephase, and the initialphase morphology
before cold rolling was important in controlling texture in final annealed sheets.
Acknowledgment
The authors would like to thank Mr. Kazuyuki Agata and Mr. Noriaki Yagi, Nippon Steel & Sumikin Stainless Steel Corp., for the X-ray measurements.
REFERENCES
1) J. Charles: Steel Re.79(2008) 455–465.
2) J.-O. Nilsson: Mater. Sci. Technol.8(1992) 685–700.
3) N. Ono, J. Hamada, I. Muto and T. Komori: CAMP-ISIJ16(2003) 550. 4) H. Yoshida, S. Fujiwara, N. Okanobori and T. Toge: CAMP-ISIJ7
(1994) 1757.
5) O. Suzuki, Y. Ikegami and T. Toge: CAMP-ISIJ10(1997) 1442. 6) H. Miyamoto and S. Tsuge: CAMP-ISIJ8(1995) 708.
7) W. B. Hutchinson, K. Ushioda and G. Runnsjo¨: Mater. Sci. Technol.1
(1985) 728–731.
8) G. Fargas, N. Akdut, M. Anglada and A. Mateo: ISIJ Int.48(2008) 1596–1602.
9) J. Keichel, J. Foct and G. Gottstein: ISIJ Int.43(2003) 1781–1787. 10) J. Keichel, J. Foct and G. Gottstein: ISIJ Int.43(2003) 1788–1794. 11) H. Ogiyama and Y. Soyama: Netsu Shori29(1989) 85–91. 12) T. Maki, T. Furuhara and K. Tsuzaki: ISIJ Int.41(2001) 571–579. 13) T. Maki: Netsu Shori39(1999) 5–11.
14) X. Huang, K. Tsuzaki and T. Maki: Scr. Metall. Mater.33(1995) 341– 346.
15) X. Huang, K. Tsuzaki, T. Furuhara and T. Maki: Mater. Sci. Forum
204–206(1996) 417–422.
16) X. Huang, K. Tsuzaki and T. Maki: Acta Metall. Mater.43(1995) 3375–3384.
17) T. Furuhara, K. Hikita and T. Maki: Mater. Sci. Forum304–306(1999) 53–58.
18) K. Ameyama, K. Murakami, T. Maki and I. Tamura: J. Japan. Inst. Metals49(1985) 1045–1053.
19) B. A. Cooke, A. R. Jones and B. Ralph: Met. Sci.13(1979) 179–186. 20) M. Blicharski: Met. Sci.18(1984) 92–98.
21) M. Blicharski: Met. Sci.18(1984) 99–102.
22) H. Inoue and N. Inakazu: J. Japan Inst. Metals58(1994) 892–898. 23) L. Duprez, B. C. De Cooman and N. Akdut: Steel Re.73(2002) 531–
538.
24) W. B. Hutchinson: Int. Mater. Rev.29(1984) 25–42.
25) R. K. Ray, J. J. Jonas and R. E. Hook: Int. Mater. Rev.39(1994) 129– 172.
26) M. Matsuo: Bull. Japan Inst. Metals19(1980) 192–199.
27) H. Takechi, H. Kato, T. Sunami and T. Nakayama: J. Japan Inst. Metals
31(1967) 717–723.
28) H. C. Chao: Trans. ASM60(1967) 37–50. 29) R. N. Wright: Metall. Trans.3(1972) 83–91.
30) J. Harase, K. Ohta, R. Shimizu and T. Takeshita: Tetsu-to-Hagane´76
(1990) 1520–1527.
31) M. Brochu, T. Yokota and S. Satoh: ISIJ Int.37(1997) 872–877. 32) H. J. Shin, J. K. An, S. H. Park and D. N. Lee: Acta Mater.51(2003)
4693–4706.
33) J. Hamada, Y. Matsumoto, F. Fudanoki and S. Maeda: ISIJ Int.12