Observation on Isothermal Reactive Diffusion between Solid Fe and Liquid Sn
Masahiro Hida
+1and Masanori Kajihara
+2Department of Materials Science and Engineering, Tokyo Institute of Technology, Yokohama 226-8502, Japan
The kinetics of the reactive diffusion between solid Fe and liquid Sn was experimentally examined using Fe/Sn diffusion couples. The diffusion couples were prepared by an isothermal bonding technique and then immediately annealed in the temperature range ofT=703773 K for various times up tot=90 ks (25 h). During annealing, a compound layer of FeSn2is formed at the initial Fe/Sn interface in the diffusion
couple and grows mainly into the liquid Sn specimen. AtT=703 K, the compound layer indicates a needle-like microstructure in the early stages but a columnar microstructure in the late stages. On the other hand, atT=723773 K, only the columnar microstructure is realized in the compound layer within the experimental annealing times. The mean thickness of the compound layer is proportional to a power function of the annealing time. The exponentnof the power function is mostly close to 0.6. In the early stages atT=703 K, however,nis equal to unity within experimental uncertainty. If growth of a compound layer with a uniform thickness is controlled by volume diffusion,nis equivalent to 0.5. In contrast,nis equal to unity for longitudinal growth of a needle-like grain, even though volume diffusion is the rate-controlling process. This is the case for the layer growth in the early stages atT=703 K. Since independent longitudinal growth of each columnar grain contributes to the layer growth governed by volume diffusion, n is slightly greater than 0.5 for the compound layer with the columnar microstructure. Consequently, the discontinuous variation ofncorresponds to the transition from the needle-like microstructure to the columnar microstructure. [doi:10.2320/matertrans.M2012060]
(Received February 17, 2012; Accepted April 26, 2012; Published June 6, 2012)
Keywords: reactive diffusion, intermetallic compounds, soldering, bulk diffusion, irontin system
1. Introduction
The reactive diffusion between solid Cu and liquid Al was
experimentally observed in a previous study.1) In this
experiment, Cu/Al diffusion couples were prepared by an
isothermal bonding (IB) technique and then annealed at
temperatures of T=9731073 K. In the IB technique,1)the
solid Cu and liquid Al specimens are separately preheated at the same temperature as the annealing temperature in a vacuum. After sufficient preheating, the Cu and the Al are bonded with each other and then annealed immediately. Hence, in the IB technique, the temperatures of the Cu and the Al are equivalent and remain constant during preheating,
bonding and annealing. In the Cu/Al diffusion couple, layers
of the ¢, £1 and ¾2 phases are formed at the initial Cu/Al
interface owing to annealing. According to a recent phase
diagram in the binary CuAl system,2)the¢,£1and¾2phases
are the only stable compounds atT=9731073 K. The mean
thickness of each compound layer is proportional to a power
function of the annealing time. For the¢layer, the exponent
of the power function is close to 0.5 atT=10231073 K but
nearly equal to 0.25 atT=973 K. On the other hand, for the
£1 layer, the exponent takes values between 0.25 and 0.5 at
T=10231073 K but that smaller than 0.25 at T=973 K.
The exponent smaller than 0.5 indicates that boundary
diffusion contributes to the growth of the compound layer.3)
Thus, the rate-controlling process of the layer growth varies depending on the annealing temperature in a different manner
for each compound.1)
The IB technique was also used to observe experimentally the reactive diffusion between solid Fe and liquid Al in
previous studies.4,5) In these experiments, Fe/Al diffusion
couples were isothermally annealed atT=9731073 K4)and
T=10531093 K.5) A phase diagram in the binary FeAl
system6) shows that FeAl3, Fe2Al5 and FeAl2 are the stable
compounds at T=9731093 K. After annealing, however,
Fe2Al5 and FeAl3 were observed, but FeAl2 was not
recognized clearly. Similar experiments were conducted by
Bouché et al.7) and Bouayad et al.8) In their experiments,
Fe/Al diffusion couples were prepared by a melt bath (MB)
technique and then isothermally annealed at T=973
1173 K. According to their observations,7,8) only Fe
2Al5
and FeAl3 are produced as visible layers during annealing.
The thickness is much smaller for FeAl3than for Fe2Al5, and
irregular tongue-like morphology is realized for Fe2Al5.
Owing to the irregular morphology, the growth rate of Fe2Al5
could not be reliably determined in their experiments.7,8)Also
in a previous study,4)the Fe2Al5layer indicates the irregular
tongue-like morphology at T=9731023 K. At T=1053
1093 K,4,5) however, Fe2Al5 is formed as a rather uniform
layer. Thus, the morphology of Fe2Al5 varies depending on
the annealing temperature. Such temperature dependence of the morphology could be detected by the IB technique but not by the MB technique.
As previously mentioned, all the stable compounds are formed in the reactive diffusion between solid Cu and liquid
Al.1) On the other hand, all the stable compounds are not
necessarily produced as visible layers in the reactive diffusion
between solid Fe and liquid Al.4,5,7,8) Hence, the growth
behavior of compounds during reactive diffusion varies depending on the combination of solid and liquid metals. To obtain information for the dependence of the growth behavior on the combination, the reactive diffusion between solid Fe and liquid Sn was experimentally examined in the present study. Diffusion couples consisting of pure Fe and Sn were prepared by the IB technique and then isothermally annealed
in the temperature range of T=703773 K. The
micro-structure of the annealed diffusion couple was observed in a metallographical manner. The rate-controlling process for compound growth was discussed on the basis of the observation.
+1Graduate Student, Tokyo Institute of Technology
+2Corresponding author, E-mail: kajihara@materia.titech.ac.jp
2. Experimental
Polycrystalline columnar specimens with a length of 5 mm were cut from a commercial rod of pure Fe with a diameter of
8 mm and a purity of 99.7%in a manner similar to a previous
study.4)The Fe rod contains a trace of C, 0.01 mass% of Si,
0.25 mass% of Mn, 0.004 mass% of P, 0.004 mass% of S,
0.01 mass% of Cu, 0.01 mass% of Ni and 0.01 mass% of
Cr as impurities. The columnar specimens were separately annealed in evacuated silica capsules at a temperature of 1173 K for a time of 2 h, followed by air cooling without
breaking the capsules. The top and bottom flat-surfaces
of each annealed columnar specimen were mechanically
polished on #8004000 emery papers.
A commercial rod of pure Sn with a diameter of 6 mm and
a purity of 99.9% was cut into columnar specimens with a
length of 30 mm. Each polished Fe specimen was encapsu-lated together with a columnar Sn specimen in an evacuated silica capsule with an inner diameter of 8.5 mm. The silica capsule was isothermally preheated for a time of 1.8 ks (0.5 h) in the temperature range between 703 and 773 K. During preheating, the solid Fe specimen was separated from
the Sn melt in the silica capsule. After preheating, a flat
surface of the solid Fe specimen was immediately contacted with that of the Sn melt with a diameter of 8.5 mm and
a length of 15 mm to prepare a columnar Fe/Sn diffusion
couple. The diffusion couple was isothermally annealed for various times up to 90 ks (25 h) at the same temperature as preheating, followed by water quenching with breaking the capsule. The annealing temperature and time are denoted by Tandt, respectively.
Cross-sections of the annealed diffusion couple were
mechanically polished on #8004000 emery papers and
then finished using diamond with a diameter of 1 µm. The microstructure of the cross-section was observed with a dif-ferential interference contrast optical microscope (DICOM) and with a back-scattered electron image (BEI) by scanning electron microscopy (SEM). Concentrations of Fe and Sn in each phase on the cross-section were measured by electron probe microanalysis (EPMA) using pure Fe and Sn with a
purity of 99.99%as standard specimens under the following
conditions: the accelerating voltage was 20 kV; the probe
current was 5 nA; the analyzing crystals for Fe-K¡and Sn-L¡
were lithium fluoride (LiF) and polyethylene terephthalate
(PET), respectively; and the chemical composition was evaluated by a standard ZAF correction technique.
3. Results and Discussion
3.1 Microstructure
A typical DICOM photograph of the cross-section for a
diffusion couple annealed at T=773 K fort=14.4 ks (4 h)
is shown in Fig. 1. In thisfigure, the lower and upper regions
are the Fe and Sn specimens, respectively. As can be seen, a compound layer with a columnar microstructure is observed between the Fe and the Sn, and the longitudinal direction of
each columnar grain is almost normal to the initial Fe/Sn
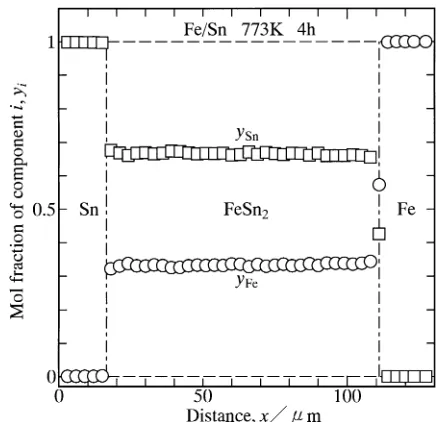
interface in the diffusion couple. Concentration profiles of Fe
and Sn across the compound layer along the direction normal
to the Fe/Sn interface were measured by EPMA. A result for
the diffusion couple in Fig. 1 is indicated in Fig. 2. In this figure, the ordinate and the abscissa show the mol fractionyi
of component i and the distance x, respectively, and open
circles and squares indicate the mol fractions yFe and ySn,
respectively. In Fig. 2, the origin x=0 of the distance is
located in the Sn. For the EPMA measurement, however, attention was focused on phase identification of the compound layer. Consequently, the location of the origin is merely arbitrarily chosen to represent conveniently the concentration profiles. As can be seen, the compound layer
is FeSn2. According to a recent phase diagram in the binary
FeSn system,9)FeSn and FeSn
2 are the stable compounds
at T=703773 K. Nevertheless, only FeSn2 was observed
in all the annealed diffusion couples. Here, FeSn2 is an
intermetallic compound with the tetragonal CuAl2 type
crystal structure.9) The FeSn2 layer grows mainly towards
the Sn in the diffusion couple.
Various BEI photographs of the cross-section for different diffusion couples are shown in Fig. 3. The annealing
temperature is T=703 K in Fig. 3(a)3(b) and T=773 K
in Fig. 3(c), and the annealing time is t=3.6 ks (1 h) in
Fig. 3(a) and 3(c) andt=60 ks (16.7 h) in Fig. 3(b). In this
figure, the brightest region on the upper side is the Sn,
Fig. 1 DICOM photograph of cross-section for the diffusion couple annealed atT=773 K fort=14.4 ks (4 h).
[image:2.595.315.541.71.179.2] [image:2.595.316.535.234.445.2]the darkest region on the lower side is the Fe, and the
intermediate region between the Fe and the Sn is the FeSn2
layer. AtT=703 K, the FeSn2layer consists offine
needle-like grains for t=3.6 ks (1 h) but coarse columnar grains
for t=60 ks (16.7 h). However, at T=773 K, the FeSn2
layer is composed of coarse columnar grains even for
t=3.6 ks (1 h). Although the longitudinal direction of the
columnar grain is almost normal to the Fe/Sn interface in
Fig. 3(b) and 3(c), that of the needle-like grain is randomly distributed in Fig. 3(a). The needle-like morphology as well as the columnar morphology indicates the anisotropy of
growth behavior for FeSn2 due to the tetragonal crystal
structure.
The reactive diffusion between solid Fe and liquid Sn was
experimentally observed also by van Beek et al.10) In this
experiment, diffusion couples consisting of pure Fe and the Sn-rich liquid solution phase saturated with Fe were prepared
by heating at T=543 K for t=30 s and then isothermally
annealed at T=573753 K for various times. Thus, the
initial and boundary conditions are dissimilar between the diffusion couple in the present study and that by van Beek et al.Nevertheless, the FeSn2 layer with a columnar
micro-structure was observed in the diffusion couple also by van Beeket al.10)Furthermore, they reported that the longitudinal
direction of the columnar grain was parallel to the caxis of
FeSn2. This means that the growth of FeSn2 occurs faster
along thecaxis than along thea axis. For reactive diffusion
in binary alloy systems, the growth rate of a compound layer is predominantly determined by the interdiffusion coefficient
of the growing compound.1118)Consequently, the
interdiffu-sion coefficient of FeSn2should be much greater along thec
axis than along the a axis. At T=703 K, fine needle-like
grains of FeSn2are randomly distributed in the early stages as
shown in Fig. 3(a). Among these, the grains with thecaxis
almost normal to the Fe/Sn interface predominantly
contrib-ute to faster growth of the FeSn2 layer. As a result, the
columnar microstructure composed of such predominant
FeSn2 grains is realized in the late stages as indicated in
Fig. 3(b). Thus, the transition from the needle-like micro-structure to the columnar micromicro-structure occurs at a certain critical annealing time. The higher the annealing temperature is, the shorter the critical annealing time becomes. Hence,
atT=773 K, the columnar microstructure is actualized even
fort=3.6 ks (1 h) as shown in Fig. 3(c).
3.2 Growth behavior of intermetallic layer
In OM photographs of the cross-section like Fig. 1, the
FeSn2layer is clearly distinguishable from the Fe and the Sn.
Hereafter, the FeSn2 layer is called the intermetallic layer.
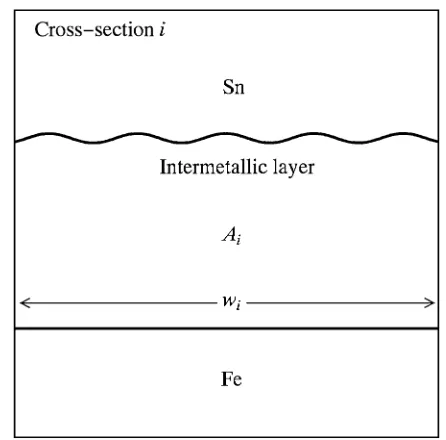
A schematic microstructure of the intermetallic layer on
cross-sectioniis shown in Fig. 4. From the OM photograph,
the area Ai of the intermetallic layer corresponding to the
partial length wiof the initial Fe/Sn interface in Fig. 4 was
Fig. 3 BEI photographs of cross-section for the diffusion couples annealed under the following conditions: (a) T=703 K, t=3.6 ks (1 h); (b)
T=703 K,t=60 ks (16.7 h); and (c)T=773 K,t=3.6 ks (1 h).
[image:3.595.314.537.67.287.2] [image:3.595.62.276.67.544.2]measured on each cross-section, and then the sumsAand w
were obtained as4)
A¼Xm
i¼1
Ai (1a)
and
w¼Xm
i¼1
wi (1b)
fromAiandwi, respectively, wherem²5. Using the values
ofAandw, the mean thicknesslof the intermetallic layer was
evaluated at each annealing time t by the following
equation:4)
l¼A
w: ð2Þ
The results for T=723, 743, 763 and 773 K are plotted
as open rhombuses, squares, inverse-triangles and circles,
respectively, in Fig. 5. On the other hand, forT=703 K, the
results at shorter and longer annealing times are indicated as open double-circles and triangles, respectively. In Fig. 5, the
ordinate and the abscissa show the logarithms of l and t,
respectively. For T=723773 K, the plotted points are
located well on a straight line at each annealing temperature.
This means thatlis expressed as a power function oftby the
following equation.
l¼k t0t n ð3Þ
Here, t0is unit time, 1 s. It is adopted to make the argument
t/t0of the power function dimensionless. The proportionality
coefficient k has the same dimension as the thickness l,
but the exponent n is dimensionless. The dimensionless
argument of the power function is essentially important;
otherwise the dimension of kvaries depending on the value
of n. From the points plotted for T=723773 K in Fig. 5,
k and n were estimated by the least-squares method as
shown with various straight lines. The estimated values are
indicated in Fig. 5. On the other hand, for T=703 K, the
open double-circles and triangles lie well on straight lines with larger and smaller gradients at the shorter and longer annealing times, respectively. Hereafter, the stages at the shorter and longer annealing times are called stages I and II,
respectively. In each stage,lis expressed as a power function
of t by eq. (3). Thus, kand n were estimated by the
least-squares method in each stage at T=703 K. The estimation
gives k=1.73©10¹7m and n=0.516 for stage II. On the
other hand, for stage I, n is evaluated to be 0.993«0.068
and thus equal to unity within experimental uncertainty.
As a consequence, considering exactly n=1, we obtain
k=1.82©10¹9m for stage I. The values of k and n in
stages I and II yield the two solid lines intersected at
t=tc=12.2 ks (3.38 h) in Fig. 5. Here, tc is the critical
annealing time for the transition from stage I to stage II. The
exponentnis equal to unity att<tcbut rather close to 0.5 at
t>tc. For the growth of the intermetallic layer during
reactive diffusion,nvaries depending on the rate-controlling
process.3,19)Hence, we may anticipate that the discontinuous
variation of n att=tc corresponds to the transition of the
rate-controlling process.
3.3 Rate-controlling process
The exponent n is plotted against the annealing
temper-ature T as open circles with error bars in Fig. 6. At
T=703 K, however, n is shown only for stage II. As can
be seen, n is typically greater than 0.5, though the plotted
points are slightly scattered. When the layer growth is controlled by the interface reaction at the migrating interface,
nis equal to unity. On the other hand,nis equivalent to 0.5, if
the volume diffusion in the constituent phases of the diffusion couple is the rate-controlling process. Hereafter, the
relation-ships with n=0.5 and 1 are called the parabolic and linear
relationships, respectively. Therefore, we expect that the
Fig. 5 The thicknesslof the intermetallic layer versus the annealing timet. Open rhombuses, squares, inverse-triangles and circles show the results forT=723, 743, 763 and 773 K, respectively, and open double-circles and triangles indicate those forT=703 K in stages I and II, respectively. Various lines represent the calculations from eq. (3).
[image:4.595.62.276.68.275.2] [image:4.595.318.536.69.274.2]interface reaction is the rate-controlling process for stage I but the volume diffusion is that for stage II. Such a discontinuous transition of the rate-controlling process was
actually observed in a previous study.19)For precipitation of a
second phase into an untransformed matrix in binary alloy systems, the growth of the second phase controlled by volume diffusion usually obeys the parabolic relationship. If the shape of the second phase is a paraboloid of revolution or a parabolic cylinder, however, the longitudinal growth of the second phase occurs according to the linear relationship even
for the diffusion rate-controlling process.2023)As previously
mentioned, the intermetallic layer grows mainly towards the Sn. Thus, the growth rate of the intermetallic layer is predominantly determined by the migration rate of the
FeSn2/Sn interface. According to the BEI photographs for
T=703 K like Fig. 3(a) and 3(b), the intermetallic layer
possesses the needle-like microstructure at t<tc but the
columnar microstructure at t>tc. At t<tc, each needle-like
grain grows predominantly along the longitudinal direction. If the morphology of the growing cusp of the grain is considered to be a paraboloid of revolution or a parabolic cylinder, the longitudinal growth obeys the linear
relation-ship. On the other hand, att>tc, the parabolic relationship
may hold for the layer growth with the columnar
micro-structure. As shown in Fig. 3(b), however, the FeSn2/Sn
interface is slightly gathered due to independent longitudinal growth of each columnar grain. As a result, the linear relationship partially contributes to the layer growth, and
hencenbecomes slightly greater than 0.5. Consequently, the
transition from stage I to stage II in Fig. 5 corresponds to that from the needle-like microstructure to the columnar
microstructure. This transition should appear also at T=
723773 K. In this temperature range, however, only the
columnar microstructure was observed for all the diffusion
couples. Thus, tc is much shorter than the experimental
annealing times atT=723773 K.
As mentioned earlier, the reactive diffusion between pure Fe and the Sn-rich liquid solution phase saturated with Fe
was experimentally studied at T=573753 K by van Beek
et al.10) Thus, the initial and boundary conditions in their study are different from those in the present study. Only a
FeSn2layer was observed in the annealed diffusion couple in
the present study, but a very thin FeSn layer as well as a
FeSn2 layer was recognized in that by van Beek et al.10)
Since there is no diffusional flux in the Sn-rich phase
saturated with Fe, the formation of FeSn may be attributed to such initial and boundary conditions. Nevertheless, the thickness is much smaller for the FeSn layer than for the
FeSn2layer, and hence the growth of the intermetallic layer is
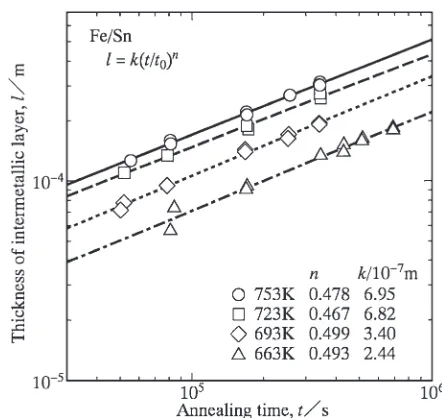
predominated by that of the FeSn2 layer.10)Their result for
the growth of the intermetallic layer is represented in Fig. 7.
In this figure, the ordinate and the abscissa show the
logarithms of l and t, respectively, and open triangles,
rhombuses, squares and circles indicate the results for
T=663, 693, 723 and 753 K, respectively. For T=573
and 623 K, however, only two experimental points were obtained at each annealing temperature. Thus, the results for
T=573 and 623 K are omitted in Fig. 7. As can be seen, the
plotted points are located well on a straight line at each
annealing temperature. Hence, also in Fig. 7,l is expressed
as a power function oftby eq. (3). From the plotted points in
Fig. 7,kandnwere estimated by the least-squares method as
shown with various straight lines. The estimated values are
shown in Fig. 7. Among these values, n is plotted against
T as open squares with error bars in Fig. 6. For the open
squares, n is close to 0.5 independent of T. Since no
diffusional flux exists in the Sn-rich phase,10) the gathered
morphology of the migrating FeSn2/Sn interface does not
influence the migration behavior.2023) In such a case, the
parabolic relationship holds for the layer growth controlled by volume diffusion. In Fig. 6, the annealing temperature range is higher for the open circles than for the open squares. Consequently, the open squares guarantee that volume diffusion is the rate-controlling process also for the open circles.
The results forT=723 K in Figs. 5 and 7 are shown again
as open circles and squares, respectively, in Fig. 8. Within the
experimental annealing times in Fig. 8, l is slightly greater
for the open squares10) than for the open circles. Since the
intermetallic layer grows mainly into the Sn phase, the growth rate of the intermetallic layer is governed by the
migration rate of the FeSn2/Sn interface as previously
mentioned. Furthermore, the migration rate is determined
by the diffusional flux balance at the FeSn2/Sn interface.24)
For the open squares,10)however, there exits no diffusional
flux in the Sn phase, and hence the migration rate is decided
only by the diffusionalflux in FeSn2. In contrast, for the open
circles, the diffusional flux in the Sn works as a drag force
against the interface migration. Consequently, l becomes
slightly smaller for the open circles than for the open squares as indicated in Fig. 8.
As shown with the open circles in Fig. 6, n is rather
insensitive toTatT=703773 K. Considering an equivalent
value of n at all the annealing temperatures, k and n were
simultaneously evaluated from the open triangles,
rhom-buses, squares, inverse-triangles and circles for T=703,
723, 743, 763 and 773 K, respectively, by the least-squares
Fig. 7 The thicknesslof the intermetallic layer versus the annealing timet
forT=663, 693, 723 and 753 K shown as open triangles, rhombuses, squares and circles, respectively, for the result reported by van Beek
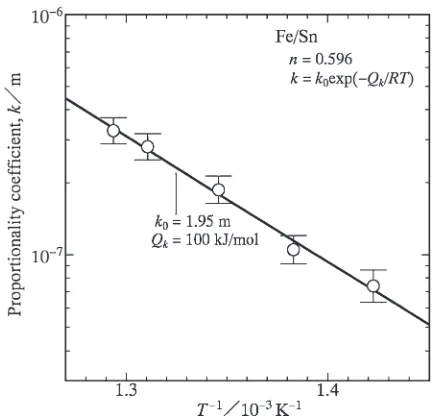
[image:5.595.315.536.66.275.2]method. The evaluated value of n is shown in Fig. 6, and
those ofkare plotted againstTas open circles with error bars
in Fig. 9. In Fig. 9, the ordinate indicates the logarithm ofk,
and the abscissa shows the reciprocal ofT. As can be seen,
the open circles lie well on a straight line within experimental
uncertainty. Therefore, the dependence ofkonTis expressed
by the following equation.
k¼k0exp RTQk
ð4Þ
The pre-exponential factor k0 and the activation enthalpy
Qk in eq. (4) were evaluated from the open circles by the
least-squares method as shown with a solid line in Fig. 9.
The evaluation provides Qk=100 kJ/mol. If the parabolic
relationship holds for the growth of the intermetallic layer,
the dependence ofkonTis estimated from the interdiffusion
coefficients and the solubility ranges of the constituent phases in the diffusion couple by an appropriate analytical
technique.1118) As a result, Q
k is compared with the
activation enthalpy of the interdiffusion coefficient for
each phase. Unfortunately, however,n=0.596 for the open
circles in Fig. 9, and hence the analytical technique1118)
cannot be used to estimate the value ofQkin a
straightfor-ward manner.
On the other hand, as shown in Figs. 6 and 7, the parabolic
relationship almost holds for the result by van Beeket al.10)
Instead of eq. (3) with n=0.5, they used the following
equation to describe the parabolic relationship.10)
l2¼Kt ð5Þ
Here,Kis the parabolic coefficient with a dimension of m2/s.
Inserting n=0.5 into eq. (3) and combining eq. (5) with
eq. (3), we obtain the relationshipK=k2/t
0 betweenKand
k. Although merely two values ofl were measured at each
temperature of T=573 and 623 K as mentioned earlier, K
was evaluated by the least-squares method atT=573753 K
and then expressed as a function of T by the following
equation of the same formula as eq. (4).10)
K¼K0exp QRTK
ð6Þ
The pre-exponential factorK0and the activation enthalpyQK
in eq. (6) were estimated by van Beek et al.10) as follows:
K0=2.00©10¹7m2/s and QK=83 kJ/mol. A dashed line
in Fig. 10 shows their estimation. As previously mentioned, however, the parabolic relationship does not hold in the present study. Nevertheless, for semi-quantitative comparison
ofQK, the values ofKforT=703, 723, 743, 763 and 773 K
were estimated from the open triangles, rhombuses, squares, inverse-triangles and circles, respectively, in Fig. 5 by the
least-squares method. The estimated values ofKare plotted
[image:6.595.62.278.68.274.2]Fig. 9 The proportionality coefficient k versus the reciprocal of the temperatureTforn=0.596 shown as open circles with error bars. A solid line indicates the calculation from eq. (4).
Fig. 10 The parabolic coefficientKversus the reciprocal of the temperature
Tshown as open circles with error bars. A solid line indicates the calculation from eq. (6), and a dashed line represents the corresponding result reported by van Beeket al.10)
[image:6.595.312.535.69.272.2] [image:6.595.58.276.343.551.2]against Tas open circles with error bars in Fig. 10. In this figure, like Fig. 9, the ordinate and the abscissa show the
logarithm ofKand the reciprocal ofT, respectively. Although
the open circles are rather scattered in Fig. 10,K0=2.18©
10¹1m2/s and QK=170 kJ/mol are evaluated by the
least-squares method as indicated with a solid line. As can be seen,
QK=170 kJ/mol is almost twice greater than QK=83
kJ/mol. As mentioned earlier, the volume diffusion in the
Sn phase occurs for the diffusion couple used in the present
study but not for that utilized by van Beek et al.10) Thus,
information on the temperature dependence of the Sn-phase
diffusion is included in QK=170 kJ/mol but not in
QK=83 kJ/mol.1118) This may be the reason why QK is
mostly twice lager for the solid line than for the dashed line in Fig. 10.
4. Conclusions
To examine the kinetics of the reactive diffusion in the
solid-Fe/liquid-Sn system, the Fe/Sn diffusion couples were
prepared by the isothermal bonding technique and then
immediately annealed at temperatures of T=703773 K.
At these temperatures, FeSn2 and FeSn are the stable
intermetallic compounds in the binary FeSn system.9)
During annealing, however, only FeSn2 is formed as a
visible compound layer at the initial Fe/Sn interface in the
diffusion couple and grows mainly towards the liquid-Sn. The compound layer possesses the needle-like and columnar microstructures in the early and late stages, respectively, at
T=703 K. At T=723773 K, however, only the columnar
microstructure is actualized at the experimental annealing times. The mean thickness of the compound layer increases in proportion to a power function of the annealing time. The exponent of the power function is typically close to 0.6. In
the early stages atT=703 K, however, the exponent is equal
to unity within experimental accuracy. The discontinuous variation of the exponent is attributed to the transition from the needle-like microstructure to the columnar microstruc-ture. In spite of such a transition, the compound growth is controlled by volume diffusion under the present annealing conditions.
Acknowledgements
The authors are grateful to Dr. Y. Tanaka at Tokyo Institute of Technology, Japan for assistance in the early stages of the present study. The study was partially supported by a Grant-in-Aid for Scientific Research from the Ministry of Education, Culture, Sports, Science and Technology of Japan.
REFERENCES
1) Y. Tanaka, M. Kajihara and Y. Watanabe:Mater. Sci. Eng. A445446 (2007) 355363.
2) T. B. Massalski, H. Okamoto, P. R. Subramanian and L. Kacprzak:
Binary Alloy Phase Diagrams, vol. 1 (ASM International, Materials Park, OH, 1990) p. 142.
3) A. Furuto and M. Kajihara:Mater. Trans.49(2008) 294303. 4) Y. Tanaka and M. Kajihara:Mater. Trans.50(2009) 22122220. 5) Y. Tanaka and M. Kajihara:J. Mater. Sci.45(2010) 56765684. 6) T. B. Massalski, H. Okamoto, P. R. Subramanian and L. Kacprzak:
Binary Alloy Phase Diagrams, vol. 1 (ASM International, Materials Park, OH, 1990) p. 148.
7) K. Bouché, F. Barbier and A. Coulet:Mater. Sci. Eng. A249(1998) 167175.
8) A. Bouayad, Ch. Gerometta, A. Belkebir and A. Ambari:Mater. Sci. Eng. A363(2003) 5361.
9) T. B. Massalski, H. Okamoto, P. R. Subramanian and L. Kacprzak:
Binary Alloy Phase Diagrams, vol. 2 (ASM International, Materials Park, OH, 1990) p. 1775.
10) J. A. van Beek, S. A. Stolk and F. J. J. van Loo: Z. Metallkde.73 (1982) 439444.
11) M. Kajihara:Acta Mater.52(2004) 11931200. 12) M. Kajihara:Mater. Sci. Eng. A403(2005) 234240. 13) M. Kajihara:Mater. Trans.46(2005) 21422149. 14) M. Kajihara:Diffus. Defect Forum249(2006) 9196. 15) M. Kajihara:Mater. Trans.47(2006) 14801484.
16) Y. Tanaka and M. Kajihara:Mater. Trans.47(2006) 24802488. 17) M. Kajihara and T. Yamashina:J. Mater. Sci.42(2007) 24322442. 18) M. Kajihara:Mater. Trans.49(2008) 715722.
19) Y. Tejima, S. Nakamura and M. Kajihara:J. Mater. Sci.45(2010) 919 928.
20) A. Papapetrou: Z. Krist.92(1935) 89129.
21) G. P. Ivantsov: Dokl. Akad. Nauk. S.S.S.R.58(1947) 567569. 22) G. Horvay and J. W. Cahn:Acta Metall.9(1961) 695705. 23) R. Trivedi:Acta Metall.18(1970) 287296.