An application of extreme value theory to cryptocurrencies
GKILLAS, Konstantinos and KATSIAMPA, Paraskevi <http://orcid.org/0000-0003-0477-6503>Available from Sheffield Hallam University Research Archive (SHURA) at:
http://shura.shu.ac.uk/18993/
This document is the author deposited version. You are advised to consult the publisher's version if you wish to cite from it.
Published version
GKILLAS, Konstantinos and KATSIAMPA, Paraskevi (2018). An application of extreme value theory to cryptocurrencies. Economics Letters, 164, 109-111.
Copyright and re-use policy
See http://shura.shu.ac.uk/information.html
An application of Extreme Value Theory to Cryptocurrencies
Konstantinos Gkillasa, Paraskevi Katsiampab,*
a
University of Patras, Greece
b
Sheffield Hallam University, UK
Abtract:
We study the tail behaviour of the returns of five major cryptocurrencies. By
employing an extreme value analysis and estimating Value-at-Risk and Expected
Shortfall astail risk measures, we find that Bitcoin Cash is the riskiest, while Bitcoin
and Litecoin are the least risky cryptocurrencies.
Keywords: Cryptocurrency, Bitcoin, Extreme value analysis, Value-at-Risk, Expected
Shortfall
JEL classification: C46, F38, G01
* Corresponding author at: Sheffield Business School, Sheffield Hallam University, Sheffield, S1 1WB, UK.
1. Introduction
The cryptocurrency market has recently grown immensely. Cryptocurrencies are a
globally-spreading phenomenon which is frequently addressed by media as well as
financial and governmental institutions (Glaser et al., 2014). Bitcoin is the largest
cryptocurrency, representing 59% of the total estimated cryptocurrency capitalisation
(Coinmarketcap.com accessed on Nov 1st, 2017). For this reason, a lot of academic
research has been conducted on Bitcoin (see, e.g., Cheah and Fry, 2015; Dyhrberg,
2016; Urquhart, 2016, 2017; Bariviera, 2017; Katsiampa, 2017; Nadarajah and Chu,
2017). As of October 2017, there are more than 1000 cryptocurrencies, though.
Bitcoin is followed in terms of total market capitalisation by Ethereum, Ripple,
Bitcoin Cash and Litecoin, each one having a market capitalisation above 3 billion
dollars. These five cryptocurrencies together represent 85% of the total
cryptocurrency capitalisation at present (Coinmarketcap.com accessed on Nov 1st,
2017). However, despite the huge growth of the cryptocurrency market, research on
cryptocurrencies other than Bitcoin is very limited. Among few authors who have
studied additional cryptocurrencies are Osterrieder et al. (2017) and Chu et al. (2017).
It is now well-known that cryptocurrencies behave differently to traditional fiat
currencies. In fact, cryptocurrency returns not only are more volatile and riskier than
traditional currencies but also exhibit heavier tail behaviour (Osterrieder et al., 2017;
Phillip et al., 2018). Cryptocurrencies could be therefore viewed as assets, and have a
place in financial markets and portfolio management (Dyhrberg, 2016). Nevertheless,
such assets display extreme price changes which violate the assumption of normality,
and a major challenge of risk management is the appropriate selection of the
distribution of asset returns (Longin, 2005). Consequently, examination of the tail
behaviour of the returns of cryptocurrencies and of the underlying distribution is of
high importance.
Although extreme value theory could be useful to better understand the characteristics
of the distribution tails of asset returns (Longin, 2005), investigation of extreme value
behaviour of cryptocurrencies is rather limited. To the best of the authors' knowledge
only Osterrieder and Lorenz (2017) andOsterrieder et al. (2017) have applied extreme
behaviour only of Bitcoin, while the latter considered several cryptocurrencies, but
excluded Ethereum and Bitcoin Cash, which are among the largest cryptocurrencies,
and used data only for the period between June 2014 and September 2016. Motivated
by the emergence of cryptocurrencies as speculative assets and by the huge price
fluctuations in the cryptocurrency market, in this paper we extend the study of
Osterrieder et al. (2017) by using an updated dataset of major cryptocurrencies,
including Ethereum and Bitcoin Cash. We also contribute to the literature by
providing more accurate results based on an extreme value distribution, namely the
generalized Pareto distribution (GPD). The GPD is the only nondegenerate
distribution that approximates asymptotically the limiting distribution of exceedances
(Balkema and De Haan, 1974; Pickands, 1975). We therefore consider only the
relevant information of extremes providing more accurate risk estimates. Hence, by
applying extreme value theory, the aim of this paper is to examine the tail behaviour
of the major cryptocurrencies.
2. Data and methodology
In this study, we analyse the five largest cryptocurrencies, each one from the earliest
date available to 23rd October 2017. More specifically, the dataset consists of the daily
closing prices for the Bitcoin Coindesk Index (from 18th July 2010, 2655
observations), Ethereum (from 7th August 2015, 809 observations), for Ripple (from
4th August 2013, 1542 observations), Bitcoin Cash (from 23rd July 2017, 93
observations), and Litecoin (from 28th April 2013, 1640 observations). Although
Bitcoin Cash was only recently launched (July 2017), some conclusions regarding its
tail behaviour can still be drawn. The data are publicly available online at
https://www.coindesk.com/price/ for Bitcoin and at https://coinmarketcap.com/coins/
for the remaining cryptocurrencies. We apply a data adjustment procedure similar to
Longin and Pagliardi (2016) in order to obtain stationary time-series for the returns of
the cryptocurrencies taking heteroskedasticity into consideration.
We start the risk analysis of the cryptocurrency returns by fitting a GPD to the
marginal distribution of the returns of each cryptocurrency using the
peaks-over-threshold method to extract extremes. We therefore estimate the two major tail risk
the GPD. Then we proceed by applying a parametric bootstrap bias-correction
approach to the two risk measures in order to reduce any uncertainty resulting from
the estimation procedure of the asymptotic extreme value distribution and the
threshold selection, as in Gkillas et al. (2016).
The distribution of univariate exceedances (𝑋 − 𝑢) of a random variable 𝑋 over a
threshold, 𝑢, can be asymptotically approximated by the GPD, which is defined as
𝐺𝜉,𝜎(𝑥) = 1 − 𝜁 [1 +𝜉𝑥𝜎]−1 𝜉⁄ , 𝑥 > 𝑢, (1)
where x represents the exceedance, 𝜎 > 0 represents the scale parameter, 𝜉 ∈ ℝ is the
tail index or shape parameter, and 𝜁 is the tail probability. In order to select the
threshold, 𝑢, we apply a failure-to-reject method following Choulakian and Stephens
(2012).
We then consider the risk measures of 𝑉𝑎𝑅 and 𝐸𝑆 as functions of the parameters of
the GPD. The 𝑉𝑎𝑅 quantifies the maximum gain/loss occurring over a given
time-period at a given percentile, 𝑝. We define the over one‐day period 𝑉𝑎𝑅 as
𝑉𝑎𝑅𝑝𝛣= 𝑢 +𝜎 𝜉[(
𝑝 𝜁)
−𝜉
− 1], (2)
where 𝛣 represents the number of bootstrap iterations, and 𝜁 ≅ 𝑘 𝑛⁄ , where 𝑘 is the
number of exceedances over the threshold 𝑢 and 𝑛 is the sample size. On the other
hand, the 𝐸𝑆 quantifies the expected size of the exceedance over the 𝑉𝑎𝑅. We define
the 𝐸𝑆 as follows
𝐸𝑆𝑝𝛣 = 1
1−𝜉[𝑉𝑎𝑅𝑝𝛣+ 𝜎 − 𝑢𝜉], (3)
where 𝐸𝑆 is a conditional mean, given that the 𝑉𝑎𝑅 is exceeded.
3. Empirical results
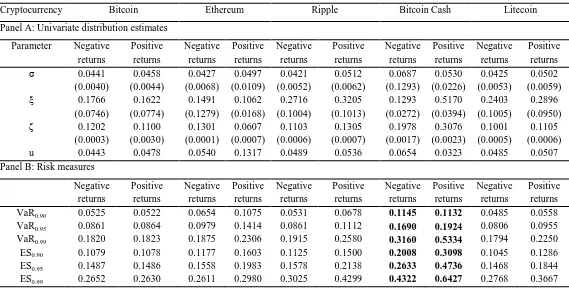
Table 1 presents the asymptotic maximum likelihood estimates of the GPD and the
estimates of the bootstrap bias-corrected risk measures of 𝑉𝑎𝑅 and 𝐸𝑆 for 1000
bootstrap iterations for both the left and right distribution tail of each cryptocurrency.
the tail probability, 𝜁, are reported. In panel B, the bias-corrected risk measures of
𝑉𝑎𝑅 and 𝐸𝑆 at the conventional 90𝑡ℎ, 95𝑡ℎ and 99𝑡ℎ percentiles (1𝑡ℎ, 5𝑡ℎ and 10𝑡ℎ
for negative returns) are presented.
According to the results, the 𝑉𝑎𝑅 measures for Bitcoin Cash are the highest of all at
all the three percentiles for both negative and positive returns, being about twice as
large as the ones for Bitcoin. This result indicates that Bitcoin Cash, which was only
recently launched, has the highest potential loss, but also the highest potential gain.
Bitcoin Cash also has the highest 𝐸𝑆 for both negative and positive returns at all these
three percentiles.
On the other hand, the extreme returns of Litecoin in the left tail and of Bitcoin in the
right tail are the lowest ones according to both 𝑉𝑎𝑅 and 𝐸𝑆. This result suggests that
investment in Litecoin and Bitcoin can be viewed safer than in the other three
cryptocurrencies considered in this study, and is somewhat consistent with the results
of Osterrieder et al. (2017). However, all cryptocurrencies report higher values of risk
than traditional currencies according to both risk measures. When the tails of return
distributions are extremely heavy, diversification increases portfolio riskiness in terms
of VaR, especially for a large class of dependent heavy tailed risks (Ibragimov and
Prokhorov, 2016). According to our findings, this means that investors in
cryptocurrencies are exposed to a high undifferentiated risk.
4. Conclusions
This paper employed extreme value theory to investigate the tail behaviour of the
returns of the five largest cryptocurrencies. We found that Bitcoin Cash has the
highest potential gain and loss and is thus the riskiest cryptocurrency, while Bitcoin
and Litecoin were found to be the least risky, and hence position in those can be
viewed safer than in the other cryptocurrencies considered in this study.
Examination of the tail behaviour of the returns of cryptocurrencies is of utmost
importance for both investors and policy-makers. More specifically, our findings have
which investment choices in the cryptocurrency market are more susceptible to losses
and gains as well as of potential bubbles due to exceedingly high returns. Our results
are also useful to policymakers who could establish a policy intervention framework
to protect investors from positions which have a significantly high financial risk but
are not subject to any control and to limit the extent of a potential bubble, taking into
consideration the high capitalisation as well as the significant amount of uninformed
trades in cryptocurrencies.
Acknowledgement
The authors would like to thank an anonymous referee for helpful suggestions.
Konstantinos Gkillas (Gillas) also gratefully acknowledges research support by the
General Secretariat for Research and Technology (GSRT) and Hellenic Foundation
for Research and Innovation (HFRI).
References
Balkema, A.A., De Haan, L., 1974. Residual life time at great age. The Annals of Probability, 792-804.
Bariviera, A.F., 2017. The inefficiency of Bitcoin revisited: a dynamic approach. Economics Letters, 161, 1-4.
Choulakian, V., Stephens, M.A., 2012. Goodness-of-Fit Tests for the Generalized Pareto Distribution. Technometrics, 43(4), 478–484.
Cheah, E.T., Fry, J., 2015. Speculative bubbles in Bitcoin markets? An empirical investigation into the fundamental value of Bitcoin. Economics Letters, 130, 32-36.
Chu, J., Chan, S., Nadarajah, S., Osterrieder, J., 2017. GARCH Modelling of Cryptocurrencies. Journal of Risk and Financial Management, 10(4), p.17.
Dyhrberg, A.H., 2016. Bitcoin, gold and the dollar–A GARCH volatility analysis. Finance Research Letters, 16, 85-92.
Gkillas (Gillas), K., Tsagkanos, A., Siriopoulos, C., 2016. The risk in capital controls.
Finance Research Letters, 19, 261-266.
Glaser, F., Zimmarmann, K., Haferhorn, M., Weber, M.C., Siering, M., 2014. Bitcoin - Asset or currency? Revealing users’ hidden intentions. In: Twenty Second European Conference on Information Systems, ECIS 2014, Tel Aviv, 1–14.
Katsiampa, P., 2017. Volatility estimation for Bitcoin: A comparison of GARCH models.
Economics Letters, 158, 3-6.
Longin, F., 2005. The choice of the distribution of asset returns: How extreme value theory can help? Journal of Banking & Finance, 29(4), 1017-1035.
Longin, F., Pagliardi, G., 2016. Tail relation between return and volume in the US stock market: An analysis based on extreme value theory. Economics Letters, 145, 252-254.
Nadarajah, S., Chu, J., 2017. On the inefficiency of Bitcoin. Economics Letters, 150, 6-9.
Osterrieder, J., Lorenz, J., 2017. A statistical risk assessment of Bitcoin and its extreme tail behavior. Annals of Financial Economics, 12(01), 1750003.
Osterrieder, J., Strika, M., Lorenz, J., 2017. Bitcoin and cryptocurrencies—not for the faint-hearted. International Finance and Banking, 4(1), 56.
Pickands III, J., 1975. Statistical inference using extreme order statistics. The Annals of Statistics, 119-131.
Phillip, A., Chan, J., Peiris, S., 2018. A new look at Cryptocurrencies. Economics Letters,
163, 6-9.
Urquhart, A., 2016. The inefficiency of Bitcoin. Economics Letters, 148, 80-82.
Table 1 Estimation of the univariate distribution of returns' exceedances.
Cryptocurrency Bitcoin Ethereum Ripple Bitcoin Cash Litecoin
Panel A: Univariate distribution estimates
Parameter Negative returns Positive returns Negative returns Positive returns Negative returns Positive returns Negative returns Positive returns Negative returns Positive returns σ 0.0441
(0.0040) 0.0458 (0.0044) 0.0427 (0.0068) 0.0497 (0.0109) 0.0421 (0.0052) 0.0512 (0.0062) 0.0687 (0.1293) 0.0530 (0.0226) 0.0425 (0.0053) 0.0502 (0.0059) ξ 0.1766
(0.0746) 0.1622 (0.0774) 0.1491 (0.1279) 0.1062 (0.0168) 0.2716 (0.1004) 0.3205 (0.1013) 0.1293 (0.0272) 0.5170 (0.0394) 0.2403 (0.1005) 0.2896 (0.0950) ζ 0.1202
(0.0003) 0.1100 (0.0030) 0.1301 (0.0001) 0.0607 (0.0007) 0.1103 (0.0006) 0.1305 (0.0007) 0.1978 (0.0017) 0.3076 (0.0023) 0.1001 (0.0005) 0.1105 (0.0006) u 0.0443 0.0478 0.0540 0.1317 0.0489 0.0536 0.0654 0.0323 0.0485 0.0507 Panel B: Risk measures