www.impactjournals.com/oncotarget/ Oncotarget, Vol. 7, No. 15
TGF-β1 and TGF-β2 abundance in liver diseases of mice and men
Anne Dropmann1, Tatjana Dediulia1, Katja Breitkopf-Heinlein2, Hanna Korhonen3 Michel Janicot3, Susanne N. Weber4, Maria Thomas5,6, Albrecht Piiper7, Esther Bertran8, Isabel Fabregat8, Kerstin Abshagen9, Jochen Hess10,11, Peter Angel12, Cédric Coulouarn13, Steven Dooley1, Nadja M. Meindl-Beinker1
1 Molecular Hepatology, Department of Medicine II, Medical Faculty Mannheim, University of Heidelberg, Heidelberg, Germany 2Department of Medicine II, Medical Faculty Mannheim, University of Heidelberg, Heidelberg, Germany
3 Isarna Therapeutics GmbH, Munich, Germany
4 Department of Medicine II, Saarland University Medical Center, Homburg, Germany 5 Dr. Margarete Fischer-Bosch Institute of Clinical Pharmacology, Stuttgart, Germany 6University of Tuebingen, Tuebingen, Germany
7 Medizinische Klinik 1, Klinikum der Johann Wolfgang Goethe-Universität, Frankfurt am Main, Germany 8 Bellvitge Biomedical Research Institute (IDIBELL) and University of Barcelona. L’Hospitalet, Barcelona, Spain 9 Institute for Experimental Surgery, Rostock University Medical Center, Rostock, Germany
10 Research Group Molecular Mechanisms of Head and Neck Tumors, German Cancer Research Center (DKFZ), Heidelberg, Germany
11 Section Experimental and Translational Head and Neck Oncology, Department of Otolaryngology, Head and Neck Surgery, University Hospital Heidelberg, Heidelberg, Germany
12 Division of Signal Transduction and Growth Control, DKFZ-ZMBH Alliance, German Cancer Research Center (DKFZ), Heidelberg, Germany
13 Institut National de la Santé et de la Recherche Médicale UMR991, University of Rennes, Pontchaillou University Hospital, Rennes, France
Correspondence to: Nadja M. Meindl-Beinker,e-mail:Nadja.Meindl-Beinker@medma.uni-heidelberg.de
Keywords:TGF-β isoform, mouse models, HCC, fibrosis, regeneration
Received: July 14, 2015 Accepted: January 01, 2016 Published: January 21, 2016
ABSTRACT
TGF-β1 is a major player in chronic liver diseases promoting fibrogenesis and tumorigenesis through various mechanisms. The expression and function of TGF-β2 have not been investigated thoroughly in liver disease to date. In this paper, we provide evidence that TGF-β2 expression correlates with fibrogenesis and liver cancer development.
Using quantitative realtime PCR and ELISA, we show that TGF-β2 mRNA expression and secretion increased in murine HSCs and hepatocytes over time in culture and were found in the human-derived HSC cell line LX-2. TGF-β2 stimulation of the LX-2 cells led to upregulation of the TGF-β receptors 1, 2, and 3, whereas TGF-β1 treatment did not alter or decrease their expression. In liver regeneration and fibrosis upon CCl4 challenge, the transient increase of TGF-β2 expression was accompanied by TGF-β1 and collagen expression. In bile duct ligation-induced fibrosis, TGF-β2 upregulation correlated with fibrotic markers and was more prominent than TGF-β1 expression. Accordingly, MDR2-KO mice showed significant TGF-β2 upregulation within 3 to 15 months but minor TGF-β1 expression changes. In 5 of 8 hepatocellular carcinoma (HCC)/hepatoblastoma cell lines, relatively high TGF-β2 expression and secretion were observed, with some cell lines even secreting more TGF-β2 than TGF-β1. TGF-β2 was also upregulated in tumors of TGFα/cMyc and DEN-treated mice. The analysis of publically available microarray data of 13 human HCC collectives revealed considerable upregulation of TGF-β2 as compared to normal liver.
www.impactjournals.com/oncotarget
INTRODUCTION
Currently, liver transplantation is the only
therapeutic option to fight terminal liver failure. The demand for new therapies increases due to the lack of donor organs and enormous economic costs, leading to a major medical problem. In chronic liver disease (CLD), tissue remodeling and wound healing are interrupted, resulting in complex modulation of signaling processes at the cellular and molecular level. Subsequent fibrosis is the onset of hepatic disease development including cirrhosis, HCC, or hepatic failure [1].
TGF-β is a homodimer that exists in three different isoforms (TGF-β1, TGF-β2 and TGF-β3) in mammals. All TGF-β precursor forms are secreted as latent homodimeric complexes, incorporated into the ECM, and activated by proteolytic cleavage [2]. Generally, the β1 and β2 isoforms are closely related and display about 70% amino acid sequence identity [3, 4]. All TGF-β ligands signal through the same receptor signaling systems [5], initiating various downstream signaling pathways [6]. The TGF-β receptors type I, II and III (TGFβR-I, TGFβR-II, and TGFβR-III) are expressed in almost every mammalian cell type, including cancer cells [7]. TGFβR-I and -II are essential for provoking the biological response of TGF-β isoforms [8], but can bind TGF-β3 and TGF-β1 with higher affinity than TGF-β2 [9–11]. TGFβRs-III (Betaglycan and Endoglin) are described to stabilize TGF-βs in a conformation that is optimal for binding to the signaling receptors. Betaglycan binds all TGF-β isoforms with high affinity [9, 10, 12] and significantly enhances the binding efficacy of TGF-β2 to TGFβR-II (reviewed in Massagué [13]). In contrast, Endoglin only binds TGF-β1 and TGF-β3, but not TGF-β2 [14].
The three isoforms have partly overlapping but non-redundant functions and act as potent regulators of cell growth, differentiation and migration. About 60% of mice lacking TGF-β1 already die in utero due to deficient endothelial cell differentiation, which underlines its function in embryogenesis [15]. Surviving mice develop severe multi-organ inflammatory responses in the heart, liver, pancreas, and other organs, and show increased numbers of mitochondria in the liver in response to stress [16, 17]. Mainly developmental defects have also been detected in mice lacking TGF-β2, affecting epithelial-mesenchymal interactions, cell growth, extracellular matrix production and tissue remodeling. TGF-β3 knockout mice also exhibit epithelial-mesenchymal interaction perturbances, evidenced in mice by abnormal lung development and cleft palate [18].
TGF-β1 plays a pivotal role in the development of tissue fibrosis where it stimulates the synthesis and accumulation of ECM components and reduces their degradation by matrix metalloproteinases [19]. In vitro, TGF-β2 and TGF-β3 have been reported to exert
profibrotic effects in fibrosis-related cell types [20, 21] such as fibroblasts. Accordingly, TGF-β2 has been described to be involved in the activation of mesenchymal cells and matrix production in fibrotic livers [22].
In cancer, TGF-β has a bidirectional role: It is
involved in the promotion and inhibition of cancer progression mainly depending on the tumor stage [23, 24], with TGF-β1 being the most widely investigated isoform in many human cancers [25]. Less is known about TGF-β2, which was first described to suppress the effects of interleukin dependent T-cell growth [26]. It is released by tumors of several origins including glioblastomas, breast cancer, melanoma, and others [27]. Immunosuppression induced by TGF-β2 is assumed to be a main mechanism by which tumor cells can escape from immune surveillance.
In the liver, all three isoforms are present, but they are not expressed homogeneously in all different cell types [28]. While TGF-β1 expression is often increased in liver cancer, suggesting a tumor-promoting effect [29, 30], little is known about TGF-β2 in this setting. One group has described high stromal expression of TGF-β2 in intrahepatic cholangiocarcinomas (ICC), which was accompanied by poor prognosis [31, 32, 33]. Other preliminary studies including only a few specimen describe all three isoforms as being overexpressed in HCC and proliferating bile ducts of fibrotic livers compared to normal liver [29, 34]. Moreover, overexpression of TGF-β2 and TGF-β3 but not TGF-β1 was found in cholangiocarcinoma [35]. Thus, with research mainly focusing on TGF-β1, to date only a few studies deal with the expression and function of TGF-β2 [36].
RESULTS
Expression of TGF-β1 and TGF-β2 in murine hepatocytes and HSCs
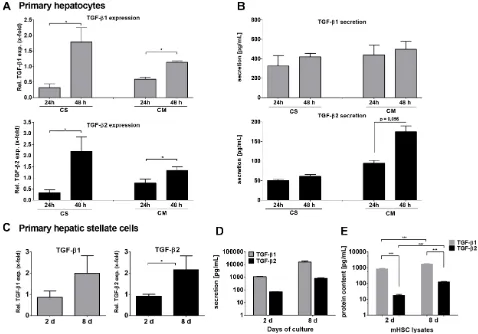
TGF-β1 and TGF-β2 mRNA expression was first determined in mouse hepatocytes by qPCR (Figure 1A). Hepatocytes were isolated from C57BL/6 wild type mice and cultured either on collagen monolayer (CM) to mimic deteriorating differentiated functions and non-polarized structure, or on collagen sandwich (CS), representing re-established hepatic polarity and stable differentiated functions [37]. In both settings, TGF-β1 and -β2 were increasingly expressed with culture duration after 24 and 48 hours. Induction was higher in CS than in CM for both cytokines. Although secreted at lower levels, the induction of TGF-β2 secretion after 48 h on CM was much stronger than that of TGF-β1 (Figure 1B). The discrepancy between the significant mRNA expression induction of both cytokines and the rather moderate induction of secretion over time suggests storage or intracrine usage of newly synthesized TGF-β in the cells [38] and requires further research.
It is well accepted that upon liver damage HSCs do express and secrete TGF-β1, thus inducing paracrine activation of quiescent HSCs, hepatocyte cytostasis in early stages and tumor-promoting effects in later stages of CLD. Here, we compared TGF-β2 mRNA expression and secretion in quiescent (2 days) and activated (8 days) primary murine HSCs. TGF-β2 mRNA expression, similar to TGF-β1, was increased within 8 days during HSC culture activation (Figure 1C). Furthermore, the secretion of both TGF-β isoforms was demonstrated after 2 days and was increased after 8 days (both ~10-fold). However, while only about 850 pg/ml TGF-β2 were secreted after 8 days, around 16,000 pg/ml TGF-β1 were detected at that time point (Figure 1D). ELISAs of cell lysates revealed that this divergence corresponded to different levels of protein in the cells. TGF-β1 content was stable after 2 and 8 culture days, but markedly higher than that of TGF-β2 (day 2 ~200-fold, day 8 ~10-fold), while intracellular TGF-β2 levels increased about 10-fold between 2 and 8 days (Figure 1E). We conclude from these data the existence of a cytokine specific maximal limit in the cells, which is reached for TGF-β1 already on day 2. Additionally produced cytokines were secreted continuously. Thus, 8-10-fold levels of both cytokines were found in the supernatant as compared to the cell lysates on day 8.
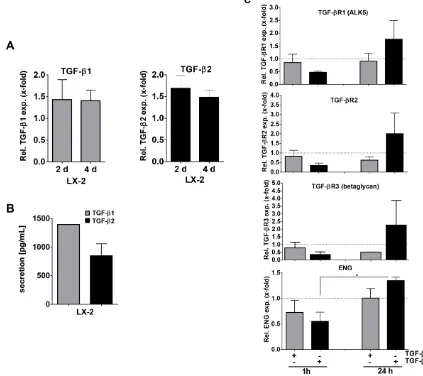
To translate our results to human HSCs and examine TGF-β1 and -β2 signaling in more detail, we next examined the human HSC cell line LX-2 with respect to TGF-β1 and -β2 expression. We found that both TGF-β1 and -β2 mRNA were expressed in LX-2 cells (Figure 2A). As expected in a cell line, TGF-β mRNA expression was stable when comparing 2 days and 4 days of culture. Secretion of TGF-β1 after 4 days was found to be about 1.5-fold higher than that of TGF-β2 (Figure 2B).
We then analyzed whether TGF-β1 or TGF-β2 secretion impacts on TGF-β signaling in HSCs. As it is known that TGF-β1 can influence the expression of its signaling receptors [39], we analyzed TGF-β receptor
expression in LX-2 cells treated with 10 ng/ml TGF-β2 in comparison to TGF-β1. Although LX-2 cells are known to be responsive to TGF-β1, e.g. displaying strong (1α) procollagen upregulation [40], TGF-β1 stimulation of LX-2 cells for 1 h or 24 h either decreased or did not alter TGF-β receptor expression compared to the basal expression levels (Figure 2C, dotted lines). In contrast, TGF-β2 stimulation decreased receptor expression after 1 h, but notably induced TGF-β receptor expression after 24 h (pendoglin ≤ 0.027). This suggests that TGF-β2 impacts TGF-β signaling in HSCs in a different manner than TGF-β1. Although Smad1, 2 and 3 phosphorylation efficiency was similar when comparing TGF-β1 and -β2 treatment for 1 or 24 hours, respectively (Supplementary Figure 1A), 24 h TGF-β2 pretreated LX-2 cells were sensitized for subsequent cytokine induced Smad1 signaling (Supplementary Figure 1B), probably due to the receptor upregulation described above. We therefore concluded that besides affecting TGF-β receptor
expression, TGF-β2 seems to impact especially pSmad1 signaling. Distinct mechanisms and outcomes (e.g., target gene expression) now need to be delineated.
Expression of TGF-β isoforms in CCl4-induced liver damage
After analyzing TGF-β1 and -β2 expression and secretion in hepatocytes and HSCs, we aimed to translate our findings into in vivo models of liver diseases. In a model of liver regeneration upon acute liver damage by
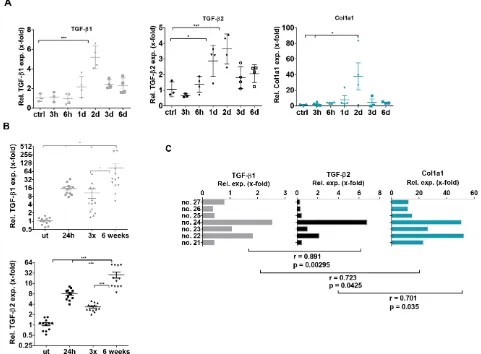
CCl4, we showed similar dynamics of TGF-β2 and TGF-β1 expression within 6 days by quantitative realtime (q)PCR. Expression of both isoforms peaked on day 2 after CCl4 administration. Remarkably, a similarly transient increase in collagen expression was noticed on day 2 (Figure 3A). Encouraged by the correlating behavior of both TGF-β isoforms, we extended this study to chronic liver damage induced by CCl4. Mice were treated either with one CCl4 injection, with 3 CCl4 injections within one week or with chronic treatment twice per week for six weeks. Also in this experiment, CCl4 treatment significantly enhanced TGF-β1 and -β2 expression. The highest expression of both isoforms was observed after six weeks of chronic treatment (Figure 3B). Interestingly, expression of both isoforms and collagen positively correlated in individual mice after six weeks of CCl4 treatment (Pearson Correlation Analysis p < 0.05) (Figure 3C).
TGF-β isoform expression in models of biliary-derived liver disease
www.impactjournals.com/oncotarget
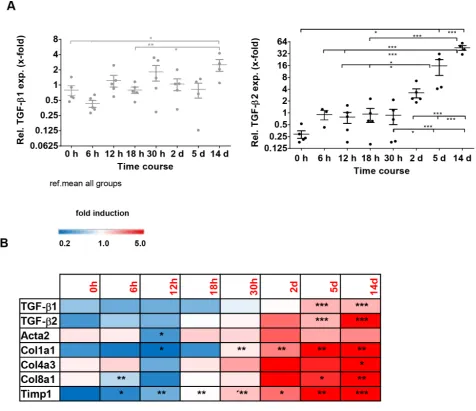
ligated (BDL) mice as a model for biliary fibrosis. These animals also displayed an elevation of TGF-β1 and -β2 expression within a time course of 14 days after BDL. However, while TGF-β2 was strongly induced after 14 days (~155-fold as compared to 0 h), there was only a slight induction of TGF-β1 expression during this period (~4-fold as compared to 0h) (Figure 4A), indicating a specific and probably more prominent role of TGF-β2 in biliary fibrosis. Time-resolved Fluidigm gene expression analysis revealed parallel induction of TGF-β1, TGF-β2 and different fibrosis markers (Acta2, Col1a1, Col4a3, Col8a1, Timp1) (Figure 4B), underlining the possible involvement of TGF-β2 in the fibrotic process.
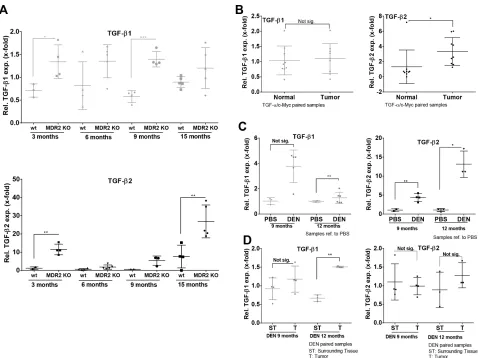
As TGF-β2 displayed a stronger regulation in the biliary fibrosis model than TGF-β1, we investigated the expression dynamics of both isoforms in MDR2-KO mice, a genetic model for cholestasis-based CLD. Using Fluidigm qPCR, MDR2-KO mice showed consistent TGF-β2 upregulation from 3 to 15 months compared to wild
type animals (Figure 5A, lower panel). Although TGF-β1 expression was significantly upregulated at the age of 3 (~2-fold) and 9 (~2.5-fold) months in MDR2-KO animals, upregulation of TGF-β1 was notably weaker than that of TGF-β2 (Figure 5A, upper panel). In detail the results were: after 3 months, TGF-β2 ~10-fold and TGF-β1 ~1.9-fold; after 6 months, TGF-β2 ~3-fold and TGF-β1 ~1.7-fold; after 9 months, TGF-β2 ~10-fold and TGF-β1 ~2.4 fold; and after 15 months, TGF-β2 ~3.5-fold and TGF-β1 ~1.3-fold.
Expression of TGF-β1 and TGF-β2 in murine HCC
[image:4.612.67.545.291.625.2]In MDR2-KO mice, TGF-β2 was strongly upregulated in very early stage CLD (3 months) as well as in late stage CLD (15 months). Generally, it is described that MDR2-KO mice develop cancer after about one year [41]. Thus, we decided to further analyze different HCC mouse models representing late or end stage CLD for
TGF-β2 expression. In TGFα/cMyc mice, significantly upregulated TGF-β2 expression but no upregulation of TGF-β1 expression was observed in tumor tissue compared to normal tissue (paired samples) (Figure 5B). TGF-β2 was also upregulated in tumors of DEN-challenged mice compared to untreated controls after 9 and 12 months, but not in comparison to surrounding tissue (Figure 5C–5D). After 12 months, TGF-β1 mRNA was significantly increased in tumors of DEN-treated mice compared to corresponding controls (Figure 5C, left) and in comparison to surrounding tissue of the same animals (Figure 5D, left).
Expression of TGF-β1 and TGF-β2 in human HCC cell lines
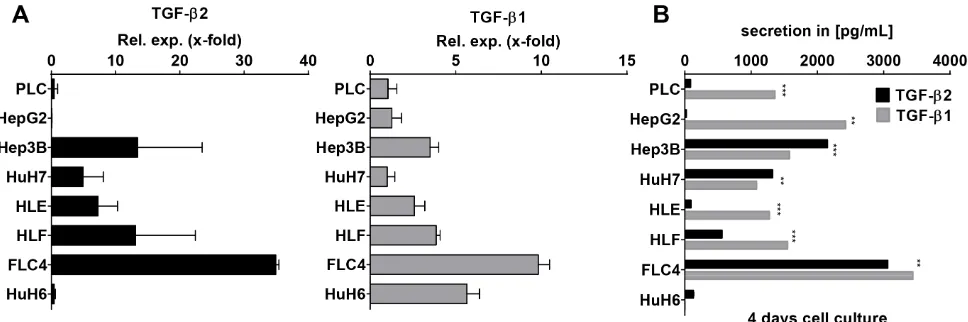
As it is most relevant to translate our findings from mouse models to human samples, TGF-β2 and TGF-β1 mRNA expression levels were investigated in
7 different hepatocellular carcinoma cell lines and one hepatoblastoma cell line (HuH6) (Figure 6A). TGF-β2 was expressed in FLC-4, Hep3B, HLF, HLE, and HuH7 cells with decreasing extent in the respective order. HuH6, PLC, and HepG2 expressed very low amounts of TGF-β2. After 4 days of culture, secretion of TGF-β2 was low in PLC, HLE, HepG2, and HuH6 cells, but was high and in a similar range as TGF-β1 in Hep3B, HuH7, HLF, and FLC-4 cells (Figure 6B). Interestingly, in Hep3B and HuH7 cells, TGF-β2 secretion even exceeded TGF-β1 secretion significantly (pHep3B ≤ 6E–05;
pHuH7 ≤ 0.0024). Knockdown of TGF-β2 using a specific antisense oligonucleotide (AON) revealed significant downregulation of the cell number and the expression of the proliferation marker PCNA in HuH7 (Supplementary Figure 2). Whether this accounts for compensatory or tumorigenic proliferations needs to be studied in the future. Together, our data suggest that TGF-β2 plays a noteworthy role in the cytokine signaling of distinct
[image:5.612.89.512.297.673.2]www.impactjournals.com/oncotarget
HCC cell lines, which might be independent and have a different outcome than that of TGF-β1.
TGF-β1 and TGF- β2 expression in cirrhotic and HCC patients
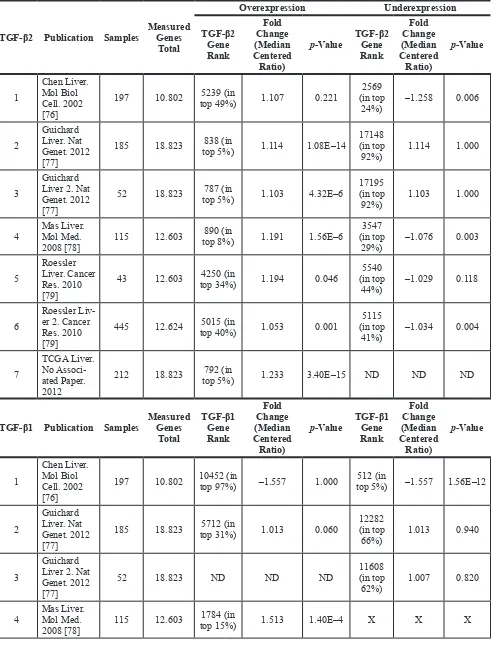
Taken together, the analysis of HCC cell lines revealed significant TGF-β2 expression and secretion of HCC cells and mouse data suggest significant upregulation of TGF-β2 within liver tumor tissue (and not only of TGF-β1). Based on that knowledge, we investigated the occurrence of TGF-β isoforms in human HCC patients. The Oncomine® database was searched in order to analyze TGF-β expression in different HCC patient cohorts. 4 of 7 studies reported TGF-β2 upregulation, whereas only one described TGF-β2 downregulation. TGF-β2 was one of the top 5–10% upregulated genes, while detected downregulation was less prominent (within 25% of downregulated genes). In the same cohorts, TGF-β1 was
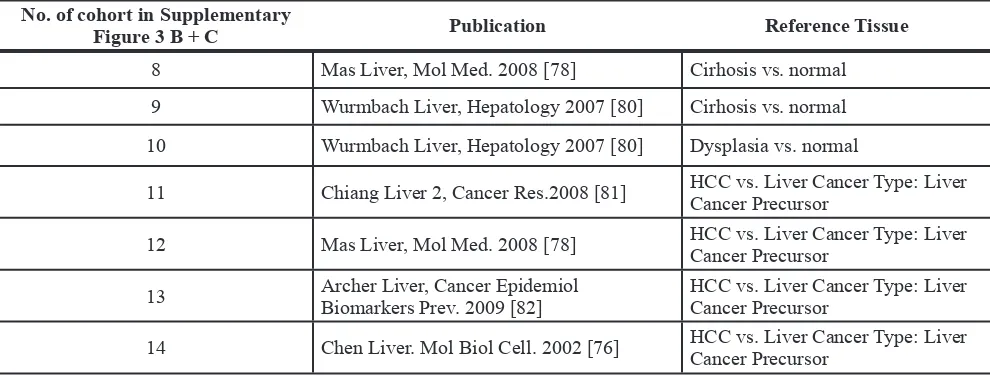
reported to be upregulated in two studies (within 25% of the most upregulated genes) and downregulated in two other studies (within 25% of the top downregulated genes) (Table 1 and Supplementary Figure 3A). Analyzing cirrhotic patient cohorts via Oncomine®, we detected a continuous increase of TGF-β1 in line with disease progression from healthy via cirrhosis to HCC. In contrast, TGF-β2 expression was higher at the cirrhosis stage than in normal liver and even higher than in HCC (Table 2, Supplementary Figure 3B–3C), suggesting a different regulation mechanism of the two isoforms during disease progression (Supplementary Figure 3D).
[image:6.612.67.548.296.650.2]We then decided to take a closer look at six further HCC cohorts. First, we selected those cohorts that exhibited significant p-values (p < 0.05) regarding TGF-β1 and/or TGF-β2 regulation in the respective studies (896 patients in total, summaries in Tables 3, 4, 5). It is worth noting that the p-value for expression changes provided was neither significant for TGF-β1 in the
Figure 3: TGF-β1, TGF-β2 and Collagen 1a1 expression in acute and chronic CCl4- induced liver damage. (A) Within six days, expression dynamics of TGF-β1 and –β2 and Collagen 1a1 in the CCl4 regeneration model (1 hit) were determined by qPCR in comparison to untreated controls (B) TGF-β1 and –β2 mRNA expression was assessed 24 h after 1 CCl4 injection, 3 injections within one week or two injections per week for six weeks as indicated. (C) TGF-β1 and –β2 expression were correlated with Col 1a1 expression in 7 individual mice with chronic liver damage (6 weeks treatment). Pearson coefficients were rTGF-β1/TGF-β2 = 0.891, rTGF-β1/Col1A = 0.723,
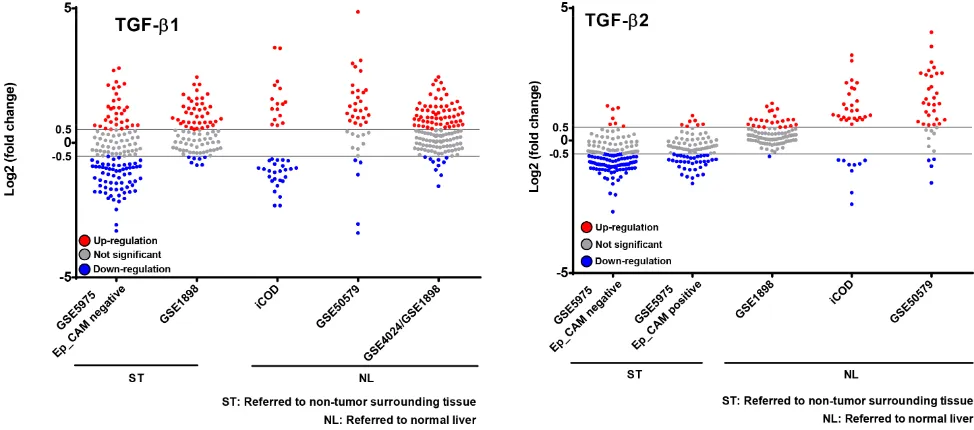
GSE5975 EpCAM positive and the GSE14520 cohorts, nor for TGF-β2 in the GSE4024/GSE1898 and GSE14520 cohorts. Thus, they were excluded from this analysis. We then applied the selection criteria < −0.5 and > 0.5 Log2 (fold change) to the analysis of individual patients´ expression data (single dots). Summarizing the results, TGF-β1 and -β2 were mainly upregulated compared to normal liver; however, a downregulation of TGF-β2 was obvious compared to surrounding tissue of the tumors (Figure 7). This implies that tumor-surrounding tissue itself is significantly altered as compared to normal liver and already displays changed TGF-β signaling signatures. Due to these and other specific changes of the tumor environment, which are known to impact tumorigenesis, expression changes need to be carefully investigated dependent on the context. Interestingly, analyzing patients
with defined TGF-β2 regulation in GSE1898/4024, we found a correlation between high TGF-β2 expression and a poorer survival rate (p < 0.01) (Supplementary Figure 4), but not with other clinicopathological parameters including AFP levels, tumor size, differentiation grade, cirrhosis, and hepatoblast vs. hepatocyte subtype (data not shown), further suggesting tumor-promoting effects of TGF-β2.
DISCUSSION
[image:7.612.69.545.257.668.2]In liver disease, TGF-β1 is described as a key player in the activation of myofibroblasts [42], hepatocyte apoptosis, and proliferation control [43]. Over the decades, its involvement in different stages of CLD and cancer has been investigated and discussed on a broad basis, and a lot
www.impactjournals.com/oncotarget
of information has been gathered since then. However, the TGF-β family consists of three isoforms with overlapping, but not redundant functions [24].
We comparatively investigated TGF-β1 and -β2 expression in liver cells and diseased livers in various stages of progression. Probably due to more sensitive detection methods, we found that just like TGF-β1, TGF-β2 is expressed in and secreted by both, healthy and diseased hepatocytes and HSCs. This is in contrast to some basic results reported about 25 years ago, where weak TGF-β1 expression was only found near central veins and TGF-β2 was only expressed in bile duct epithelial cells [44, 45]. However, those studies performed in the 1990s focused on the differences in isoform expression between different liver cell types. This led to underestimation of low expression or low signals were not interpreted as significant in comparison to strong signals, e.g., in Kupffer and bile duct cells.
In various models of regeneration, acute and chronic liver disease presented here, we were able to confirm knowledge of the expression patterns of
[image:8.612.65.547.306.664.2]TGF-β1 in liver disease. Reported information available on TGF-β2 in CLD and HCC is less comprehensive so far; however, it implies that TGF-β2 also acts in a profibrogenic and tumorigenic manner in different organs, including the liver. Wang et al. [46] demonstrated that i.p. administration of TGF-β2 in conjunction with CTGF - but not by itself - induced fibrosis of almost all abdominal organs, including the liver. This effect was rather systemically than organ-specific, but multifocal fibrosis of the hepatic capsule plus multiple foci of mild parenchymal fibrosis were detected. Since then, the role of TGF-β2 in fibrogenic mechanisms could be related to a variety of signaling mechanisms, which are partly based on canonical Smad2/3 signaling. In patients with chronic Hepatitis C and advanced fibrosis, upregulation of TGF-β2 correlated well with Smad2 expression [47]. Another indication of canonical TGF-β2 signaling was provided by Wang et al. [48], when they observed diminished TGF-β2 expression and subsequent Smad3 activity upon miR-200a treatment in renal fibrogenesis.
However, non-canonical signaling and crosstalk of TGF-β2 have also been reported by different groups. A Wnt-TGF-β2 axis was discovered in muscle stem cells [49] and a study performed by Sun et al. [50] revealed TGF-β2 and β-Catenin as the two main functional targets of miR-200a expression in hepatic fibrosis. Further, Dong et al. uncovered a universal organ size control mechanism in metazoan, showing that Yap overexpression in the liver increased liver mass in transgenic mice extensively and strongly induced TGF-β2 expression [51, 52]. Together, these findings indicate possible mechanistic links for TGF-β2 and provide rationales for investigating these pathways in liver disease of different origins.
Although our data do not provide experimental evidence for mechanistic details so far, we have shown that in liver regeneration processes in which proliferation and apoptosis events need to be tightly controlled, TGF-β2 is upregulated. During regeneration, expression of both isoforms of TGF-β peaked after day 2, coincident with collagen expression. For TGF-β1, this has been known for a long time; however, our data imply a similar importance of TGF-β2 in these regenerative processes. After repeated chemical intoxication, both TGF-β isoforms were further elevated simultaneously, suggesting a parallel and maybe synergistic function of the two isoforms in CCl4-induced progression of liver damage.
In contrast to this concordant behavior in CCl4 intoxication related liver disease, TGF-β2 expression patterns differed from those of TGF-β1 in biliary-derived models of liver damage. Interestingly, TGF-β2 was more significantly elevated in mice with bile duct ligation and at different time points of liver disease progression in MDR2-KO mice. This suggests a specific role of TGF-β2 in the development of biliary-derived liver damage, which was already implicated in early results obtained by Milani et al., who described more prominent expression of TGF-β2 than TGF-β1 in bile duct epithelial cells, and particularly high TGF-β2 levels in proliferating bile ducts
of fibrotic livers [53]. While a small study including eight twins (E-MTAB-2347) did not reveal TGF-β2 deregulation in primary biliary cirrhosis (PBC), Shakel et al. [54] reported on upregulation of TGF-β2 in PBC, thus providing a further link between TGF-β2 and biliary-derived liver diseases.
In a study including 87 ICC patients, TGF-β2 expression was linked to bad survival and its overexpression in the ICC stroma was significantly associated with ICC classification, microvascular invasion, and the presence of hilar lymph nodes [33], indicating TGF-β2 as a possible prognostic marker for the clinical outcome of ICC and HCC. Recently, a brief report by Fan et al. [55] elegantly used fate tracing experiments to show that cholangiocarcinoma not only originates from biliary cells, but might also develop from a hepatocellular source. These data and our findings demonstrating TGF-β2 expression in diseased liver cells, total liver and HCC lysates and its possibly special role in biliary diseases suggest studying the role of TGF-β2 in hepatocyte-derived cholangiocarcinomas in the future.
In the past, different HCC cell lines where thoroughly investigated regarding the expression of TGF-β1 [39, 56]. We were now able to show that almost all cell lines with high TGF-β1 mRNA expression also express high levels of the TGF-β2 isoform (r = 0.811; p = 0.015, data not shown). Most remarkably, two cell lines (Hep3B and HuH7) secreted even more TGF-β2 than TGF-β1, suggesting that tumorigenic signaling alteration in these cells is significantly affected by TGF-β2 signaling. Tschaharganeh et al. for example report that TGF-β2 expression is specifically downregulated in YAP-deficient HuH7 cells [51].
[image:9.612.65.549.521.682.2]In other cancer entities, further TGF-β2 dependent tumorigenic mechanisms have been discovered that might also play a role in liver cancer. Thus, TGF-β2 was able to drive tumor cell dormancy in a head and neck squamous cell carcinoma model in cooperation with
www.impactjournals.com/oncotarget
Table 1:
HCC sample cohorts used for Oncomine
®Research Edition based analysis of TGF-β1 and
TGF-β2 expression
TGF-β2 Publication Samples Measured Genes
Total
Overexpression Underexpression
TGF-β2 Gene Rank
Fold Change (Median Centered
Ratio)
p-Value TGF-β2 Gene Rank
Fold Change (Median Centered
Ratio)
p-Value
1
Chen Liver. Mol Biol Cell. 2002 [76]
197 10.802 top 49%)5239 (in 1.107 0.221 (in top 2569
24%) –1.258 0.006
2
Guichard Liver. Nat Genet. 2012 [77]
185 18.823 top 5%)838 (in 1.114 1.08E–14 (in top 17148
92%) 1.114 1.000
3
Guichard Liver 2. Nat Genet. 2012 [77]
52 18.823 top 5%)787 (in 1.103 4.32E–6 (in top 17195
92%) 1.103 1.000
4 Mas Liver. Mol Med.
2008 [78] 115 12.603
890 (in
top 8%) 1.191 1.56E–6
3547 (in top
29%) –1.076 0.003
5
Roessler Liver. Cancer Res. 2010 [79]
43 12.603 top 34%)4250 (in 1.194 0.046 (in top 5540
44%) –1.029 0.118
6
Roessler Liv-er 2. CancLiv-er Res. 2010 [79]
445 12.624 top 40%)5015 (in 1.053 0.001 (in top 5115
41%) –1.034 0.004
7
TCGA Liver. No Associ-ated Paper. 2012
212 18.823 top 5%)792 (in 1.233 3.40E–15 ND ND ND
TGF-β1 Publication Samples Measured Genes
Total
TGF-β1 Gene Rank
Fold Change (Median Centered
Ratio)
p-Value TGF-β1 Gene Rank
Fold Change (Median Centered
Ratio)
p-Value
1
Chen Liver. Mol Biol Cell. 2002 [76]
197 10.802 10452 (in top 97%) –1.557 1.000 top 5%)512 (in –1.557 1.56E–12
2
Guichard Liver. Nat Genet. 2012 [77]
185 18.823 top 31%)5712 (in 1.013 0.060 (in top 12282
66%) 1.013 0.940
3
Guichard Liver 2. Nat Genet. 2012 [77]
52 18.823 ND ND ND (in top 11608
62%) 1.007 0.820
4 Mas Liver. Mol Med.
2008 [78] 115 12.603
1784 (in
TGFβR-I, TGFβR-III and p38α/β. Accordingly, in lymph node metastatic cells, pp38, pSmad2 and pSmad1/5 were activated, while CDK4 was reduced by TGF-β2. This was in contrast to the effects of TGF-β1, arguing for independent actions of the two isoforms [57].
This is in line with our Oncomine®-based HCC cohort analysis, showing TGF-β2 upregulation in HCC as compared to normal liver, unlike TGF-β1, which was either not regulated or downregulated. Furthermore, this assumption is also valid for our in vivo mouse models of HCC. While TGF-β1 was significantly altered in tumors compared to surrounding tissue in DEN-induced HCC, TGF-β2 expression was significantly affected in tumors of TGFα/cMyc mice and DEN-treated mice compared to healthy liver. These data imply etiology specific-regulation of TGF-β2 in liver disease and the importance of the tumor environment. Differential expression of signaling
components in normal liver vs. tumor surrounding tissue and vs. tumor tissue has to be analyzed carefully, as tumor-surrounding tissue in the liver can hardly be considered to be healthy and is known to impact tumorigenesis on its own. Consequently, expression changes in the tumor as well as in the surrounding tissue do impact patient survival, while the ratio of the two expression levels does not necessarily reveal survival-relevant information [58].
One further step of complexity is provided to TGF-β isoform specific disease mechanisms by results showing an interdependence of the signaling of the different TGF-β isoforms. In the human cancer cell lines, DU145 (human prostate adenocarcinoma) and A375 (human skin melanoma), Oh and colleagues [59] demonstrated that suppression of TGF-β1 induced TGF-β3 upregulation and therefore they may compensate each other for some, thus far unknown functions. Suppression of TGF-β2 induced
5
Roessler Liver. Cancer Res. 2010 [79]
43 12.603 top 15%)1836 (in 2.225 3.09E–4 (in top 5267
42%) –1.071 0.093
6
Roessler Liv-er 2. CancLiv-er Res. 2010 [79]
445 12.624 top 45%)5677 (in 1.098 0.043 (in top 3088
25%) –1.111 3.69E–7
7
TCGA Liver. No Associ-ated Paper. 2012
212 18.823 top 32%)5854 (in 1.027 0.021 (in top 12130
65%) 1.027 0.979
Total number of samples, number of genes measured, p-values, gene ranks, and the fold change are given for TGF-β1 and
[image:11.612.59.554.296.484.2]TGF-β2 as indicated. Additionally, the table summarizes in which range of differentially expressed genes the respective gene was found in the study (top %). ND = not detected in the study.
Table 2: Liver cancer precursor and cirrhosis cohorts used for Oncomine® Research Edition based analysis of TGF-β1 and TGF-β2 expression
No. of cohort in Supplementary
Figure 3 B + C Publication Reference Tissue
8 Mas Liver, Mol Med. 2008 [78] Cirhosis vs. normal
9 Wurmbach Liver, Hepatology 2007 [80] Cirhosis vs. normal
10 Wurmbach Liver, Hepatology 2007 [80] Dysplasia vs. normal
11 Chiang Liver 2, Cancer Res.2008 [81] HCC vs. Liver Cancer Type: Liver Cancer Precursor
12 Mas Liver, Mol Med. 2008 [78] HCC vs. Liver Cancer Type: Liver Cancer Precursor
13 Archer Liver, Cancer EpidemiolBiomarkers Prev. 2009 [82] HCC vs. Liver Cancer Type: Liver Cancer Precursor
14 Chen Liver. Mol Biol Cell. 2002 [76] HCC vs. Liver Cancer Type: Liver Cancer Precursor
www.impactjournals.com/oncotarget
downregulation of both, TGF-β1 and TGF-β3 and raises
the assumption of a common transcription factor regulated by TGF-β2. Studies by Hellerbrand underlined the fact that the TGF-β2 and -β3 isoforms do not compensate the lack of TGF-β1 in the context of HSC activation in vivo, although HSCs were activated, suggesting participation of the other TGF-β isoforms [60]. Not only specific isoform
depletion affected TGF-β isoform expression, also TGF-β1 treatment could induce the expression of TGF-β2 via Rho kinase signaling as shown in data from Shimada et al. [36].
[image:12.612.58.560.69.327.2]In summary, we directly compared the expression dynamics of TGF-β1 and TGF-β2 in the progression of liver disease of different etiologies for the first time in cell lines, animal models, and human patients. Our data suggest
Table 3: HCC sample cohorts used for analysis of TGF-β1 and TGF-β2 expression
Publication Array
Name
N°HCC
Patients HCC Etiologies Normal Liver Surrounding Tissue
Roessler S. Cancer Res.
2010 [79] GSE14520 247 HBV 247
Wang XW. Clin Cancer
Res., 2007 [83] GSE5975 236 Ep_CAM +/−; HBV+; Cirrhosis +/- 236
Thorgeirsson S. Nature
Genetics 2004 [84] GSE1898 91
HBV+; HCV+; co-infection; HBV/ Alcohol; HCV/Alcohol,
Hemochro-matosis 91
Neumann O. Hepatology
2012 [85] GSE50579 40
HBV+; HCV+; co-infection; Alco-hol; Cryptogenic;
Hemochromato-sis; Others 7
Shimokawa K. BMC
Genomics. 2010 [86] iCOD 140
HBV+; HCV+; co-infection; Alco-hol; HCV+ Alcohol, Diabetes;
Cir-rhosis; Unknown NA
Thorgeirsson S. Nature Genetics 2004 [84]
Lee JS et al. Nat Med 2006 [87]
GSE4024/
GSE1898 142
HBV+; HCV+; co-infection; Alco-hol; Cryptogenic; Hemochromato-sis; ALD; NASH; Adenoma; Autoimmune; Unknown; Others
10
NA= not announced in the study.
Figure 7: Patient-resolved expression of TGF-β1 and TGF-β2 in different human HCC collectives. Free accessible databases (see Table 3) were used to investigate TGF-β1 and TGF-β2 expression in human HCC cohorts. Cohorts with significant p-values
[image:12.612.62.549.458.673.2]Table 4: Significance of TGF-β1 and TGF-β2 expression changes in different HCC sample cohorts
TGF-β1 N°HCC Patients adj. p-value Mean Log2 (Fold Change)
GSE1898 91 2,53651E–07 0,47
GSE5975 EpCAM negative 142 0,00090135 −0,34
GSE5975 EpCAM positive 94 (0,36864697) −0,08
iCOD 140 NA −0,72
GSE50579 40 0,008 1,13
GSE4024/GSE1898 142 0,05 0,67
GSE14520 247 (0,35) 0,04
TGF-β2 N° HCC Patients adj. p-value Mean Log2 (Fold Change)
GSE1898 91 1,01742E–07 0,25
GSE5975 EpCAM negative 142 6,0118E–21 −0,57
GSE5975 EpCAM positive 94 2,25993E-09 −0,36
iCOD 140 NA 0,74
GSE50579 40 0,0001 1,42
GSE4024/GSE1898 142 (0,83) −0,03
GSE14520 247 (0,36) 0,01
Number of patients, p-values and fold change of TGF-β1 and TGF-β2 expression in the respective patient cohorts are listed. Only those cohorts with significant p-values were used for further analysis (See Figure 7). Non-significant p-values are given in brackets. NA = Not announced.
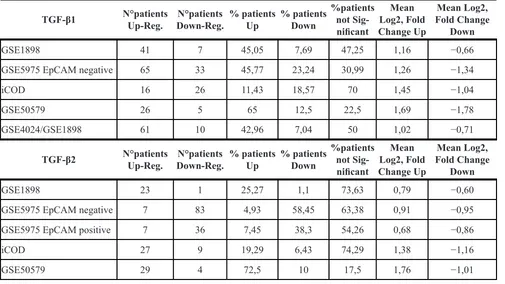
Table 5: Detailed analysis of HCC patient cohorts given in table 3 in regard to TGF-β1 and TGF-β2 up- and down-regulation
TGF-β1 N°patients Up-Reg. Down-Reg.N°patients % patients Up % patients Down %patients not Sig-nificant
Mean Log2, Fold Change Up
Mean Log2, Fold Change
Down
GSE1898 41 7 45,05 7,69 47,25 1,16 −0,66
GSE5975 EpCAM negative 65 33 45,77 23,24 30,99 1,26 −1,34
iCOD 16 26 11,43 18,57 70 1,45 −1,04
GSE50579 26 5 65 12,5 22,5 1,69 −1,78
GSE4024/GSE1898 61 10 42,96 7,04 50 1,02 −0,71
TGF-β2 N°patients Up-Reg. Down-Reg.N°patients % patients Up % patients Down %patients not Sig-nificant
Mean Log2, Fold Change Up
Mean Log2, Fold Change
Down
GSE1898 23 1 25,27 1,1 73,63 0,79 −0,60
GSE5975 EpCAM negative 7 83 4,93 58,45 63,38 0,91 −0,95
GSE5975 EpCAM positive 7 36 7,45 38,3 54,26 0,68 −0,86
iCOD 27 9 19,29 6,43 74,29 1,38 −1,16
GSE50579 29 4 72,5 10 17,5 1,76 −1,01
[image:13.612.58.563.412.696.2]www.impactjournals.com/oncotarget
that distinct and independent as well as parallel roles exist for the two TGF-β isoforms in liver regeneration and the development of CLD. The significance and the mechanistic details of TGF-β2 regulation and effects are possibly etiology-dependent and have to be delineated. Specific multivariate analyses need to be performed and evaluated in order to make TGF-β2 a promising new candidate and target for the development of liver therapeutics.
MATERIALS AND METHODS
Ethics statement
This investigation has been conducted in accordance with ethical standards, the Declaration of Helsinki, and according to national and international guidelines, and has been approved by the authors’ institutional review board.
Cell culture
Human hepatocellular cancer cell lines -HepG2, Hep3B, PLC/PRF, HLE, HLF, FLC-4, and HuH7-, and the human HSC cell line Lieming Xu (LX)-2 [40] were cultured in Dulbecco’s modified Eagle’s medium (Lonza, Basel) with 10% fetal bovine serum for HCC cell lines, respectively 2% for LX-2 cells, 1% penicillin (100 IU/ml)/streptomycin (100 μg/ml), and 2 mM glutamine. Human hepatoblastoma cell line HuH6 cells were cultured in RPMI 1640 medium (Lonza, Basel) with 10% fetal bovine serum, 1% P/S and 1% glutamine. The cells were maintained in a 37°C humidified atmosphere containing 5% CO2.
24 hours prior to the HCC cell line and the HSC line experiments, medium was changed to ‘starvation medium’ with 0.5% FBS. 10 ng/ml TGF-β (PeproTech GmbH, Hamburg, Germany) were used for treatment.
FLC-4 is a derivative cell line of JHH-4, and was obtained by starvation mutation from JHH-4 [61]. Detailed cell line information about JHH-4 can be obtained at http://cellbank.nibio.go.jp/~cellbank/en/ search_res_det.cgi?ID=1365.
Isolation and culturing of primary murine hepatocytes
Primary hepatocytes were isolated from livers of male C57BL/6 wild type mice by collagenase perfusion [62]. The cells were plated on collagen-coated plates and cultured in Williams E medium supplemented with with 10% fetal bovine serum, 1% penicillin (100 IU/ml)/streptomycin (100 μg/ml), 2 mM glutamine and 0,1% Dexamethasone. After 4 hours of attachment, the cells were overlayed with Williams medium for monolayer or with collagen and medium for sandwich culture. Collagen sandwich culture was performed as previously described [37].
Isolation of primary mouse HSCs
Primary HSCs were isolated from female BALB/c wild type mice by pronase/collagenase digestion followed by density gradient centrifugation and were cultured on plastic dishes in DMEM, supplemented with 4 mM L-glutamine, 10% FBS, and penicillin (100 IU/ml)/ streptomycin (100 μg/ml) as described in [63].
Reagents
All general chemicals were purchased from Carl Roth GmbH, Karlsruhe or from Sigma-Aldrich Co., USA, unless otherwise stated, and were of the highest quality.
Animal models
CCl4-induced liver injury
Acute liver injury was induced in 8-weeks old C57BL/6 mice (4 animals per group) through intraperitoneal injection of 1 ml/kg body weight
CCl4 (mixed 1:8 with mineral oil), and the mice were
sacrificed at 0 h, 3 h, 6 h, day 1, day 2, day 3, or day 6 post injection [64]. For chronic liver injury, C57BL/6 or BALB/c mice received i.p. injections of CCl4 (0.7 ml/kg
body weight in mineral oil) twice a week for six weeks (nut = 12; n24h = 12; n3x = 13; n6wk = 12 animals per group). The animals were sacrificed at indicated time points and the liver samples were immediately snap-frozen in liquid nitrogen. Specimen sampling was performed for RNA, protein, serum, and immunohistochemical analyses.
Bile duct ligation (BDL) – induced cholestatic liver injury
The surgical procedure was carried out as previously described by Abshagen et al. [65, 66]. Under isoflurane anesthesia (1.5 vol%) male BALB/c mice (n = 3–5) were placed on a heat pad and laparatomized. The common bile duct was isolated, ligated three times with non-resorbable sutures (polyester 5–0; Catgut, Markneukirchen, Germany), and cut between the two gut-near ligatures. Sham-operated mice underwent a laparotomy with exposure but not ligation of the bile duct (0 h). The abdominal muscle and skin layers were stitched and the mice were treated with metamizole as an analgesic in their drinking water. The animals were allowed to recover from anesthesia and surgery under a red warming lamp and were held in single cages. After 0, 6, 12, 18, or 30 hours or 2, 5, or 14 days mice were killed to obtain blood and liver samples (n =3–5).
MDR2-KO model
Mdr2−/− mice (MDR2-KO) and control wild
with age-matched male mice. Genotyping was done as described elsewhere [67], and liver and blood samples were obtained at the corresponding time points as described previously [68].
DEN model - chemical-induced liver carcinogenesis
Male mice at 15 days of age received intraperitoneal injections of DEN (5 mg/kg) diluted in saline buffer; the control animals were injected with saline buffer intraperitoneally. At the indicated time points, the mice were sacrificed and their livers removed. Total RNA was isolated from frozen tissues to analyze gene expression by real-time quantitative PCR. Three to four animals per condition and two different tissue pieces per animal were processed for RNA extraction [69].
TGFα/cMyc transgenic mouse model for hepatocarcinogenesis
Double transgenic TGFα/cMyc mice were generated by crossing c-Myc mice with TGF-α mice as described in [70]. In male TGFα/cMyc mice, hepatocarcinogenesis was triggered by the addition of ZnCl2 to the drinking water.
Tumor development in the liver was detected by Gd-EOB-DTPA-enhanced magnetic resonance imaging [71]. Tumor and normal liver tissue were dissected and frozen at −80°C until use.
RNA isolation and cDNA synthesis
Total RNA was extracted according to the
manufacturer’s instructions using either peqGOLD
RNAPure (Peqlab Biotechnologie, Erlangen, Germany) or with Trizol reagent (Life Technologies) and were purified via chloroform extraction or using the High Pure RNA Isolation Kit (Roche). The RNA concentration was determined with the help of the Tecan infinite M200 Microplate reader (Tecan, Switzerland). Subsequently, cDNA was synthesized from 0.5–1 μg RNA with the Transcriptor First Strand cDNA Synthesis Kit (Roche).
Quantitative real-time PCR
Real-time polymerase chain reaction (qPCR) was carried out with Power SYBR Green (Life Technologies) or TaqMan Universal Master Mix II (Life Technologies) using the Stratagene MX 3005 P system. The primers and probes are listed in supplementary Tables 1 and 2, respectively. To ensure that the primers produced specific PCR amplification products, a dissociation curve was analyzed to guarantee specificity. (Only primers with a unique dissociation peak were selected). To compensate for the variation between qPCR runs, the target gene expression was normalized to the expression of the endogenous, unregulated reference gene rS18 or PPIA.
The relative quantity of target genes was determined according to the ΔΔCt (“delta-delta”) method [72].
High-throughput gene expression analysis using microfluidic fluidigm’s biomark HD quantitative chip platform
For high-throughput quantitative Taqman qPCR analysis, we used the microfluidic Fluidigm’s BioMark HD high-throughput quantitative chip platform (Fluidigm Corporation, San Francisco, CA, USA) with pre-designed gene expression assays from Life Technologies according to the manufacturer’s instructions [73] and as previously described [74]. The data were analyzed using the ΔΔCt
method [75] and the expression values were normalized to the expression levels of the housekeeping genes (β-actin, tubulin, GAPDH).
TGF-β2 inhibition using antisense oligonucleotides (AONs)
HuH7 cells were cultured at medium density to perform AON experiments. TGF-β2 inhibition oligonucleotides were provided by Isarna Therapeutics. AON or scrambled oligonucleotide transfection was performed using RNAiMAX (Invitrogen, Darmstadt, Germany) according to the manufacturer’s protocol. Knockdown efficiency was verified by qPCR. The final AON and scrambled control concentration was 20 nmol. Knockdown was allowed to establish for 48h in medium supplemented with 2% FBS.
ELISA
Enzyme-linked immunosorbent assays (ELISAs) were performed to estimate the levels of secreted TGF-β1 and TGF-β2 in cell supernatants after normal cell culture. For lysates, the cell culture medium was removed by centrifugation, Cell Lysis Buffer 1 (R & D Systems) was added to the cell pellet and the mixture was allowed to incubate for 60 minutes with gentle agitation. After activating TGF-β through acidification in the collected supernatants or lysates, ELISAs were performed according to the manufacturer’s instructions for Quantikine human TGF-β1 or murine TGF-β1 (R & D Systems, Minneapolis, USA) or Quantikine human TGF-β2 or murine TGF-β2 (R & D Systems, Minneapolis, USA), respectively. For measuring TGF-β1 and TGF-β2 secretion of murine HSCs, an ELISA-based system, Luminex, was purchased from BioRad.
Immunoblot
www.impactjournals.com/oncotarget
(Cell Signaling Technology), pSmad1/3 (Abcam), and GAPDH (Santa Cruz) were used according to the manufacturer’s recommendations. HRP-conjugated secondary antibodies were goat anti-rabbit IgG-HRP or goat anti-mouse IgG-HRP (Santa Cruz). Protein detection was performed using the Super Signal West Dura Extended Duration Substrate (Thermo Scientific). All experiments were performed multiple times.
Statistical analysis
Error bars represent standard error to the mean. Deviations were used, unless described otherwise; two-tailed Student-t tests or one-way ANOVA were
used to calculate the p-values. Additionally, Pearson correlation was performed. Differences were considered to be significant if the calculated p-value was *p < 0.05, **p < 0.01, ***p < 0.001; the p-values were not significant if not indicated.
Patient collectives
Publicly available databases (iCOD omics.tmd. ac.jp/icod_pub_eng/; Oncomine https://www.oncomine. org/; GEO, http://www.ncbi.nlm.nih.gov/gds; and Arrayexpress, http://www.ebi.ac.uk/arrayexpress/), as well as data generated within the former SFB/TRR77 on Liver Cancer (GSE50579; GEO ID) and those collected from our own collaborative projects, were used in order to analyze expression of TGF-β1 and TGF-β2. The tools Bioconductor (R) 2.13 (3.0.1) and GraphPad Prism 6 were used to retrieve and analyze data from six HCC sample cohorts (GSE5975, GSE1898, GSE50579, iCOD, GSE4024/GSE1898, GSE14520) comprising a total number of 896 HCC patients, presented from different etiologies. The expression values were matched to normal liver samples and/or to each patient´s surrounding non-cancer tissue. The following criteria were used at different stages of the screen: (1) significance below 0.05 (p-value < 0.05), (2) number of cohorts with significant differences in the TGF-β1 and TGF-β2 expression (≥ 3), and (3) tendency of TGF-β1 and TGF-β2 expression within different cohorts (up- or down-regulated). The Oncomine® Research Edition was used to analyze 7 additional HCC collectives and 7 cirrhosis/precancerous stage collectives for TGF-β1 and TGF-β2 expression (for more details, see Tables 1 and 2). As criteria for analysis of expression changes in HCC vs normal, in cirrhosis/ precancerous stages vs normal, and in HCC vs cirrhosis/ precancerous stages p-values of < 0.05 were set.
ACKNOWLEDGMENTS
We thank the following cooperation partners for providing cell lines and support: the SFB/TTR77 funded by the Deutsche Forschungsgemeinschaft (DFG)
for providing HepG2, Hep3B, PLC/PRF/5, HLE, and HLF purchased from ATCC and HuH7 purchased from JCRB (Japanese Collection of Research Bioresources Cell Bank); Prof. Michael Kern, Institute of Pathology, Cologne, Germany, for FLC-4 and HuH6 cells; and Prof. Scott Friedman, Mount Sinai Hospital, Icahn Medical Institute New York, USA, for LX-2. The authors thank S. S. Thorgeirsson and E. A. Conner (Laboratory of Experimental Carcinogenesis, Center for Cancer Research, National Cancer Institute, National Institutes of Health, Bethesda, MD, USA) for kindly providing c-myc and TGFα transgenic mice. Thanks to Alexandra Müller (Medical Faculty Mannheim/UMM) and Igor Liebermann (IKP Stuttgart) for technical help. We also thank the interpreter Mrs. S. Namingha for proofreading the manuscript.
Abbreviations
TGF-β - Transforming growth factor, TGF-βR-I, II, III - Transforming growth factor receptor type I, II and III, CM - collagen monolayer, CLD - chronic liver disease, Col1a1 – Collagen 1a1, CS - collagen sandwich, ELISA – enzyme–linked immunosorbent assay, HCC - hepatocellular carcinoma, HSC - hepatic stellate cell, CCL4 – carbontetrachloride, BDL - bile duct ligation, DEN - diethylnitrosamine, ICC - intrahepatic cholangiocarcinoma, DMEM - Dulbeccoʼs Modified Eagle Medium, KO - knock out, MDR2 – multi drug resistance protein 2, phosphatidyl flippase, qPCR - quantitative realtime polymerase chain reaction, SYBR - N′,N′-dimethyl-N-[4-[(E)-(3-methyl-1,3-benzothiazol-2-ylidene) methyl]-1-phenylquinolin-1-ium-2-yl]-N-propylpropane-1,3-diamine, LX-2 – human hepatic stellate cell line Lieming Xu-2, HepG2, Hep3B, PLC/PRF, HLE, HLF, FLC-4, HuH7 - human hepatocellular carcinoma cell lines, HuH6 – human hepatoblastoma cell line, C57BL/6, BALB/c – wild type mouse strains.
Authorsʼ contributions
AD investigated mouse model samples and cell lines. AD also performed statistical analyses and Figure preparation. TDanalyzed TGF-β1 and TGF-β2 expression in publically available databases. KBH was responsible for the acute CCl4 intoxication model and provided
liver mRNA for further analysis by AD. PA and JH provided liver mRNA of the MDR2-KO mouse model for further analysis by AD. AP provided liver tissue of the TGFα/cMyc mouse model for further analysis by AD. IF provided liver mRNA of the DEN treated mice for further analysis by AD. SNW performed chronic CCl4
the Fluidigm analysis. CC performed correlation analysis of TGF-β2 expression with clinicopathological parameters and survival. AD, NMB and SD designed the experiments; NMB and SD organized sample collection; AD, NMB and SD interpreted the data; AD and NMB wrote this manuscript. HK and MJ supported the study financially and contributed to the discussion about the data. All authors contributed with productive discussions and knowledge to the final version of this manuscript.
FUNDING
We thank Isarna Therapeutics, ESF Baden Württemberg (www.esf-bw.de) and the Ministerium für Wissenschaft, Forschung und Kunst, Baden-Württemberg [Margarete von Wrangell Stipend], the Robert Bosch Foundation, Stuttgart, the Deutsche Forschungsgemeinschaft (DFG) [SFB-TRR77], the German Federal Ministry of Education and Research (BMBF) [Virtual Liver Network, VLN, grant no. 0315764 and 0315755] and the EU [IT-Liver consortium, Marie Curie Training Network] for financial support; the sponsors did not play a role in the study design, data collection, and analysis nor in the interpretation of the data.
CONFLICTS OF INTEREST
Isarna Therapeutics GmbH supported this study financially. The company develops TGF-β isoform specific antisense oligonucleotides for therapeutical approaches. However, the company did not influence the experimental design and the data interpretation.
REFERENCES
1. Takayama T, Makuuchi M, Hirohashi S, Sakamoto M, Okazaki N, Takayasu K, Kosuge T, Motoo Y, Yamazaki S, Hasegawa H. Malignant transformation of adenomatous hyperplasia to hepatocellular carcinoma. Lancet. 1990; 336:1150–1153.
2. Yu Q, Stamenkovic I. Cell surface-localized matrix metalloproteinase-9 proteolytically activates TGF-beta and promotes tumor invasion and angiogenesis. Genes Dev. 2000; 14:163–176.
3. Daopin S, Piez KA, Ogawa Y, Davies DR. Crystal structure of transforming growth factor-beta 2: an unusual fold for the superfamily. Science. 1992; 257:369–373.
4. Marquardt H, Lioubin MN, Ikeda T. Complete amino acid sequence of human transforming growth factor type beta 2.
J Biol Chem. 1987; 262:12127–12131.
5. Massague J. TGF-beta signal transduction. Annu Rev Biochem. 1998; 67:753–791.
6. Bierie B, Moses HL. TGF beta: the molecular Jekyll and Hyde of cancer. Nature Reviews Cancer. 2006; 6:506–520.
7. Wrana JL, Attisano L, Carcamo J, Zentella A, Doody J, Laiho M, Wang XF, Massague J. Tgf-Beta Signals through a Heteromeric Protein-Kinase Receptor Complex. Cell. 1992; 71:1003–1014.
8. Massague J. How cells read TGF-beta signals. Nature Reviews Molecular Cell Biology. 2000; 1:169–178. 9. Cheifetz S, Weatherbee JA, Tsang MLS, Anderson JK,
Mole JE, Lucas R, Massague J. The Transforming Growth-Factor-Beta System, a Complex Pattern of Cross-Reactive Ligands and Receptors. Cell. 1987; 48:409–415.
10. Cheifetz S, Hernandez H, Laiho M, Tendijke P, Iwata KK, Massague J. Distinct Transforming Growth-Factor-Beta (Tgf-Beta) Receptor Subsets as Determinants of Cellular Responsiveness to 3 Tgf-Beta Isoforms. Journal of Biological Chemistry. 1990; 265:20533–20538.
11. Ellingsworth L, Nakayama D, Dasch J, Segarini P, Carrillo P, Waegell W. Transforming Growth-Factor Beta-1 (Tgf-Beta-1) Receptor Expression on Resting and Mitogen-Activated T-Cells. Journal of Cellular Biochemistry. 1989; 39:489–500. 12. Segarini PR, Rosen IlM, Seyedin SM. Binding of TGF-b to
cell surface proteins varies with cell type. Mol. Endocrinol. 1989; 3, 261–272.
13. Massague J. Receptors for the TGF-beta family. Cell. 1992; 69:1067–1070.
14. Cheifetz S, Bellon T, Cales C, Vera S, Bernabeu C, Massague J, Letarte M. Endoglin is a component of the transforming growth factor-beta receptor system in human endothelial cells. J Biol Chem. 1992; 267:19027–19030. 15. Dickson MC, Martin JS, Cousins FM, Kulkarni AB,
Karlsson S, Akhurst RJ. Defective haematopoiesis and vasculogenesis in transforming growth factor-beta 1 knock out mice. Development. 1995; 121:1845–1854.
16. Williams AO, Knapton AD, Geiser A, Letterio JJ, Roberts AB. The liver in transforming growth factor-Beta-1 (TGF-beta 1) null mutant mice. Ultrastruct Pathol. 1996; 20:477–490. 17. Shull MM, Ormsby I, Kier AB, Pawlowski S, Diebold RJ,
Yin M, Allen R, Sidman C, Proetzel G, Calvin D, et al. Targeted disruption of the mouse transforming growth factor-beta 1 gene results in multifocal inflammatory disease. Nature. 1992; 359:693–699.
18. Kaartinen V, Voncken JW, Shuler C, Warburton D, Bu D, Heisterkamp N, Groffen J. Abnormal lung development and cleft palate in mice lacking TGF-beta 3 indicates defects of epithelial-mesenchymal interaction. Nat Genet. 1995; 11:415–421.
19. Shek FW, Benyon RC. How can transforming growth factor beta be targeted usefully to combat liver fibrosis? Eur J Gastroenterol Hepatol. 2004; 16:123–126.
www.impactjournals.com/oncotarget
21. Serini G, Gabbiana G. Modulation of alpha-smooth muscle actin expression in fibroblasts by transforming growth factor-beta isoforms: an in vivo and in vitro study. Wound Repair Regen. 1996; 4:278–287.
22. Pinzani M, Rombouts K. Liver fibrosis: from the bench to clinical targets. Dig Liver Dis. 2004; 36:231–242.
23. Derynck R, Akhurst RJ, Balmain A. TGF-beta signaling in tumor suppression and cancer progression. Nat Genet. 2001; 29:117–129.
24. Bierie B, Moses HL. TGF-beta and cancer. Cytokine Growth Factor Rev. 2006; 17:29–40.
25. Levy L, Hill CS. Alterations in components of the TGF-beta superfamily signaling pathways in human cancer. Cytokine Growth Factor Rev. 2006; 17:41–58.
26. de Martin R, Haendler B, Hofer-Warbinek R, Gaugitsch H, Wrann M, Schlusener H, Seifert JM, Bodmer S, Fontana A, Hofer E. Complementary DNA for human glioblastoma-derived T cell suppressor factor, a novel member of the transforming growth factor-beta gene family. EMBO J. 1987; 6:3673–3677.
27. Vanky F, Nagy N, Hising C, Sjovall K, Larson B, Klein E. Human ex vivo carcinoma cells produce transforming growth factor beta and thereby can inhibit lymphocyte functions in vitro. Cancer Immunol Immunother. 1997; 43:317–323.
28. Bissell DM, Wang SS, Jarnagin WR, Roll FJ. Cell-specific expression of transforming growth factor-beta in rat liver. Evidence for autocrine regulation of hepatocyte proliferation. J Clin Invest. 1995; 96:447–455.
29. Abou-Shady M, Baer HU, Friess H, Berberat P, Zimmermann A, Graber H, Gold LI, Korc M, Buchler MW. Transforming growth factor betas and their signaling receptors in human hepatocellular carcinoma. Am J Surg. 1999; 177:209–215.
30. Matsuzaki K, Date M, Furukawa F, Tahashi Y, Matsushita M, Sakitani K, Yamashiki N, Seki T, Saito H, Nishizawa M, Fujisawa J, Inoue K. Autocrine stimulatory mechanism by transforming growth factor beta in human hepatocellular carcinoma. Cancer Res. 2000; 60:1394–1402.
31. Coulouarn C, Clement B. Stellate cells and the development of liver cancer: Therapeutic potential of targeting the stroma. J Hepatol. 2014; 60:1306–1309.
32. Coulouarn C, Cavard C, Rubbia-Brandt L, Audebourg A, Dumont F, Jacques S, Just PA, Clement B, Gilgenkrantz H, Perret C, Terris B. Combined hepatocellular-cholangiocarcinomas exhibit progenitor features and activation of Wnt and TGFbeta signaling pathways. Carcinogenesis. 2012; 33:1791–1796. 33. Sulpice L, Rayar M, Desille M, Turlin B, Fautrel A,
Boucher E, Llamas-Gutierrez F, Meunier B, Boudjema K, Clement B, Coulouarn C. Molecular profiling of stroma identifies osteopontin as an independent predictor of poor prognosis in intrahepatic cholangiocarcinoma. Hepatology. 2013; 58:1992–2000.
34. De Bleser PJ, Niki T, Rogiers V, Geerts A. Transforming growth factor-beta gene expression in normal and fibrotic rat liver. J Hepatol. 1997; 26:886–893.
35. Lee KT, Liu TS. Expression of transforming growth factor betas and their signaling receptors in stone-containing intrahepatic bile ducts and cholangiocarcinoma. World J Surg. 2003; 27:1143–1148.
36. Shimada H, Staten NR, Rajagopalan LE. TGF-beta1 mediated activation of Rho kinase induces TGF-beta2 and endothelin-1 expression in human hepatic stellate cells.
J Hepatol. 2011; 54:521–528.
37. Bissell DM. Primary hepatocyte culture: substratum requirements and production of matrix components. Fed Proc. 1981; 40:2469–2473.
38. Roth-Eichhorn S, Kuhl K, Gressner AM. Subcellular localization of (latent) transforming growth factor beta and the latent TGF-beta binding protein in rat hepatocytes and hepatic stellate cells. Hepatology. 1998; 28:1588–1596. 39. Dzieran J, Fabian J, Feng T, Coulouarn C, Ilkavets I,
Kyselova A, Breuhahn K, Dooley S, Meindl-Beinker NM. Comparative Analysis of TGF-beta/Smad Signaling Dependent Cytostasis in Human Hepatocellular Carcinoma Cell Lines. PLoS One. 2013; 8:e72252.
40. Xu L, Hui AY, Albanis E, Arthur MJ, O’Byrne SM, Blaner WS, Mukherjee P, Friedman SL, Eng FJ. Human hepatic stellate cell lines, LX-1 and LX-2: new tools for analysis of hepatic fibrosis. Gut. 2005; 54:142–151.
41. Katzenellenbogen M, Mizrahi L, Pappo O, Klopstock N, Olam D, Jacob-Hirsch J, Amariglio N, Rechavi G, Domany E, Galun E, Goldenberg D. Molecular mechanisms of liver carcinogenesis in the mdr2-knockout mice. Mol Cancer Res. 2007; 5:1159–1170.
42. Friedman SL. Mechanisms of hepatic fibrogenesis.
Gastroenterology. 2008; 134:1655–1669.
43. Michalopoulos GK. Liver regeneration. J Cell Physiol. 2007; 213:286–300.
44. Czaja MJ, Weiner FR, Flanders KC, Giambrone MA, Wind R, Biempica L, Zern MA. In vitro and in vivo association of transforming growth factor-beta 1 with hepatic fibrosis.
J Cell Biol. 1989; 108:2477–2482.
45. Thompson NL, Flanders KC, Smith JM, Ellingsworth LR, Roberts AB, Sporn MB. Expression of transforming growth factor-beta 1 in specific cells and tissues of adult and neonatal mice. J Cell Biol. 1989; 108:661–669.
46. Wang Q, Usinger W, Nichols B, Gray J, Xu L, Seeley TW, Brenner M, Guo G, Zhang W, Oliver N, Lin A, Yeowell D. Cooperative interaction of CTGF and TGF-beta in animal models of fibrotic disease. Fibrogenesis Tissue Repair. 2011; 4:4.
fibrosis via the transforming growth factor beta signaling pathway. Hepatology. 2014; 60:1519–1530.
48. Wang B, Koh P, Winbanks C, Coughlan MT, McClelland A, Watson A, Jandeleit-Dahm K, Burns WC, Thomas MC, Cooper ME, Kantharidis P. miR-200a Prevents renal fibrogenesis through repression of TGF-beta2 expression.
Diabetes. 2011; 60:280–287.
49. Biressi S, Miyabara EH, Gopinath SD, Carlig PM, Rando TA. A Wnt-TGFbeta2 axis induces a fibrogenic program in muscle stem cells from dystrophic mice. Sci Transl Med. 2014; 6:267–176.
50. Sun X, He Y, Ma TT, Huang C, Zhang L, Li J. Participation of miR-200a in TGF-beta1-mediated hepatic stellate cell activation. Mol Cell Biochem. 2014; 388:11–23.
51. Tschaharganeh DF, Chen X, Latzko P, Malz M, Gaida MM, Felix K, Ladu S, Singer S, Pinna F, Gretz N, Sticht C, Tomasi ML, Delogu S, et al. Yes-associated protein up-regulates Jagged-1 and activates the Notch pathway in human hepatocellular carcinoma. Gastroenterology. 2013; 144:1530–1542 e1512.
52. Dong J, Feldmann G, Huang J, Wu S, Zhang N, Comerford SA, Gayyed MF, Anders RA, Maitra A, Pan D. Elucidation of a universal size-control mechanism in Drosophila and mammals. Cell. 2007; 130:1120–1133.
53. Milani S, Herbst H, Schuppan D, Stein H, Surrenti C. Transforming growth factors beta 1 and beta 2 are differentially expressed in fibrotic liver disease. Am J Pathol. 1991; 139:1221–1229.
54. Shackel NA, McGuinness PH, Abbott CA, Gorrell MD, McCaughan GW. Identification of novel molecules and pathogenic pathways in primary biliary cirrhosis: cDNA array analysis of intrahepatic differential gene expression.
Gut. 2001; 49:565–576.
55. Fan B, Malato Y, Calvisi DF, Naqvi S, Razumilava N, Ribback S, Gores GJ, Dombrowski F, Evert M, Chen X, Willenbring H. Cholangiocarcinomas can originate from hepatocytes in mice. J Clin Invest. 2012; 122:2911–2915. 56. Coulouarn C, Factor VM, Thorgeirsson SS. Transforming
growth factor-beta gene expression signature in mouse hepatocytes predicts clinical outcome in human cancer.
Hepatology. 2008; 47:2059–2067.
57. Bragado P, Estrada Y, Parikh F, Krause S, Capobianco C, Farina HG, Schewe DM, Aguirre-Ghiso JA. TGF-beta2 dictates disseminated tumour cell fate in target organs through TGF-beta-RIII and p38alpha/beta signalling. Nat Cell Biol. 2013; 15:1351–1361.
58. Feng T DJ, Gu X, Marhenke S, Vogel A, Machida K, Weiss TS, Ruemmele P, Kollmar O, Hoffmann P, Grässer F, Allgayer H, Fabian J, Weng HL, et al. Smad7 regulates compensatory hepatocyte proliferation in damaged mouse liver and positively relates to better clinical outcome in human hepatocellular carcinoma. Clinical Science 2015; 128:761–774.
59. Oh S, Kim E, Kang D, Kim M, Kim JH, Song JJ. Transforming growth factor-beta gene silencing using adenovirus expressing TGF-beta1 or TGF-beta2 shRNA.
Cancer Gene Ther. 2013; 20:94–100.
60. Hellerbrand C, Stefanovic B, Giordano F, Burchardt ER, Brenner DA. The role of TGFbeta1 in initiating hepatic stellate cell activation in vivo. J Hepatol. 1999; 30:77–87. 61. Hasumura S, Sujino H, Nagamori S, Kameda H.
[Establishment and characterization of a human hepatocellular carcinoma cell line JHH-4]. Hum Cell. 1988; 1:98–100. 62. Hengstler JG, Utesch D, Steinberg P, Platt KL, Diener B,
Ringel M, Swales N, Fischer T, Biefang K, Gerl M, Bottger T, Oesch F. Cryopreserved primary hepatocytes as a constantly available in vitro model for the evaluation of human and animal drug metabolism and enzyme induction.
Drug Metab Rev. 2000; 32:81–118.
63. Wiercinska E, Wickert L, Denecke B, Said HM, Hamzavi J, Gressner AM, Thorikay M, ten Dijke P, Mertens PR, Breitkopf K, Dooley S. Id1 is a critical mediator in TGF-beta-induced transdifferentiation of rat hepatic stellate cells.
Hepatology. 2006; 43:1032–1041.
64. Ghafoory S, Breitkopf-Heinlein K, Li Q, Scholl C, Dooley S, Wolfl S. Zonation of nitrogen and glucose metabolism gene expression upon acute liver damage in mouse. PLoS One. 2013; 8:e78262.
65. Sigal M, Siebert N, Zechner D, Menschikow E, Abshagen K, Vollmar B, Eipel C. Darbepoetin-alpha inhibits the perpetuation of necro-inflammation and delays the progression of cholestatic fibrosis in mice. Lab Invest. 2010; 90:1447–1456.
66. Abshagen K, Brensel M, Genz B, Roth K, Thomas M, Fehring V, Schaeper U, Vollmar B. Foxf1 siRNA delivery to hepatic stellate cells by DBTC lipoplex formulations ameliorates fibrosis in livers of bile duct ligated mice. Curr Gene Ther. 2015; 15:215–227.
67. Pikarsky E, Porat RM, Stein I, Abramovitch R, Amit S, Kasem S, Gutkovich-Pyest E, Urieli-Shoval S, Galun E, Ben-Neriah Y. NF-kappaB functions as a tumour promoter in inflammation-associated cancer.Nature. 2004; 431:461–466. 68. Pusterla T, Nemeth J, Stein I, Wiechert L, Knigin D,
Marhenke S, Longerich T, Kumar V, Arnold B, Vogel A, Bierhaus A, Pikarsky E, Hess J, et al. Receptor for advanced glycation endproducts (RAGE) is a key regulator of oval cell activation and inflammation-associated liver carcinogenesis in mice. Hepatology. 2013; 58:363–373. 69. Bertran E, Crosas-Molist E, Sancho P, Caja L,
Lopez-Luque J, Navarro E, Egea G, Lastra R, Serrano T, Ramos E, Fabregat I. Overactivation of the TGF-beta pathway confers a mesenchymal-like phenotype and CXCR4-dependent migratory properties to liver tumor cells. Hepatology. 2013; 58:2032–2044.