RESEARCH ARTICLE
Light oiling of feathers increases flight energy expenditure in a
migratory shorebird
Ivan Maggini1,2,‡, Lisa V. Kennedy1, Alexander Macmillan1, Kyle H. Elliott1,*, Karen Dean3and Christopher G. Guglielmo1
ABSTRACT
Flying birds depend on their feathers to undertake most activities, and maintain them in peak condition through periodic molt and frequent preening. Even small exposures to crude oil reduce the integrity of feathers, and could impair flight performance. We trained wild western sandpipers (Calidris mauri) to perform endurance flights in a wind tunnel, and used magnetic resonance body composition analysis to measure energy expenditure after birds were exposed to weathered MC252 crude oil from the Deepwater Horizon oil spill. The cost of transport was 0.26±0.04 kJ km−1in controls, and increased by 22%
when the trailing edges of the wing and tail were oiled (<20% of body surface; considered light oiling). Additional crude oil on breast and back feathers (∼30% total surface; moderate oiling) increased the cost of transport by 45% above controls. Oiling tended to decrease flight control, and only half of moderately oiled birds completed the flight test. We then flew birds at a range of speeds to estimate basic kinematic parameters. At low speeds, light and moderately oiled birds had larger wingbeat amplitudes than controls, while moderately oiled birds showed greater wingbeat frequencies across all speeds, and a shift in optimal flight speed towards higher wind speeds. We suggest these changes reflect poorer lift production and increased drag on the wings and body. Oiling will increase the difficulty and energy costs of locomotion for daily and seasonal activities such as foraging, predator evasion, territory defense, courtship, chick provisioning, commuting and long-distance migration. These sub-lethal effects must be considered in oil spill impact assessments.
KEY WORDS: Oil spills, Wind tunnel, Flight energetics, Quantitative magnetic resonance, Kinematics
INTRODUCTION
Feathers are fundamental to avian form and function. They provide insulation for the maintenance of a high body temperature and homeothermy, they repel water and maintain buoyancy, and most importantly for flight, they create a streamlined body form and structures used to generate lift, produce thrust and maintain control. Natural feather loss during molt, or damage caused by ectoparasites or wear, reduces flight performance (Swaddle et al., 1996; Barbosa
et al., 2002) and can negatively affect fitness (survival and reproduction). Wing feather clipping and other experiments designed to increase flight energy expenditure by as little as 5– 10% consistently change bird activity budgets, where typically overall daily energy expenditure is maintained at the expense of costly activities requiring flight, like foraging to feed chicks (Mauck and Grubb, 1995; Tieleman et al., 2008; Elliott et al., 2014). In western sandpipers (Calidris mauri; the subject of our study) and other migratory shorebirds, flight costs mediated through feather wear and molt schedules influence the migration system by determining whether birds traveling different distances forego return migration and reproduction until their second year of life, a life history decision with major fitness consequences (Johnson, 1985; O’Hara et al., 2005). Daily preening and periodic molt keep feathers in optimum condition to support flight-related activities like foraging, maintaining a territory, displaying to mates, provisioning offspring, evading predators, commuting and migrating, but these behavioral and physiological mechanisms of feather maintenance may be insufficient to cope with unexpected and severe feather damage caused by exposure to pollution that may foul the plumage. Birds have evolved a high degree of phenotypic flexibility to cope with spatial and temporal variability in environmental conditions (e.g. food, temperature and pathogen conditions) (Greenberg and Marra, 2005; Piersma and Van Gils, 2010), yet they possess few adaptive behavioral or physiological responses to recent, unpredictable and rare events such as oil spills. The 2010 Deepwater Horizon (DWH) oil spill in the Gulf of Mexico was unprecedented in spatial scale and duration (NOAA, 2015). At least 112,000 km2 of marine habitat was affected and approximately
2100 km of coastal habitats were contaminated with crude oil (NOAA, 2015). Visible oil persisted in the Gulf of Mexico region for months following the spill, and even transient animals, such as migratory birds, became oiled (NOAA, 2015). Between 56,000 and 102,000 birds were estimated to have died as a consequence of heavy oiling. Unlike the 1989 Exxon Valdez oil spill, where thousands of birds died rapidly as a result of feather fouling, toxicity, loss of buoyancy and hypothermia (Piatt and Ford, 1996), thousands of live birds were observed following the DWH oil spill with trace to moderately oiled feathers (NOAA, 2015). Crude oil on feathers has physiological and/or toxic effects if ingested during preening or if absorbed through the skin (Leighton, 1991), but even small, sub-toxic amounts of oil can have important effects on bird fitness through indirect means (Eppley and Rubega, 1990). Surprisingly, the energetic cost of flying with oiled feathers has never been quantified, and so here we tested the hypothesis that crude oil on feathers alters the aerodynamic properties of feathers to reduce flight ability and increase flight costs. In controlled wind tunnel experiments, we evaluated the effects of crude oil applied to the trailing edges of the wings and tail, and additionally to back and breast feathers on flight ability, energy expenditure and kinematics. Received 14 February 2017; Accepted 10 April 2017
1Department of Biology, Advanced Facility for Avian Research, University of
Western Ontario, London, ON, Canada N6G 1G9.2Konrad Lorenz Institute of
Ethology, Department of Integrative Biology and Evolution, University of Veterinary Medicine, 1160 Vienna, Austria.3Abt Associates, 1881 Ninth Street, Boulder, CO
80302, USA.
*Present address: Department of Natural Resource Sciences, McGill University, Ste Anne de Bellevue, QC, Canada.
‡
Author for correspondence (ivan.maggini@vetmeduni.ac.at)
I.M., 0000-0002-1528-2288
Journal
of
Experimental
We measured flight power input and energy cost of transport of sandpipers during 2 h endurance flights by non-invasively measuring changes in fat and lean mass by quantitative magnetic resonance body composition analysis (Guglielmo et al., 2011; Gerson and Guglielmo, 2011). We used high-speed videography to measure key kinematic parameters of birds flying at speeds between 5 and 15 m s−1.
MATERIALS AND METHODS
Bird capture, care and flight training
The western sandpiper, Calidris mauriCabanis 1857, is a long-distance migratory shorebird that winters in coastal habitats along the Pacific coasts of North, Central and South America, the Caribbean and the Gulf of Mexico (Morrison et al., 1993; Nebel et al., 2002), making it representative of many avian species exposed to the DWH spill. We captured 80 western sandpipers in the Fraser River Delta and Boundary Bay in British Columbia, Canada, in July 2013 under permit CA-0256 from the Canadian Wildlife Service and with approval from the University of Western Ontario Animal Care Committee ( protocol 2012-027). The birds were held locally for up to 1 week in animal quarters at Simon Fraser University before same-day transport by air and vehicle to the Advanced Facility for Avian Research (AFAR) at the University of Western Ontario (London, ON, Canada). They were maintained in specialized 2.4 m×3.7 m shorebird rooms at approximately 22°C under a 16 h light, 8 h dark photoperiod. Sandpipers were fed a mixedad libitumdiet of 80% Mazuri Waterfowl Starter and 20% Aquamax Fingerling Starter 300 trout chow (Purina Mills, St Louis, MO, USA) supplemented with∼50 mealworms (Tenebrio molitor) per 20 birds every other day.
During late July and early August 2013, we tested each bird in the AFAR climatic wind tunnel (see below) and the 32 best fliers were selected as potential experimental birds. These birds were trained further by having them perform several 15–30 min flights, and we then selected 24 candidates for an endurance flight experiment. We reserved 8 birds as back-ups in case any of the selected birds did not fly for 2 h during the baseline flight (see below), and this happened in one case. Six of the control (never oiled) birds were retained at the end of the endurance flight experiment for a flight kinematics experiment. We chose birds that consistently flew very stably in the wind tunnel test section for optimal video analysis of their flight.
Treatment groups and schedule
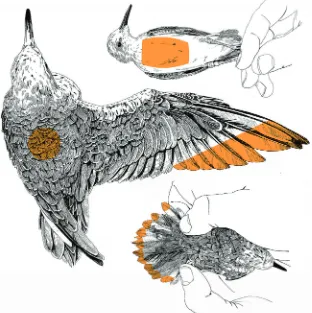
We conducted flight experiments from 12 to 31 August 2013 using repeated measures designs and for the endurance flights we included time-matched controls. For the endurance flight experiment, every bird first flew a 2 h baseline flight (BF) with no oil. Seven days later, the birds completed a wing/tail (WT) flight of the same duration where 12 birds were oiled on 25% of their distal wing and tail surfaces (Fig. 1) and 12 were sham-treated controls. The surface covered by oil corresponded to less than 20% of the total body surface (∼95 cm2, measured from pictures of a prepared skin of a
western sandpiper using the software ImageJ 1.46r, National Institutes of Health, USA). When a bird was standing with wings folded, the visible oiled surface was less than 5%. A further 7 days later, the birds flew a 2 h wing/tail/body (WTB) flight where the WT oiled birds were re-oiled on the wings and tail and received additional oil on 8 cm2of the breast and 2 cm2of the back (Fig. 1;
[image:2.612.49.361.417.730.2]total body area coverage of∼30%). The control group was again sham treated. Between the WT and the WTB flights, the oiled birds
Fig. 1. Patterns of oiling for experiments on western sandpipers.In the wing/tail (WT) treatment, crude oil was applied to the trailing edge of the wing beginning 2.3 cm from the tip of the outermost primary feather to the tip of the 10th primary feather, and along a 0.7 cm margin of the tail. In the wing/tail/body (WTB) treatment, additional crude oil was applied to a 2×1 cm area of the back and a 4×2 cm area of the breast and abdominal feathers. Sham-treated birds were brushed in the same locations for the same duration with a dry paint brush.
Journal
of
Experimental
were held in a separate room from the controls and had access to bathing water. Visual inspection of the birds prior to the second round of oiling showed minimal traces of oil on wings and tail and around the tail base. The flight kinematics experiment was conducted 1 week after the endurance flights were complete.
We used oil collected from the Macondo well during the 2010 DWH Gulf of Mexico oil spill that was artificially weathered (TDI-Brooks International, College Station, TX, USA) prior to receipt for use in the study (Forth et al., 2017). Oil was applied with a small paint brush and extra oil was dabbed away with a tissue (Kimwipe, Kimberly Clarke). The birds were weighed on an electronic scale (Acculab Vicon VIC-123, precision ±0.001 g) immediately before and immediately after oiling and the difference in mass indicated the amount of oil applied. The average mass of oil applied was 0.14 g (N=12, range 0.09–0.18 g) for the WT flight and 0.36 g (N=11, range 0.22–0.53 g) for the WTB flight. Controls were sham-oiled with a dry brush with the exception of baseline flights where no manipulation occurred in any treatment group. After the WT flight, the control and oiled birds were kept for 3 days in separate holding corrals of 1.5×1.5 m and provided with baths to preen and bathe, and a freshwater font for drinking. They were then returned to shorebird holding rooms until the WTB flight.
Endurance flight experiment
Before each flight in the wind tunnel, the individual birds were isolated and fasted for 60–90 min. Wind tunnel flights were performed under controlled temperature (15°C) and humidity (9 g m−3=70% RH) conditions at wind speeds of 10–11 m s−1
depending on the bird’s comfort during the baseline flight. Each bird was then flown at the same speed during the WT and WTB flights. Most birds flew continuously for the required 2 h; however, particularly in the WTB flight, some birds did not fly well. We recorded flight behavior and deducted any stoppages from total flight time for calculation of power input and cost of transport. During the experimental flights, we gave every flight a score between 1 (very poor quality flight) and 5 (very good quality flight). We also recorded the total amount of time actually spent flying, as well as the number and duration of strikes that occurred during the flight. A strike was defined as a flight stop due to either (1) the bird voluntarily landing (voluntary strike) or (2) the bird being unable to keep sustained flight as a result of contact with the tunnel walls or the back net (accidental strike). Flights were stopped before the end of the 2 h if the bird was not able to fly for a period of 1 min or longer within a 5 min window. Total flight duration was recorded and considered to be the voluntary flight duration. It was impossible for the trainer to be blind to the treatment, because of the visible oil; however, strict procedures were followed to score flight ability.
Immediately before and after each flight, the birds were weighed on an electronic scale (Acculab Vicon VIC-123, precision ±0.001 g) and scanned in a quantitative magnetic resonance (QMR) body composition analyzer (EchoMRI-B, Echo-Medical Systems, Houston, TX, USA) to measure dry fat and wet lean mass (Guglielmo et al., 2011). In oiled birds, we subtracted oil mass from the measured fat mass, and using taxidermically mounted sandpipers we did not observe any detectable oil loss through evaporation during 2 h in the wind tunnel (I.M., L.V.K., A.M. and C.G.G., unpublished data). A correction factor for the values of QMR fat (1.021) and wet lean mass (0.943) was applied in line with the previously published validation of QMR (Guglielmo et al., 2011). Birds primarily use fat and protein to fuel their flights (Jenni and Jenni-Eiermann, 1998). To calculate energy expenditure, we scanned the birds immediately before and after each flight. As
sandpipers were consistent in losing only a negligible amount of lean mass during flights (see below), we used the difference in fat mass between the beginning and end of the flight to calculate the energy expenditure using the conversion of 39.6 kJ g−1 for fat
(Jenni and Jenni-Eiermann, 1998). Power input (W or J s−1) was
calculated by dividing the total energy by the time spent flying, and cost of transport was calculated as the total energy divided by the distance flown (speed×time). We calculated flight energy expenditure only in sandpipers that completed a flight longer than 60 min.
Preliminary flight experiment
In May 2013, we performed a similar endurance flight experiment to the one described above using sandpipers captured in July 2012, held overwinter on a 12 h light:12 h dark photoperiod and then photo-stimulated for 3 weeks on a 14 h light:10 h dark photoperiod. The experimental design differed by not including the WTB flight, but had a recovery flight 2 weeks after the WT flight with no additional oiling and access to clean water to bathe in (N=10 in control and oiled treatments). Because of the extended period in captivity, few of the birds completed flights long enough to measure energy costs; however, we scored flight behavior according to criteria described above.
Flight kinematics
Wingbeat frequency has been used as a predictor of energy expenditure, and to build a proxy of the power curve (Pennycuick et al., 1996, 2012; although see Tobalske et al., 2003, for a critique of this method). We measured wingbeat frequency and other kinematic parameters in six birds in the wind tunnel at true air speed intervals of 1 m s−1 between 5 and 15 m s−1. Every bird first
performed a baseline flight lasting approximately 30 min where the wind speeds were changed in the following sequence: 11, 13, 15, 14, 12, 10, 9, 8, 7, 6 and 5 m s−1. At each air speed, the bird was
allowed to settle into a steady flight position before being video recorded. In total, the birds flew for approximately 3 min at each speed. They made subsequent flights using the same procedure within 1–2 days with the WT and WTB levels of oiling in sequence. High-speed videos were used to measure wingbeat frequency and amplitude, downstroke fraction, body angle and leg angle.
During each flight, the birds were filmed with two high-speed cameras, one from the side (Canon EOS Rebel 3Ti, 60 frames s−1)
and one from behind (GoPro HERO3 Black Edition, 120 frames s−1). At every speed, a video of about 20 s was taken,
simultaneously from the side and behind. For each flight and speed, we selected two video sections where the bird was flying in a steady position in the center of the image. From every section of the video taken from behind, we estimated wingbeat frequency (from the time taken to perform 10 wingbeats), wingbeat amplitude (the difference in angle between the tip of the wings and the shoulders at upstroke and downstroke, averaged over 10 wingbeats) and downstroke fraction (the percentage of time taken for downstroke relative to the full wingbeat, averaged over 10 wingbeats). From the side video, we estimated body tilt angle and leg angle relative to the body (averaged over 10 wingbeats). Body mass was measured with an electronic scale (±0.001 g) in all the birds before every flight.
Data analysis
All data collection, entry and analyses were subject to strict quality control procedures as required by the US Department of Interior DHW Natural Resource Damage Assessment (Abt Associates, Cambridge, MA, USA). Statistical analyses were executed using the
Journal
of
Experimental
software R 3.0.2 (R Core Team, 2012). The analysis of energetics data was performed only on birds that were in the wind tunnel for longer than 1 h and that spent at least 90% of that time flying. Seventeen birds provided energetics data in all three flights. In addition, five oiled birds flew for long enough in two flights (baseline and WT), and one control in two flights (WT and WTB). In total, we had data from 28 flights of oiled birds (11 baseline, 11 WT, 6 WTB) and 35 flights of control birds (11 baseline, 12 WT, 12 WTB). We first explored data to look for outliers and to detect collinearity between the explanatory variables of interest. There was strong collinearity between morphometric data (tarsus and wing length) and mass, and all were related to sex. We decided to use body mass and to create a size score by performing a principal component analysis (PCA) with tarsus, wing length and body mass as factors. In the following analysis, we used either body mass or the size index as covariates, and as the results were not different, we report analyses with body mass for simplicity.
When inspecting the data, we noticed that the lean contribution to the total energy was very small and sometimes even negative. This is not biologically possible, and it was probably due to imprecision in the QMR lean measurement and the fact that lean mass consumption was always near zero over the 2 h flights we conducted. Western sandpipers appear to be exceptionally good at using fat for fuel, and as the contribution of lean mass consumption to total energy consumption was on average 1% (95% confidence interval: 0.29–1.75%), we decided to disregard lean contribution to overall energy cost in our final analysis. Therefore, energy cost of transport was calculated only on the basis of fat consumption. When including lean contribution in the calculation, the results of the analysis were unchanged.
We tested for differences among treatments and flights in body mass loss, power input and cost of transport using linear mixed effects models with the variable of interest (body mass loss, power or cost of transport) as the response variable, treatment (oil or control), flight (baseline, WT or WTB), initial body mass and the interaction between treatment and flight as fixed factors, and bird ID as a random factor. The models were built allowing for heterogeneous variance. They were then simplified by removing non-significant terms, making sure that the overall deviance of the model was not significantly changed. Body mass was not significant in any of the models and was therefore removed. The final models were checked for normality and constant variance of residuals.
For the kinematics experiment, our exploration of the data showed that the response to speed was best represented by a quadratic function for wingbeat frequency, amplitude (a linear relationship was also tested but better fits were obtained with quadratic curves) and downstroke fraction. For body angle, we first calculated theaandbcoefficients of the Michaelis–Menten curves [Michaelis–Menten curves are described by the function y=ax/(b +x)] for every bird/flight, and then tested for differences among flights in each coefficient using ANCOVA with flight and body mass as covariates. For leg angle, we added the cubic term for speed and the interaction between flight and the cubic term for speed to the above fixed factors. We formulated mixed effects models with wingbeat frequency or amplitude as response variables. Flight (baseline, WT or WTB), speed, the quadratic term for speed, body mass and the interactions between flight and speed, and flight and the quadratic term for speed were used as fixed factors. Bird ID was included as a random factor. The models were simplified by removing non-significant terms until only significant terms were left. The final models were checked for normality and constant
variance of residuals. If the interaction terms flight×speed and flight×speed2were significant, this meant that the quadratic curve
for the response to speed differed among flights, either in position or in shape. We decided that the best way to look into these effects was to visualize the curves graphically, so we generated predictions based on the estimated coefficients to describe the curve and fitted the curves to the observed data.
RESULTS
We analyzed data from 63 endurance flights made by 23 individual birds in a time-matched control experiment with repeated measures of flights spaced 1 week apart (baseline, WT, WTB). There were no significant differences in initial body mass among treatments for any of the flight experiments (treatmentF1,22=0.03,P=0.86; flight
F2,43=0.39,P=0.68; treatment×flightF2,43=0.27,P=0.78; Table 1).
Pre-flight fat stores did not vary among treatments, but they differed among flights, being lowest for the WTB flight (treatment F1,22=0.82, P=0.38; flight F2,43=3.22, P=0.05; treatment×flight
F2,43=0.57, P=0.57). Pre-flight wet lean mass did not differ
significantly among treatments, and was greater for the WTB flight (treatmentF1,22=1.19,P=0.29; flightF2,43=9.45,P=0.0004;
treatment×flightF2,43=0.28,P=0.76). The slight differences in
pre-flight fat and lean mass between pre-flights were not relevant for the overall results, as no differences among treatments were found.
Mass loss, power input and energy cost of transport were comparable among all birds during baseline flights, but differed significantly between control and oiled birds in the WT and WTB flights (Fig. 2). Oiled birds lost more mass during 2 h flights (intercept: F1,36=740.32, P<0.001; treatment: F1,20=11.53,
P=0.003; flight: F2,36=1.40, P=0.260; treatment×flight:
F2,36=2.89,P=0.069; Fig. 2A). As we predicted greater mass loss
in oiled birds, we accepted a one-tailed P-value of 0.10 as significant. Oiled birds lost more mass than controls in WT (0.67 ±0.07 versus 0.58±0.05 g;post hoctestP=0.002) and WTB flights (0.69±0.012 versus 0.60±0.06 g; P=0.035). The average power required by control birds, calculated over their three flights, was 2.59±0.35 W. Oiled birds required greater power input to fly (treatment F1,21=11.15, P=0.003; treatment×flight interaction
F2,36=9.83,P<0.001; Fig. 2B). As a consequence, oiled birds had
a 22.4% greater cost of transport than controls during the WT flight, and this difference in energy cost increased to 44.8% in the WTB flight (treatmentF1,21=15.52,P<0.001; treatment×flight interaction
F2,36=8.99,P<0.001; Fig. 2C). Increased levels of oiling reduced
[image:4.612.311.566.585.691.2]the number of birds completing a 2 h flight (BF: 11/12 oiled versus
Table 1. Pre-flight body mass, fat mass and lean mass of western sandpipers by flight and treatment in the August 2013 endurance flight experiment
BF WT WTB
Body mass
Controls 28.9±3.0 g [12] 29.0±3.1 g [12] 28.9±2.9 g [12] Oiled 28.8±3.3 g [12] 28.8±2.9 g [12] 28.6±3.4 g [11] Fat mass
Controls 8.6±1.9 g [12] 8.6±2.2 g [12] 8.3±2.1 g [12] Oiled 8.1±2.2 g [12] 7.9±2.0 g [12] 7.4±1.9 g [11] Lean mass
Controls 16.1±1.1 g [12] 16.2±1.0 g [12] 16.5±0.9 g [12] Oiled 16.6±1.3 g [12] 16.8±1.4 g [12] 17.1±1.7 g [11]
Data are means±s.d. BF, baseline; WT, oiling of wing and tail; WTB, oiling of wing, tail and body. Sample sizes are given in brackets. Fat and wet lean mass measured by quantitative magnetic resonance (QMR) do not sum to gravimetric body mass because structures like feathers and skeleton are not
detected by QMR.
Journal
of
Experimental
11/12 control; WT: 11/12 oiled versus 12/12 control; WTB: 6/12 oiled versus 12/12 control). Data from the preliminary study further support our observation that flight ability and propensity were decreased when oil was applied to the feathers. A linear mixed model showed a significant effect of the interaction term treatment×flight (intercept:F1,23=39.21,P<0.001; treatment:
F1,18=0.90,P=0.354; flight:F2,23=0.60,P=0.560; treatment×flight:
F2,23=5.27,P=0.013). The total time flown was significantly greater
in the control birds than in the oiled birds at WT (post hoctest after Bonferroni correction: P<0.001), and returned to comparable durations after 2 weeks recovery.
Wingbeat frequency was greater, and shifted towards higher speed optima (the speed at which wingbeat frequency was smallest) when the sandpipers received the WTB treatment, but not when oil was applied only to the wings and tail (WT; Fig. 3A). The outcome of a linear mixed-effects model showed a significant effect of flight
(F2,166=15.47, P<0.001), speed (F1,166=390.33, P<0.001), the
quadratic term of speed (speed2:F
1,166=112.37,P<0.001), and of
the interaction flight×speed2 (F
2,166=3.99, P=0.020). The
interaction flight×speed was retained in the model but was not significant (F2,166=2.26,P=0.108). This suggests that the overall
power required to fly was greater at all speeds when the birds were oiled on their body and flight feathers. Wingbeat amplitude was greater at low wind speeds in the WT and WTB flights compared with baseline (Fig. 3B). The outcome of a linear mixed-effects model after simplification showed a significant effect of flight (F2,165=19.48, P<0.001), speed (F1,165=1032.29, P<0.001), the
quadratic term of speed (speed2: F
1,165=61.60, P<0.001), body
mass (F1,165=5.22, P=0.024), and the interaction flight×speed2
(F2,166=3.99;P=0.020). The interaction flight×speed was retained
in the model but was not significant (F2,165=1.61, P=0.203).
Downstroke fraction was best described by a quadratic function (Fig. 4A). The mixed effects model showed significant speed and the quadratic term of speed (intercept:F1,172=12,490.56,P<0.001;
speed: F1,172=237.82, P<0.001; speed2: F1,172=29.88, P<0.001),
but no effects of flight or body mass, which were thus excluded from the final model. Body tilt angle was best described by a Michaelis– Menten curve (Fig. 4B). In order to test for differences between flights, we estimated the coefficientsaandbfor each individual and flight, and subsequently used mixed effects models with each of the coefficients as response variable. Flight and body mass were used as fixed factors, while bird ID was the random factor. The models showed no effects of flight or body mass in both parameters a (flight:F2,8=0.33,P=0.731; body mass:F1,8=0.04,P=0.840) andb
(flight:F2,8=1.53,P=0.272; body mass:F1,8=0.16,P=0.697). Thus,
9 10 11 12 13 14 15 16
Wingbeat frequency (Hz)
A
60 70 80 90 100 110 120 130
Speed (m s−1)
Amplitude (deg)
6 8 10 12 14
BF WT WTB
[image:5.612.316.562.57.293.2]B
Fig. 3. Wingbeat frequency and amplitude of western sandpipers at speeds between 5 and 15 m s−1.(A) Wingbeat frequency. (B) Wingbeat
amplitude. The quadratic best-fit lines for each flight are shown. Different symbols indicate different individuals, and colors indicate different flights. The wingbeat frequency for each flight was fitted by the following curves: baseline flight (BF)f=18.05−1.16V+0.05V2; wing/tail flight (WT)f=18.88−1.34V
+0.06V2; and wing/tail/body flight (WTB)f=16.97−0.79V+0.03V2, wherefis
the wingbeat frequency andVis the wind speed in m s−1. The wingbeat
amplitude for each flight was fitted by the following curves: BFa=65.45+0.08V +0.22V2; WTa=88.13−3.70V+0.39V2; WTBa=101.54−6.33V+0.52V2, where ais the wingbeat amplitude andVis the wind speed in m s−1.
● ●
0 0.2 0.4 0.6 0.8 1.0
Body mass loss (g 2 h
−
1)
**
*
A
BF WT WTB●
●
Power (W)
0 1.0 2.0 3.0 4.0 5.0
**
***
B
Control Oil
● ●
● ●
● ●
0 0.1 0.2 0.3 0.4 0.5
Cost of transport (kJ km
−
1)
**
***
11 11 12 11 12 6
[image:5.612.57.296.246.548.2]C
Fig. 2. Body mass loss, power input and energy cost of transport of western sandpipers in oiled and control treatments.Horizontal lines show the median value, and the bottom and top of the boxes indicate the 25% and 75% percentiles, respectively. Whiskers show either the maximum value or 1.5 times the interquartile range, whichever is smaller. For body mass loss (A), the best linear mixed model after simplification was interceptF1,36=740.32, P<0.001; treatmentF1,20=11.53,P=0.003; flightF2,36=1.40,P=0.260;
treatment×flight:F2,36=2.89,P=0.069; random factor bird ID intercept=0.042,
residual variance=0.077. For power input (B), the best linear mixed model after simplification was interceptF1,36=2545.17,P<0.001; treatmentF1,21=11.15, P=0.003; flightF2,36=1.00,P=0.380; treatment×flight interactionF2,36=9.83, P<0.001; random factor bird ID intercept=0.225, residual variance=0.040. For cost of transport (C), the best linear mixed model after simplification was interceptF1,36=2480.49,P<0.001; treatmentF1,21=15.52,P<0.001; flight F2,36=0.49,P=0.618; treatment×flight interactionF2,36=8.99,P<0.001; random
factor bird ID: intercept=0.020, residual variance=0.041. Sample sizes are given below the boxes. BF, baseline flight; WT, wing/tail flight; WTB, wing/tail/ body flight. Circles represent outliers, asterisks represent significance levels:
*0.01<P<0.05; **0.001<P<0.01; ***P<0.001.
Journal
of
Experimental
no differences between flights were evident in the body angle changes with speed. Leg angle was best described by a cubic function (Fig. 4C). The mixed effects model showed significant effects of flight, speed and the cubic term of speed (intercept: F1,134=126.73, P<0.001; flight: F2,134=10.38, P<0.001; speed:
F1,134=1066.92, P<0.001; speed2: F1,134=0.77, P=0.382; speed3:
F1,134=30.44,P<0.001), but no effects of the interactions between
flight and speed or body mass, which were thus excluded from the final model. The significant difference among flights originates from a slightly smaller leg angle during the WT flight.
DISCUSSION
Our findings demonstrate that small amounts of crude oil on feathers can have dramatic effects on the energy cost of flight and migration ability of birds, with potentially substantial repercussions for energy budgets, reproduction and survival. We did not consider the toxic effects of oil ingested during preening or absorbed cutaneously, but these could be additive to the effects we have measured. Because our oiling treatments were acute and only affected feathers, the causes of increased flight energy costs and impaired maneuverability appear to be mainly physical. We cannot completely exclude that oil ingested through preening between the two treatment flights might have caused additional energy costs. In
fact, in a study of toxic effects of similarly oiled sandpipers, we found some effects of external oiling on liver and kidney function, but not on metabolic rates (Maggini et al., 2017a). It is unclear how such effects might have added to the mechanical effect of oil in affecting flight energetics, but the effects observed in the first oiled flight and the difference in kinematics in the second oiled flight indicate that the predominant effect was mechanical. Thus, our findings should be generally applicable to other bird species and oil types.
Using the measured baseline cost of transport of 0.26 ±0.04 kJ km−1, the added energy costs of feather oiling translate
approximately into a 0.06 and 0.12 kJ km−1increase for the WT and
WTB categories of oiling, respectively. Assuming a single migratory flight between two suitable stopover sites of 1000 km (the approximate distance between major stopover sites for western sandpipers; Iverson et al., 1996), oiling would result in an additional energy cost of 60–120 kJ for each leg of a migratory journey. As birds use mostly fat to provide the energy for their migratory flights, and the fat energy content is 39.6 kJ g−1(Jenni and Jenni-Eiermann,
1998), we estimate that a western sandpiper that was trace to moderately oiled would consume an additional 1.5–3.0 g of fat during one average migratory flight. A migrating oiled western sandpiper would deplete its fuel stores faster than normal, causing it to interrupt flight sooner or spend a longer time replenishing fuel during stopover. Observed fuel deposition rates (the rate of increase in body mass resulting from refueling at a stopover site) of western sandpipers range between 0.40 and 0.98 g day−1, depending on the
stopover site quality (Iverson et al., 1996), and average stopover duration is 1.1–3.3 days (Warnock and Bishop, 1998). Thus, an oiled sandpiper would require an additional 1.5–7.5 days at each stopover to replenish the additional fuel lost as a result of oil on its feathers. Assuming that the birds would not be able to clean off the oil, we calculate that over a full northward migration from the US coast of the Gulf of Mexico to Alaska (∼6000 km), a western sandpiper could be delayed by 9–45 days by these sub-lethal oiling levels. Migration could be delayed further if ingestion of oil during preening impaired digestive function and reduced refueling rate (Leighton, 1993), and if oiled sandpipers with impaired flight ability selected less productive but safer sites because of the increased risk of predation (Ydenberg et al., 2002). The negative consequences for reproductive success when arriving late to the breeding grounds have been shown in a large number of avian species, including the western sandpiper (Sandercock et al., 1999). Thus, the energy and time costs associated with oiling of feathers could have substantial impacts on fitness.
A feather clipping experiment performed on wintering western sandpipers provides the best insight into the potential effect of the 22–45% increase in flight energy expenditure we measured (O’Hara, 2001). Trimming 3–4 mm from the four outermost primary feathers on each wing (reducing wing chord by 4–5%) was sufficient to decrease spring pre-migratory mass gain and delay or prevent migratory departure. The energetic and flight performance effects of crude oil contamination of feathers are likely much greater than required to impair migration in shorebirds. In addition to the added energy costs of endurance flight, trace oiling impairs takeoff performance of western sandpipers (Maggini et al., 2017b). The lower maneuverability not only increases the costs of flight but also reduces escape performance, and thus could increase the risk of predation during stopover.
In the preliminary study, we observed that trace-oiled western sandpipers (WT treatment) with access to clean water for bathing returned to a flight performance comparable to that of control birds
40 45 50 55 60
Downstroke fraction (%)
0 5 10 15 20
Body angle (deg)
6 8 10 12 14 16
0 20 40 60 80 100
Speed (m s−1)
Leg angle (deg) BF WT WTB
A
B
[image:6.612.57.294.56.406.2]C
Fig. 4. Downstroke fraction, body tilt angle and leg angle of flying western sandpipers at speeds between 5 and 15 m s−1.Quadratic (A, downstroke
fraction), asymptotic (B, body angle) or cubic (C, leg angle) fits for each flight are represented. Different symbols indicate different individuals, and colors indicate different flights: BF, baseline flight; WT, wing/tail flight; WTB, wing/tail/ body flight.
Journal
of
Experimental
after a 2 week recovery period. However, during a major event like the 2010 DWH oil spill, finding suitable, uncontaminated habitats may require large movements because of the large area affected. A single observation we made in a subsequent experiment on one bird allowed to recover from the moderate oiling treatment (WTB) indicates that it can take up to 10 weeks with access to clean water to fully remove visible crude oil from the body (C.G.G. and A.M., personal observations).
Flight kinematics
The results of our kinematic analysis are generally consistent with the prediction that oil on feathers reduces lift generation and/or increases drag, causing the birds to work harder to fly. Considering wingbeat frequency and amplitude together provides a potential mechanistic interpretation for the effects of oil on flight energy cost. At low speeds, mechanical power output is dominated by the induced power to overcome gravity rather than power to overcome drag on the lifting ( profile) and non-lifting ( parasite) surfaces, whereas at high speeds, induced power is reduced and power to overcome drag increases exponentially (Videler, 2005; Pennycuick, 2008). The WT and WTB treatments had very little effect on wingbeat frequency at low speed, but required greater wingbeat amplitude. This suggests that oil on the wings and tail reduced lift production, possibly by affecting the transmissivity of the feathers or of the wing itself (Videler, 2005). The energy required to move the added weight at the extremities of the wings could also play a role. In the WTB treatment, wingbeat frequency was greater than that in the control or WT treatments, especially at high speeds, indicating that oil on the breast increases energy expenditure by increasing parasite drag.
Fewer of the WTB treatment sandpipers were willing to fly at all and data from our preliminary study suggested that birds that had oil on the wings and tail had more difficulty maneuvering in the wind tunnel. Summed over a 2 h flight, the added costs of maneuvering could have contributed to the increases in flight energy expenditure that we observed, but this would not have been detectable during the flight kinematics experiment because we only analyzed several seconds where the birds were in a steady flight position. More detailed studies are warranted to understand exactly the mechanisms by which oiling of flight and body feathers affects lift and drag.
Broader implications of sub-lethal oiling for birds
Feather oiling will not only impair migration but also make all movements and behaviors that require flight more difficult and expensive, impacting daily time and energy budgets. Such daily time/energy budgets could be substantially affected for species that spend large amounts of time flying to forage or to travel to pelagic feeding areas, such as colonial-nesting waterbirds. For example, several species of colonial-nesting gulls and terns occur as residents or for part of the year in the coastal waters of the Gulf of Mexico. Gulls and terns were consistently observed with oil contamination during the DWH spill (NOAA, 2015). As these species fly long distances to find food, the additional energy spent to fuel foraging trips would result in less available time for other activities such as preening, courtship, territorial behavior or nest attendance. Moreover, if oiling occurred during the chick provisioning period for these colony-nesting waterbirds, the added energy costs of commuting to foraging areas could become significant enough to reduce chick growth rate, chick survival, fledging success and/or adult condition and survival. Especially in long-lived species, adults
with increased energy cost of flight might favor their own maintenance and survival rather than that of their chicks (Weimerskirch et al., 2000), and this has been observed in nesting south polar skuas contaminated by crude oil (Eppley and Rubega, 1990). Experimental field studies of birds would be very informative regarding the effects of feather oiling on migration, reproduction and survival.
A large proportion of the birds observed to be oiled in the aftermath of spills are usually assigned to trace, light and moderately oiled categories, but the sub-lethal effects of oil on feathers are often overlooked or poorly quantified. Even birds with low levels of oiling will incur greatly increased energy costs with effects on many aspects of their lives. The sub-lethal, chronic effects of environmental catastrophes are difficult to measure, but in the case of oil spills they may be as important as the acute, direct mortality typically measured. These costs should be considered in future responses to crude oil spills.
Acknowledgements
We thank A. R. Gerson, B. Schwarz, G. Anderson, I. Jong, M. Dick, L. Zangari and M. Rebuli for help during fieldwork and bird care. We thank D. Lank and C. Smith for assistance with bird care and permits in British Columbia. We are grateful to K. Healy, P. Tuttle and J. Isanhart of the US Fish and Wildlife Service for valued support and input on the study. R. D. Smith provided original illustrations. Y. Morbey and J. Holmes provided useful comments on an earlier version of the manuscript.
Competing interests
The authors declare no competing or financial interests.
Author contributions
Conceptualization: I.M., L.V.K., K.D., C.G.G.; Methodology: I.M., L.V.K., C.G.G.; Validation: I.M., C.G.G.; Formal analysis: I.M., C.G.G.; Investigation: I.M., L.V.K., A.M., K.H.E., C.G.G.; Data curation: I.M., L.V.K., K.H.E.; Writing - original draft: I.M., C.G.G.; Writing - review & editing: I.M., L.V.K., K.H.E., K.D., C.G.G.; Visualization: C.G.G.; Supervision: C.G.G.; Project administration: I.M., L.V.K., C.G.G.; Funding acquisition: K.D., C.G.G.
Funding
This study was funded by the US Fish and Wildlife Service as part of the Deepwater Horizon Natural Resource Damage Assessment.
Data availability
Data from this study are included in the avian toxicity database available at the Deepwater Horizon NRDA Trustees’data repository, NOAA DIVER (Data Integration Visualization Exploration and Reporting) Explorer at: https://www.diver.orr.noaa.gov/ deepwater-horizon-nrda-data.
References
Barbosa, A., Merino, S., Lope, F. and Møller, A. P.(2002). Effects of feather lice on
flight behavior of male barn swallows (Hirundo rustica).Auk119, 213-216. Elliott, K. H., Le Vaillant, M., Kato, A., Gaston, A. J., Ropert-Coudert, Y., Hare,
J. F., Speakman, J. R. and Croll, D.(2014). Age-related variation in energy
expenditure in a long-lived bird within the envelope of an energy ceiling.J. Anim. Ecol.83, 136-146.
Eppley, Z. A. and Rubega, M. A.(1990). Indirect effects of an oil spill: reproductive
failure in a population of South Polar skuas following the“Bahia Paraiso”oil spill in Antarctica.Mar. Ecol. Prog. Ser.67, 1-6.
Forth, H. P., Mitchelmore, C. L., Morris, J. M., Lay, C. R. and Lipton, J.(2017).
Characterization of dissolved and particulate phases of water accommodated fractions used to conduct aquatic toxicity testing in support of the Deepwater Horizon natural resource damage assessment.Environ. Toxicol. Chem.
Gerson, A. R. and Guglielmo, C. G. (2011). Flight at low ambient humidity
increases protein catabolism in migratory birds.Science333, 1434-1436.
Greenberg, R. and Marra, P. P.(ed.) (2005).Birds of Two Worlds: The Ecology and
Evolution of Migration. Baltimore: Johns Hopkins Univ. Press.
Guglielmo, C. G., McGuire, L. P., Gerson, A. R. and Seewagen, C. L.(2011).
Simple, rapid, and non-invasive measurement of fat, lean, and total water masses of live birds using quantitative magnetic resonance.J. Ornithol.152, S75-S85. Iverson, G. C., Warnock, S. E., Butler, R. W., Bishop, M. A. and Warnock, N.
(1996). Spring migration of western sandpipers along the Pacific coast of North America: a telemetry study.Condor98, 10-21.
Journal
of
Experimental
Jenni, L. and Jenni-Eiermann, S.(1998). Fuel supply and metabolic constraints in migrating birds.J. Avian Biol.29, 521-528.
Johnson, O. W.(1985). Timing of primary molt in first-year golden-plovers and some
evolutionary implications.Wilson Bull.97, 237-239.
Leighton, F. A.(1991). The Effects of Oil on Wildlife: Research, Rehabilitation and
General Concerns (ed. J. White and L. Frink), pp. 43-57. Ninth International Effects of Oil on Wildlife Conference, Monterey, California.
Leighton, F. A.(1993). The toxicity of petroleum oils to birds.Environ. Rev.1,
92-103.
Maggini, I., Kennedy, L. V., Bursian, S. J., Dean, K. M., Harr, K. E., Link, J. E.,
Pritsos, C. A., Pritsos, K. L. and Guglielmo, C. G.(2017a). Toxicological and
thermoregulatory effects of feather contamination with artificially weathered MC 252 oil in western sandpipers (Calidris mauri).Ecotoxicol. Environ. Safe. Maggini, I., Kennedy, L. V., Elliott, K. H., Dean, K. M., MacCurdy, R., Macmillan,
A., Pritsos, C. A. and Guglielmo, C. G.(2017b). Trouble on takeoff: crude oil on
feathers reduces escape performance of shorebirds.Ecotoxicol. Environ. Safe.
141, 171-177.
Mauck, R. A. and Grubb, T. C., Jr. (1995). Petrel parents shunt all experimentally
increased reproductive costs to their offspring.Anim. Behav.49, 999-1008.
Morrison, R. I. G., Ross, R. K., Guzman, P. J. and Estrada, A.(1993). Aerial
surveys of Nearctic shorebirds wintering in Mexico: preliminary results of surveys on the Gulf of Mexico and Caribbean coasts. In Canadian Wildlife Service Progress Notes, Vol. 206. Ottawa, ON: Canadian Wildlife Service.
Nebel, S., Lank, D. B., O’Hara, P. D., Fernández, G., Haase, B., Delgado, F.,
Estela, F. A., Evans Ogden, L. J., Harrington, B., Kus, B. E. et al.(2002).
Western Sandpipers (Calidris mauri) during the nonbreeding season: spatial segregation on a hemispheric scale.Auk119, 922-928.
NOAA (2015). Deepwater Horizon Oil Spill: Draft Programmatic Damage Assessment and Restoration Plan and Draft Programmatic Environmental Impact Statement. Downloadable from http://www.gulfspillrestoration.noaa.gov/ restoration-planning/gulf-plan/.
O’Hara, P. D.(2001). The role of feather wear in alternative life history strategies of a
long-distance migratory shorebird, the western sandpiper (Calidris mauri).PhD Thesis, Simon Fraser University.
O’Hara, P. D., Fernández, G., Becerril, F., de la Cueva, H. and Lank, D. B.(2005).
Life history varies with migratory distance in western sandpipersCalidris mauri. J. Avian Biol.36, 191-202.
Pennycuick, C. J. (2008). Modelling the Flying Bird. Amsterdam: Elsevier,
Academic Press.
Pennycuick, C. J., Klaassen, M., Kvist, A. and Lindström, Å.(1996). Wingbeat
frequency and the body drag anomaly: wind-tunnel observations on a thrush nightingale (Luscinia luscinia) and a teal (Anas crecca). J. Exp. Biol. 199, 2757-2765.
Pennycuick, C. J., Fast, P. L. F., Ballerstädt, N. and Rattenborg, N.(2012). The
effect of an external transmitter on the drag coefficient of a bird’s body, and hence on migration range, and energy reserves after migration.J. Ornithol.153, 633-644.
Piatt, J. F. and Ford, R. G.(1996). How many seabirds were killed by theExxon
Valdezoil spill?Am. Fish. Soc. Symp.18, 712-719.
Piersma, T. and Van Gils, J. A.(ed.) (2010).The Flexible Phenotype: A
Body-centred Integration of Ecology, Physiology, and Behaviour. Oxford: University Press.
R Core Team(2012).R: A Language and Environment for Statistical Computing.
Vienna, Austria: R Foundation for Statistical Computing. ISBN 3-900051-07-0, URL http://www.R-project.org/.
Sandercock, B. K., Lank, D. B. and Cooke, F.(1999). Seasonal declines in the
fecundity of arctic-breeding sandpipers: different tactics in two species with an invariant clutch size.J. Avian Biol.30, 460-468.
Swaddle, J. P., Witter, M. S., Cuthill, I. C., Budden, A. and McCowen, P.(1996).
Plumage condition affects flight performance in common starlings: implications for developmental homeostasis, abrasion and moult.J. Avian Biol.27, 103-111. Tieleman, B. I., Dijkstra, T. H., Klasing, K. C., Visser, G. H. and Williams, J. B.
(2008). Effects of experimentally increased costs of activity during reproduction on parental investment and self-maintenance in tropical house wrens.Behav. Ecol.
19, 949-959.
Tobalske, B. W., Hedrick, T. L., Dial, K. P. and Biewener, A. A. (2003).
Comparative power curves in bird flight.Nature421, 363-366.
Videler, J. J.(2005).Avian Flight. Oxford: University Press.
Warnock, N. and Bishop, M. A.(1998). Spring stopover ecology of migrant western
sandpipers.Condor100, 456-467.
Weimerskirch, H., Prince, P. A. and Zimmermann, L.(2000). Chick provisioning
by the Yellow-nosed AlbatrossDiomedea chlororhynchos: response of foraging effort to experimentally increased costs and demands.Ibis142, 103-110. Ydenberg, R. C., Butler, R. W., Lank, D. B., Guglielmo, C. G., Lemon, M. and
Wolf, N.(2002). Trade-offs, condition dependence and stopover site selection by
migrating sandpipers.J. Avian Biol.33, 47-55.