Composition, Stability and Probable Structure of a
Colourless Organometallic Complex (Gd(III)-Malic Acid)
Mohammed Riri1*, Oussama Kamal1, Abdelkhalek Benjjar1, Farid Serdaoui1, Miloudi Hlaibi1,2 1Laboratoire d’Interface Matériaux et Chimie de l’Environnement, Université Hassan II Faculté des Sciences Aïn Chock,
Casablanca, Maroc
2Laboratoire des Polymères, Biopolymères, Surfaces, Faculté des Sciences, Université de Rouen, Rouen, France Email: *[email protected],[email protected]
Received May 20, 2012; revised June 25, 2012; accepted July 28, 2012
ABSTRACT
The formation of colourless gadolinium complexes (x,y,z), between x gadolinium ions, y ligands and z protons, of some organic acids, has been studied in aqueous solution. In this work we present the results of investigations on the interac- tion of the gadolinium ion (Gd3+) with malic acid (C
4H6O5, -hydroxyl dicarboxylic acid), in dilute aqueous solution for
pH values between 5.5 and 7.5. Colourless gadolinium complexes of malate ions have no absorption band UV-visible, the indirect photometric detection (IPD) technique was used and studies have identified a major tri-nuclear complex of malate ion (−OOC-CH
2-CHOH-COO−). The formation of this new colourless complex is derived from three Gd(III) ions
that react with two malate ions and two hydronium ions (H3O+), giving for this colourless complex, a (3,2,2) composition
and apparent stability constant depends on the acidity of the medium, with logK'322 = 18.88 ± 0.05 at pH = 6.30. To com- plement previous results and to propose a probable structure for this new complex detected in solution, studies of IR spec- troscopy have been conducted to identify the chelation sites for both ligands. The results were analysed and show that this organometallic gadolinium complex, contains two different sites, respectively, two lateral tetradentate mono-nuclear sites and a single central bidentate mono-nuclear site. From these results, the reaction of formation, the stability constant and the probable structure of this new colourless organometallic gadolinium complex are proposed.
Keywords: Gadolinium Complexes; Malate Ions; Indirect Photometric Detection (IPD); Apparent Stability Constant; Chelation Sites; Bidentate Mono-Nuclear; Tetradentate Mono-Nuclear
1. Introduction
In the field of analysis of very dilute solutions, we deve- loped a new detection technique for determining the compositions and stabilities of some colourless organo- met-allic complexes, which have no absorption band UV-visible. This technique is the indirect photometric detection (IPD), based on competitive reactions, by ligand-ligand exchange. The method is simple, reprodu- cible, effective and applicable to very dilute solutions. Thus, the importance of IPD technique was also revealed by its adaptation to other techniques of separation and determination, such as liquid chromatography [1-3], capillary electrophoresis [4] and continuous flow analy- sis (FIA) [5-7]. Some studies [8,9] show that this tech-nique is very effective in identifying some colourless tungstate complexes of sugars and organic acids.
The paramagnetic complexes of the trivalent gado-
linium ion ( ), have emerged as very important
agents of contrast, for many applications in Magnetic
Resonance Imaging (MRI), through interest electronic and magnetic properties of this ion [10,11]. Recent stud- ies have shown that the lanthanide complexes of cou- marin (1,2-benzopyrone), exhibit antiproliferative acti- vity [12]. In this work, investigations by indirect photo- metric detection (IPD) were carried out to study the in- teraction of the trivalent gadolinium ions, with malate ions (conjugate base of malic acid), detecting the majo- rity of colourless complex formed in solution and deter- mine its composition and stability. To elucidate the struc- ture and the chelation sites of this major malate complex of
3
Gd
3
Gd ions, the technique of IR spectroscopy has
been used. Indeed, these two techniques (IPD and IR spectroscopy) are very useful for elucidating the forma- tion reaction of the major complex for the system (Gd (III)-malic acid), completely, determine, the composition and stability, the nature of chelation sites for each of ligands (−OOC-CHOH-COO−), involved in the compo-
sition of detected complex and propose a probable structure for this major gadolinium complex of the ma- late ion.
2. Experimental Methods
2.1. Chemicals
Malic acid, Chrome Azurol S
H Ch4
, Gd(III) nitrateand other chemicals were commercial products (Aldrich, Prolabo,…) of the purest available and analytical grade, used as received.
2.2. Indirect Photometric Detection
A standard Helios UV-visible spectrum-eter con- trolled by Vision 32 software was used for spectrometric measurements, using quartz cells of optical path length . The absorption measurements have been per- formed at room temperature and at wavelength
max 1 cm
l
545 nm
. Stock solutions of Gd(III) nitrate and
Chrome Azurol S
H Ch4
2 M
50
v
4
, prepared with concentra-
tions of respectively and . In a typical
experiment, a solution ( ) of the colored sacrifi-
cial complex was prepared
10
Ch
3 10 M mL
GdH
3
4 1.5
Gd H Ch
,
using as a buffer of MESH (0.1 M) [2-(N-morpholino) sulphonic ethane acid]. The initial solution also con- tained a calculated amount of 1 M NaOH in order to
ob-tain the desired pH value , experi-
mental pH range (5.5 - 7.5). pH values are measured with a Microprocessor pH Meter HANNA 210 equipped with a combined glass electrode and calibrated with comer- cial buffers (pH 4.00 and 7.00). Then aliquots
of an aqueous solution of the malic acid
6.20
a MESH
pK
v0.100 0.200 mL
log
2g
L
C L were added, using a Gilson
micropipet of 0.200 mL. After each addition, the result- ing solution was left at least 5 min in order to reach equi- librium (and thus a constant absorption value). Addition was repeated until a maximum volume of 2.00 mL of the organic acid solution was added. The change in the total volume was neglected. For fixed pH environments, the apparent formation constants Kxyz
was calculated using a laboratory made computer program. The absorp- tion values for the undissociated AF and the totally dissociated
AI , sacrificial complex
, are used as determined in experiments using pure Chrome Azurol S4 GdH Ch
H Ch4
, and an excess of Gadolinium(III) (performed at pH intervals of 0.20). Assuming various integers for the Gadolinium and organic acid stoichiome- try, a formation constant is calculated for each added amount of ligand and corresponding absorption value. The results are rejected when a systematic variation of logKxyz occurs with increasing added amount of ligand or when individual values of logKxyz differed from the2.3. IR Spectroscopy
mean value by more than 2%.
Samples were prepared amount of malic acid (lig
by weighing the appropriate
and) and adding
samp
at room temperature, at fixed pH value (5.86)
tection Study
3 3
Gd NOtions of a
2
H O, mixing and finally adjusting the pH with concen-
trated HCl or NaOH and concentra nalyzed
les are 10−3 M. Analyses were performed using an
infrared spectrometer, Fourier transform (FT-IR), Perkin Elmer BX, equipped with a DTGS detector, a splitter and a cesium iodide window. In this configuration, the inter- val of analysis is that the middle infrared, 6000 cm−1 to
250 cm−1 and analysis are conducted on small samples,
whose size is less than 1 mm3. Liquid samples are placed
between two plates of very pure salt (KBr), these plates are transparent to infrared light and the spectra relative to free ligand (malate ion) and complexed, have been plot- ted for frequencies from 4400 cm−1 to 400 cm−1.
2.4. Raman Spectroscopy The complex is precepts quickly a concentration of 10−2 M and
(Higher than the acidity constant of malic acid). The pre- cipitate was filtered and dried in drying oven and the complex formed is insoluble in water, methanol and ethanol. The Raman spectra of the ligand (Malic acid) and its new Gd(III) complex was performed using an Fourier transformation Raman spectrometer (FT-Raman) VERTEX 70 with a range of measurement (4000 - 50) cm−1, laser source NdYag (1.064 µm), a nominal power
of 500 MW, detecting Ge with high sensitivity and a resolution of 4 cm−1 (64 scan). The spectra relative to
free malic acid and Gd(III)-carboxylate complex, have been plotted for frequencies from 3600 cm−1 to 200 cm−1.
3. Results and Discussion
3.1. Indirect Photometric De
The complexation reaction of x gadolinium ions
Gd3
with y malate ions and z protons
H , is given by ex-pression (I):
3 2
2
, , H O
xGd yLzH x n I 2
y z
L represents the ligand (malate ion).
The formation constant Kxyz (or stability constant
xyz of the complex is defined as the e staquilibrium con-nt :
, ,
3 x 2 y zxyz
K x y z Gd L H
(1)
Additionally, a conditional equilibrium constant Kxyz d solu-is defined in case of constant pH value (buffere tion):
, ,
3 x
yxyz L
K x y z Gd C (2)
L
complexed ligand, all experiments are perform
values higher than and of m
the
ed for pH alic acid,
1
a
pK pKa2
refore, we have 2
L
C L. Using this equality, Equation 1 can be written as:
, ,
3
x y z
xyz L
z xyz
K x y z C H
K H
(3)
Gd
og xyz
Thus logKxyz l K z
ligan Since t
com
pH
d can be h plex do
of the ethod.
m
The complexation studied using a
sp otometric m
and its detected gadoliniu ch
(4)
ectroph e reagent (malic acid)
not possess a aracteristic UV-visible absorption spectrum, a second ligand (called the sacrificial ligand) is introduced. This second ligand must absorb in the UV-visible spectrum and form a colored complex with Gd3 ions. Based on
ligand-ligand displacement, the photometric method is said to be in the indirect mode. The dissociation of this colored complex has to cause large variations in the UV- visible spectrum which allow the calculation of the con- centration of the sacrificial complex. Using the formation constant of this colored complex, the concentration of the unknown complex can be obtained. Therefore, the sacri- ficial ligand must form a single colored complex of lower stability than the gadolinium complex under study. In this work, 3”-sulfo-2”,6”-dichloro-3,3’-dimeth-yl-4’-hy- droxy-fuchsone-5,5’-dicarboxylic acid, often called Chrome Azurol S and noted H Ch4 , has been used as
sacrificial ligand. Chrome Azurol S is a tetraprotic acid
with pKa values of 2.25
2
3 2
H Ch H Ch , 4.71
2 3
2
H Ch HCh and 11.82
HCh3 Ch4
[13]. Inthe experimental pH range (5.5 - 7.5), the formation of
4
H Ch, H Ch3
and 2
2
H Ch d. It is
is generally otometric
proportioning of the metal ions in solution [14,15]. The
e 4
has been sed fo
neglecte r the ph an i
interaction of ndicator which
th
u
H Ch with gadolinium ions (Gd3),
gives a coloured reagent (max = 545 nm) of average sta-
bility for values of pH ranging between 5.50 and 7.50.
The buffer “MESH morpholino) sulphoni -
ane acid] was adopted to fix pH in the study of the sacri- ficial complex Gd H Ch 4 and the detected gadoli-
nium-malate complex. We chosed this buffer because it does not present any interaction with Gd3 ions and so
that we would be k in range of pH where the
stability of the sacrificial complex is maximal.
3.2. Formation of the Colored Sacrificial Complex
”.
[2-(N-le to w
c eth
ab or
x y
Gd HCh
A series of experiments was conducted to determ
composition, the the colored sacrifici
(
ine, the al com- plex
stability of
x y
Gd HCh ) and its formation reaction. Indeed, in 50 cm−3 of the auxiliary ligand solution
HCh3
of aconcentration 10 M4
HCh
C and pH = 5.91, we in-
troduc g quantities of a Gd3 ions solution
of initial concentration 10−2 M. The evol UV-
visible spectra on of this sacrificial com-
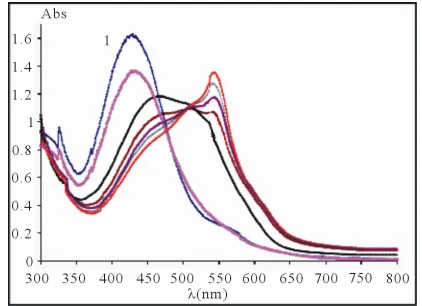
plex is represented by the diagram in f wing Figure 1. The UV-visible spectra show clearly that the maxi- mum absorbance of the sacrificial complex is located at
max 545 nm
ed increasin
ution of for the formati
ollo
. So, we have studied the formation of this
sacrificial complex at this maximum wavelength, de- pending on the ratio
metal ligand
3 3total
q Gd HCh
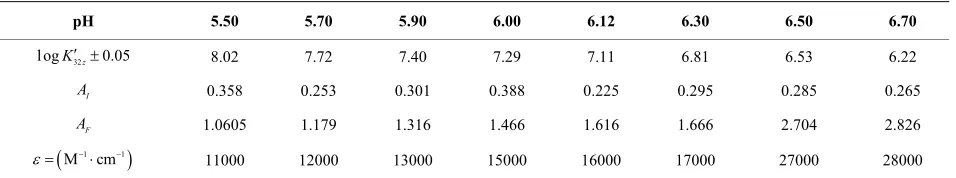
as shown in the Figure 2.
The curve in Figure 2 indicates that the value of the ratio q, relative to the complete formation of this sacrifi- ection of the linear (positive sl
cial complex is the inters
[image:3.595.317.528.301.454.2]ope), with the final segment (slope = 0) of the curve, this value of q is close to 1.50. This indicates that the
Figure 1. UV-visible spectra for the formation of sacrificial complex Gdx
HCh
y , pH = 5.91,
HCh3 total 10 M4
and
[image:3.595.308.538.511.685.2]Gd3 0 10 M2 , l1 cm, Curve (1) free CAS.
Figure 2. Formation of the sacrificial complex, depending on the ratio 3
3 total
q Gd HCh , buffer MES−/MESH,
pH = 5.70, max545 nm, l1cm,
the sacrificial comple following balanced reaction:
ions that react, with 1.5 equivalents of ions and 1 equivalent of
3
Gd 3
HCh ions (composition adopted to make simple calculations). The linear function shown in Figure 3, clearly verifies the accuracy of the studied re-lationship, and its slope p1.50,
16.27
Gd
formation of x is according to the
, ,
H O2
3 3
xGd yHCh zH x y z n II
1.5CHCh CHC
fixed 0
h calc
at V.
ulates the equiva-lent number of hydronium ions, involved in the forma-tion reacforma-tion of the detected gadolinium complex, and hence determines it exact composition
3, 2,3
, whereas the intercept expresses the stability constant of this sacri-ficial complex, with logKxyz
1.5
HCh
C x CHCh
1x
CHChHCh
C
3 represents the analytical concentration of ligand
HCh
during
in all its forms, number o otons volved the reaction, while
z the f pr in
HCh
C is the coefficient of
Thus, the complexation of 3 ions by HCh3
ions in the pH range 5.50 to 7.50, led to the formation of the colored tri-nuclear complex, by following balanced reaction:
complex lues of
formation, calculated from the experimental absorbance by the relation
va
I F I
A A A A
, with AI and AF which re-
spectively represent the initial absorbance (free ligand) and final (100% of the complex).
appare constant on the formation reaction according to the balanced reaction (II) is given by the following equati
3 3
2 3Gd 2HCh 3H 3, 2,3 3H O
3
H
Therefore, the expression of the nt
on : defined as: The formation constant of this
complex is3, 2,3
3 , ,
1 , ,
1.5
x y
x y z HCh
x y
3 3 3 2323 3, 2,3
K Gd HCh . (6)
1
x y
HCh y
K x y z Gd C
C x
(5)
The conditional equilibrium constant for a fixed value of pH is given by:
, ,
x y z
K
from values of
is calculated using a computer program w the balanced reaction (II), we obtained constant
ritten
3 3
2323 3, 2,3 HCh
K Gd C
(7) for the pair
x3,y2
32z
K for all
ex-perimental points, with a value of logK32 z 7.40 at
5.91
pH . Under the same conditions of temperature
and concen ns, several exp e performed
for pH values between 5.50 and 7.50. la-
m was used and the results clearly indicate that only the detected sacrificial complex
3, 2,z
, is formed in solution. For all studied solutions at known values of pH, the apparent constants 32tratio
a
eriments wer
The same calcu tion progr
z
K were cal-
culated and the obtained results are summarized in the Table 1. These results show that the stability of the sacrificial complex depends on the acid of the me- dium.
For all these solutions, the formation constant 32
logK'32z= -1,5 pH + 16,27 R2=0.999
5 5.5 6 6.5 7 7.5 8 8.5
5.4 5.9 pH 6.4
logK'32z
ity
z
K
on the sacrificial complex is given by the relationship
32
z xyz
K Kz H . Hence logK32z logK32zzpH, (K32zconditional constant for a given pH), we plo curve log 32
t the z
K depending on the medium pH (Figure is the equivalent number of 3), and the slop
Figure 3. The stability of the tri-nuclear complex Gd HCh3 2
depending on the medium acidity.
[image:4.595.63.541.647.736.2]e value H
Table 1. Evolution of th cial complex st
pH 5.50 5.70 5.90
e sacrifi ability, depending on the acidity of the medium.
6.00 6.12 6.30 6.50 6.70
32
l ogK z 0.05 8.02 7.72 7.40 7.29 7.11 6.81 6.53 6.22
I
A 0.358 0.253 0.301 0.388 0.225 0.295 0.285 0.265
F
A 1.0605 1.179 1.316 1.466 1.616 1.666 2.704 2.826
M1 cm1
3.3. The Co position a abili dy o System: Gd(III)-Malic cid
If the studied liga (malate ), is a to a col d
lution of the sac ificial x this e
m nd St ty Stu f the A nd r ions comple dded 2,3 , ore chrom
so
3,
azurol S (HCh3) complex will dissociate. To calculate
omplexed concentration of the
the c HCh3 ions, the ab-
sorption values of the totally complexed AF, and com- pletely dissociated HCh3 ions have to be determined
I
A . Then t owing equations can be used:
he foll
0
3, 2,3 CHCh A A I FAI
(8)
A
0
HCh free HCh I F I
C C A A A A (9)
When the conditional equilibrium constant K323 of ation of the sacrificial complex is known, the concent
free gadolinium ion ( ), can be calcula
Equations (7)-(9). r te 3 Gd
d using
Knowing
3, 2,3
and Gd3 , the concentration
of the gadolinium complex under study
x y z, ,
(ba- lanced reaction I) can rmined using the gadolin- ium mass balance equatibe det on :
e
3,2,3
3, 2,3
3Gd
x C Gd
(10)
Gd
C being the initial gadolinium concentration. In a similar way, the concentration of the free ligand is ob-tained by
z (11)
of the sacrificial colored complex is necessary. The determination of the comp the stability of the sacrificial complex and of
C2
C2 y x y
, ,
0
L free L
It should be also noted that a perfect knowledge of the
characteristics Gd HCh3 2
o
the precision
ch experi-sition and
the conditions of its formation are paramount stages to apply the indirect photometry technique. In ea
ment, the ligand (malate ions), is added stepwise in order to measure the absorption at different values (at least 12) of the overall initial concentration of this studied ligand. The correct Kxyz is looked for by varying x and y in order to obtain a constant value for all values of CL2 . If
xyz
K is determined at different pH values, the slope of the logKxyz . pH plot reveals the number z of protons, necessary for formation of the studied gadolinium complex by use of equation 4, since the value of
the
xyz
K is i endent of pH. Now the stability and the total
com-posi the gadoliniummalate complex have been
determined.
3.4. Determination of the Composition and the Stability Constant of the Gd-Malate
With an aim of ndep
tion of
determining the composition and the sta- bility constant of the gadolinium-malate complex, we
ored olutio he abso durin p-
nce of t complex by dition
ng qu s of ions. For a given e
l) of a solution containing sacrificial
monit the ev n of t rbance g disa
peara creasi
he sacrificial antitie
ad of
volum malate
(50 m complex
3, 2,3
10 M, we added increasing quantities of ma- -−2
late ions solution, with known concentration. The spec trophotometric study carried out with fixed wavelength
max 545 nm
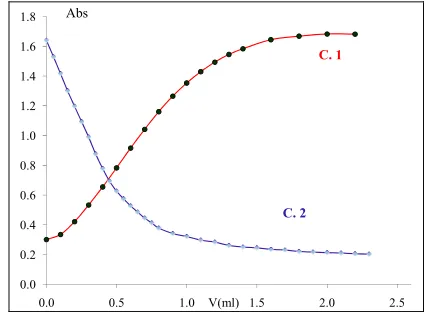
, showed a reduction in the abof the solution progressively with the addition of the malate ions (Figure 4). The dissociation of the sacrificial complex, relating to the reduction in the absorbance by the addition of malate ions solution, is done in favour of the formation of the colourless complex between Gd3
sorbance
and malate ion species. curve C 2
The in Figure 4, clearly shows that the
absorbance decreases and stabilizes. This stability indi- cates that all Gd3 ions, initially present in the solution
h added malate ions. Knowing the con- centration of gadolinium ions and the quantity of ligand from the added volume of the malic acid solution, neces- sary to reach this stage of absorption, we could determine the molar ratio q
have reacted wit
Gd3 malate
, involved in the com- plexation reaction. The preceding experiment was ca out for different values orried f pH between 5.50 and 7.50, the way in which bsorption decreases, depends on the pH of the medium and on the formation constant of the detected comp Gd-malate), as well as on the absorp- tion values (
the a
lex ( I
A ) and (AF) of the free and totally com- plexed Chrome Azurol S (HCh3). Analyzing the ex-
perimental data with the computer program written from the balanced reaction (I), the results confirm the repro-
ducibility of the m to determine the com-
position and apparent stability constant olar ratio q and
xyz
K (Table 2). The data-processing treatment of the preceding experimen- tal results, shows that this tri-nuclear detected complex
0.0 0.2 0.4 0.6 0.8 1.0 1.2 1.4 1.6 1.8
0.0 0.5 1.0 1.5 2.0 2.5
Abs
C. 1
C. 2
[image:5.595.315.528.514.670.2]V(ml)
Figure 4. C.1: Formation of colored sacrificial complex
3 2
Gd HCh ; .2C : Decomposition of this complex by
addi-
tion of a malic acid solution 2g L , pH6.50 ,
HCh total M
3 104
3 3 3 2
q Gd HCh .
Table 2. The apparent stability of the tri-nuclear detected complex, depending on the acidity of the medium.
pH 5.63 5.80 6.11 6.30 6.54
32
l ogKz 20.21 19.86 19.26 18.88 18.38
formed between the gadolinium ions and malate ions, resulting from the interaction of three Gd3 ions
equivalents with two equivalents of malate s so a molar ratio
pecies,
malte
3 2qx Gd .
Buffer MES MESH , max 545 nm, l1 cm,
,
for the co lex
ons (1)-(3) allow to write the following expressions:
ull. The stability constant of this formed com lex is ned by:
3 10 M4
total
HCh
Gd3 0 10 M2
For all pH range we obtained
x3,y2
, therefore, mp ation reaction of Gd3 ions with malateions at this pH range, these results and the Equati
, ,
H O2xGd yL zH x y z n
The value of z can be positive, negative or n
3 2
p defi
3, 2,
3 3 2 2 32z z
K z Gd L H
Conditional stability constant K32z is defined in case of constant pH value (buffered solution):
3 3
232z 3, 2, L
K z Gd C
experimental pH values higher than e
of ma acid, thus:
se
For the th
and lic 2
1
a
pK pKa2 CL L
3
3 2
3, 2,
( ) 3232
z z
z z
K H
And log 32z log xyz
L
K z Gd C H
K K z pH
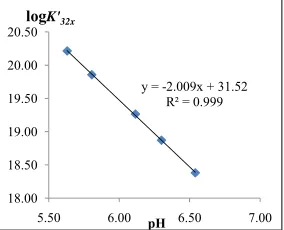
The evolution of logK32z 5, this evol
at different pH values is
represented on Figure ution is linear and the
slope of the straight line is equal to −2. The value (z2) represents the number of protons involved in the forma- tion reaction of this new tri-nuclear complex
3, 2,3
y = -2.009x + 31.52 R² = 0.999
18.00 18.50 19.00 19.50
5.50 6.00 6.50 7.00
20.00 20.50
pH
logK'32x
Figure 5. Evolution of logKxyz for trinuclear Gd(III)-ma-
late complex, at different pH values.
linium-Malate) species. (Gado
Consequently
In the light of the spectrophotometric results relating to the interaction of Gd3 ions with the malate ions,
namely that the complexation reaction uses three hydro- lyzed Gd3 ions for two malate species and requires
fixatio o prot
According to the literature [16], the ion can be
presented in various hydrolyzed form ueous solu-
tion and this new tri-nuclear gadolinium complex de- tected in solution at experimental pH r e, is probably
formed from the hydrolyzed form , according
to the following reaction:
2H O
In order to confirm our results, to have mo informa- is new
re for this tri-nuclear ectroscopy investigations. These studies by IR spectroscopy carried out in the same h more concentrated solutions, help to
ga
n of tw ons.
3
Gd
s in aq
ang
OH
2
Gd
2
2 2
3Gd OH 2L2H 3, 2, 2
re
tion on the nature of th gadolinium complex and
likely to propose a probable structu specie, we carried out IR sp
pH range but wit
identify the nature of the chelation sites and the probable
structure of this new dolinium complex formed by
interaction of malate ions with this hydrolyzed form of
3
Gd ions.
3.5. IR Spectroscopy Investigations
olinium respective
The IR spectroscopic studies can identify different groups of malic acid (ligand), which participate in chelation sites
for the formation of the detected gad complex.
0−1 cm), ly, the free
Three dilute solutions (1
malate ion
pH 5.60
, free malic acid (pH = 2.02)and detected complex of malate ion (pH =
5.60), were pre
and bi hic data.
f. [17,18]
gadolinium
pared and their spectra recorded (Figure 6) and analyzed. Table 3 contains bibliographic data [17, 18], relative to vibrations intervals of various groups: OH, C=O, COO− and C-C=O, and the intervals of vibration
on the analyzed spectra (1, 2 and 3).
[image:6.595.102.244.589.704.2]The experimental spectra obtained for the three ana-lyzed samples, clearly indicate that the frequency for vibration of the groups: OH, C=O and COO−, have
Table 3. The vibration frequencies, for the studied spectra bliograp
Experimental spectra Re Groups
ν(cm−1)
O-H 3300 - 3600 3650 - 3500 C=O 1620 - 1680 1800 - 1700
COO− 590 - 700
[image:6.595.311.537.648.737.2]group COO .
basis of comparison of experi-
menttal vibration of m d its
gado plex. The Rama ra obtained show
that the OH vibrations 3350 ± 1 [12,19] and the
free m acid pres brations o 1677
cm−1 35cm−1 e malic a
carbo nctions are e enviro 9,20],
these ions of O =O groups, were not de-
the intense vibration observed in the complex near 1069 The seriously reduced 75%, 80% and 66% passing the free to complexed ligand (Figure 6). So, for each of the two malate ions involved in the formation of this detected tri-nuclear complex, the four oxygen atoms of the ionized carboxylic groups, participate in chelation sites, and the
OH group in position of the ionized −
weak bands [21,22], and the strong vibration of Gd(III)- oxygen nitrate appeared at 187cm−1 [23]. The different
vibrations (stretching and deformation) of C-C (ali- phatic chains) appeared in a long field (1400 - 400cm−1)
with intense and medium intensities [21,20,24]. Bands in the 2590 ± 80 cm−1 region were assigned to the vibra-
tions of CH and CH2 [25,26], these bands are moderate
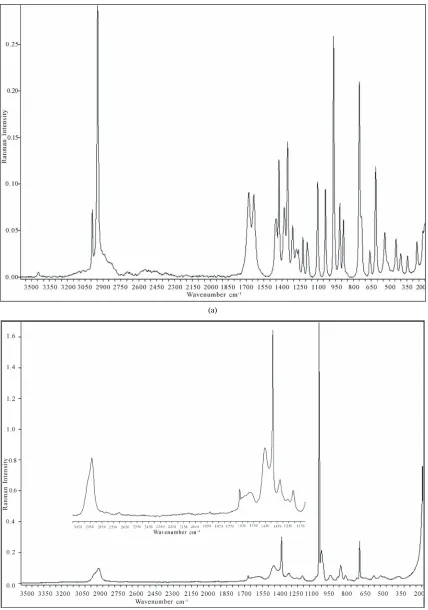
intensities in complex spectra 3.6. FT-Raman Spectroscopy Investigations
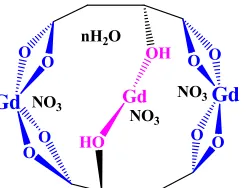
FT-Raman spectra of free malic acid and its complex These results clearly indicate that, this new tri-nuclear gadolinium complex contains two types of sites, a single central bidentate mono-nuclear site with participation of only OH groups in position and two lateral tetradentate mono-nuclear sites, each consisting of four oxygen atoms of two ionized carboxylic functions, belonging to the two malate ions (−OOC-CHOH-COO−), involved in the for-
mation of this new detected gadolinium organometallic complex. Indeed, all these results can offer for this tri- nuclear Gd-Malic acid, the structure presented in Figure 8.
with Gadolinium ions , are shown in Figure 7. A
detailed analysis of vibrations in Raman spectroscopy was performed on the
3
Gd
al spectra obtained alic acid an
linium com n spect
04 cm−1
alic ent two vi f C=O at
and 16 because th cid present two
nyl fu n’t the sam
H and C
nment [1 vibrat
tected in the complex spectra and the vibration of C-C=O group is reduced from free malic acid to its gadolinium complex. So, all oxygen atoms involved in the chelation sites of this new tri-nuclear complex.
The vibration spectra (weak broad) of the complex in 1600cm−1, indicate the existence of water molecules [21],
4. Conclusion
In this work, we used some techniques to study the in- teractions of the trivalent Gd(III) ions with different ionic forms of malic acid and identify the composition, stabi- lity and structure of the major colourless complex, form- ed in solution for pH values between 5.50 and 7.50. The photometry in indirect mode (IPD) was used success- fully to determine the composition and the stability of this major gadolinium complex. Only the tri-nuclear cm−1 indicate the existence of the nitrate ions [12].
[image:7.595.101.495.452.716.2]new band vibrations related to Gd(III)-Oxygen carboxy- late functions, are located at 600 and 547 cm−1 with a
(a)
[image:8.595.85.513.81.691.2](b)
Figure 7. Experimental FT-Raman spectra in the range (3600 - 200) cm−1: (a) free Malic acid; (b) Gd(III)-Malate ,
O O O
O
O O O
O
OH
HO
Gd NO3 Gd Gd
NO3
NO3
[image:9.595.114.238.85.179.2]nH2O
Figure 8. Probable structure for the new trinuclear godo- linic complex Gd Malte3 2
NO3
3nH O2 .complex with a composition and a high sta-
bility been identified for the
interv re studies on IR and
FT-Ram show that in this tri-
nuclea
3, 2,3
, hassults of
322
log 31.52 0.05 al of studied pH. The
an spectroscopy, clearly r complex type of Gd3 ions,
lic functions COO group in while, st , that for lic acids,
lts ques is zation of
all oxygens of the
two ion − of malate ion,
and the position, are
udies conducted by
Hlaïbi the tungstic com-
plexes carbonyl function
also indicate, that the
comb very effective for
colourless orga- nom
ized carboxy the oxygen atom of OH involved in chelation sites,
et al. [8,9,27,28] show of -hydroxyl carboxy C=O is excluded. All these resu
ination of these two techni identification and characteri
etallic complexes of Gd3 ions, in fact, is the first
was proposed
5. Acknowledgements
All authors wish to thank Professors Jean-François Ver- chère from the University of Rouen (France) for his ad- vice, fruitful discussions, strong encouragement and ex- emplary cooperation, and AUF for its financial support.
, “Detection in Ion Chromatography,” Jour- nal of Chromatography A, Vol. 546, No. 1-2, 1991, pp.
F. Verchère and A. M
time that this tri-nuclear complex was revealed, that its stability has been determined and a probable structure
REFERENCES
[1] R. D. Rocklin175-187.
[2] J. . Dona, “Exchange Methods for
the Indirect Photometric Determination of Anions and Organic Molecules,” Analusis, Vol. 20, No. 8, 1992, pp. 437-450.
[3] S. E. Meek and D. J. Pietrzyk, “Liquid Chromatographic Separation of Phosphorus Oxo Acids and Other Anions with Post-Column Indirect Fluorescence Detection by Aluminum-Morin,” Analytical Chemistry, Vol. 60, No. 14, 1988, pp. 1397-1400. doi:10.1021/ac00165a010
[4] P. Morin, C. François and M. Dreux, “Séparation de Cations et d’Anions Inorganiques par Éléctrophorèse Capillaire Ionique Avec une Détection Spectrométrique UV Indirecte: Capillary Electrophoresis of Inorganic Cations and Anions w ifferent Carrier Electrolytes and UV Detection ,” Analusis, Vol. 22, No. 4, 1994, pp.
ith D
178-187.
[5] A. M. Lisi, “La Photomertie Indirecte Comme Methode Analytique Pour Letude des complexes incolores des Acides Organiques dans les Solutions Diluées,” ParisVI University,Paris, 1993.
[6] M. Hlaibi, “La Photométrie Indirecte et RMN Pour l’Etude de l’Oxalate Urinaire et Pour l’Etude des Complexes Incolore des Ions UO22+ et WO42-,” Hassan II University, Ain Chock, Casablanca, 1995.
[7] A. Ramshing, J. Rusika and E. H. Hasen, “A New Ap- proach to Enzymatic Assay Based on Flow-Injection Spectrophotometry with Acid-Base Indicators,” Analytica Chimica Acta, Vol. 114, 1980, p. 165-181.
[8] M. Hlaïbi, S. Chapelle, M. Benaissa and J. F. Verchère, “Structures and Stabilities of Tungstate Complexes of .Alpha.-Hydroxy Acids. 183W NMR Study of the In- fluence of Ligand Substitutionm,” Inorganic Chemistry, Vol. 34, No. 17, 1995, pp. 4434-4440.
doi:10.1021/ic00121a022
[9] M. Hlaïbi, M. Benaissa, C. Busatto, J. F. Verchère and S. Chapelle, “A 13C and 183W NMR Study of Acid as a Multisite Ligand in Tungstate Complexes,” Carbohydrate Research, Vol. 278, No. 2, 1995, p. 227.
doi:10.1016/0008-6215(95)00266-9
[10] A. Nonat, C. Gateau, P. H. Fries and M. Mazzanti, “Lan- thanide Complexes of a Picolinate Ligand Derived from 1,4,7-Triazacyclononane with Potential Application in
Vol. 12, No. 27, 2006, pp.7133-7150.
Magnetic Resonance Imaging and Time-Resolved Lu- minescence Imaging,” Chemistry, A European Journal,
doi:10.1002/chem.200501390
[11] N. Chatterton, C. Gateau, M. Mazzanti, J. Pécaut, A. Borel and A. Merbach, “The Effect of Pyridinecarboxy- he Stability and electronic Re-Complexes,” Journal of the
- rative AgentsMetal-Based Drugs,” Vol. 2007, 2007, 8 pages. doi:10.1
late Chelating Groups on t laxation of Gadolinium
Chemical Society, Dalton Transactions, Vol. 21, No. 6, 2005, pp. 1129-1135.
[12] I. Kostova, G. Momekov and P. Stancheva, “New Sa- marium(III), Gadolinium(III), and Dysprosium(III) Com- plexes of Coumarin-3-Carboxylic Acid as Antiprolife
155/2007/15925
[13] F. J. Langmyhr and K. S. Klausen, “Complex Formation of Iron (III) with Chrome Azurol S,” Analytica Chimica Acta, Vol. 29, 1963, pp. 149-167.
doi:10.1016/S0003-2670(00)88596-7
)-Chloranilate Complex,” Analyst, Vol. 116, [14] A. M. Dona and J. F. Verchère, “Analytical Applications
of Oxocarbons. Part 3. Specific Spectrophotometric De- termination of Oxalic Acid by Dissociation of the Zir- conium(IV
1991, pp. 533-536. doi:10.1039/an9911600533
[15] M. Malt, “Dissoziationskonstanten von Chromazurol S,”
Analytica Chimica Acta,Vol. 25, No. 1, 1961, pp. 289- 291.
[17] J. D. Robert and M. C. Caserio, “Problème de Chimie Organique Moderne, ” InterEditions, Paris, 1979, p. 32.
[18] Colthup, Daly, Wiberley, Introduction to Infrared and Raman Spectroscopy, Academic Press, New York, 1990.
13-14, 2005, pp. [19] N. P. G. Roeges, “A Guide to the Complete Interpretation
of Infrared Spectra of Organic Structures,” Wiley, New York, 1994.
[20] N. Sundaraganesan, B. D. Joshua, M. Rajamoorthy and C. H. Gangadhar, “FT-IR, FT-Raman Spectra and Ab-Initio DFT Vibrational Analysis of 2-Chloro-5-Aminopyri- dine,” Indian Journal of Pure & Applied Physics, Vol. 45, No. 12, 2007, pp. 969-978
[21] Horiba Jobin Yvon Inc., 3880 Park Avenue, Edison, NJ 08820-3012. USA
[22] E. Smith and G. Dent, “Modern Raman Spectroscopy—A Practical Approach,” Wiley, 2005, pp. 15-19.
[23] N. Sundaraganesana, S. Ilakiamania, H. Saleema, Piotr. M. Wojciechowskib and D. Michalsk, “FT-Raman and FT-IR Spectra, Vibrational Assignments and Density Functional Studies of 5-Bromo-2-Nitropyridine,” Spec- trochimica Acta, Part A, Vol. 61, No.
2995-3001.
[24] L. Padmaja, T. Vijayakumar, I. H. Joe, C. P. R. Nair and V. S. Jayakumar, “Vibrational Spectral Studies and the Non-Linear Optical Properties of a Novel NLO Material
L-Prolinium Tartrate,” Journal of Raman Spectroscopy, Vol. 37, No. 12, 2006, pp. 1427-1441.
doi:10.1002/jrs.1575
[25] S. Gunasekaran and S. Ponnusaymy, “Vibrational Spectra
- and Normal Coordinate Analysis on an Organic Non- Linear Optical Crystal-3-methoxy-4-hydroxy Benzalde hyde,” Indian Journal of Pure & Applied Physics, Vol. 43, No. 11, 2005, pp. 838-843.
[26] K. Malek, E. Podstawka, J. Milecki, G. Schroeder and L. M. Proniewicz, “Structural Features of the Adenosine Conjugate in Means of Vibrational Spectroscopy and DFT,” Biophysical Chemistry, Vol. 142, No. 1-3, 2009, pp. 17-26. doi:10.1016/j.bpc.2009.02.007
[27] S. Chapelle, J. P. Sauvage, P. Köll and J. F. Verchère, “183W NMR Studies of Tungstate Complexes of Carbo- hydrates. 3. Species Formed with All-threo Alditols Act- ing as Tridentate, Tetradentate, or Pentadentate Ligands,”
Inorganic Chemistry, Vol. 34, No. 4, 1995, pp. 918-923. doi:10.1021/ic00108a024
t Photome- [28] M. Hlaïbi, M. Hor, M. Riri, A. Benjjar and J. F. Verchère,
“Multinuclear 183W and 13C NMR and Indirec
try Study for the Identification and the Characterization of New Complexes of Sugar Acids,” Journal of Molecular Structure, Vol. 920, No. 1-3, 2009, pp. 310-322. doi:10.1016/j.molstruc.2008.11.016
Abbreviations
IPD: Indirect Photometric Detection MRI: Magnetic Resonance Imaging, H4Ch: Chrome Azurol S,
MESH: 2-(N-morpholino) sulphonic ethane acid. AI and AF: The absorption values for the undissociated and the totally dissociated sacrificial complex.
xyz
K : The apparent formation constant
Kxyz: The formation constant (or stability constant)
L2−: The ligand (malate ion)
lored complex CL: The analytical concentration of the ligand
CHCh: The analytical concentration of ligand HCh3− in
all its forms
CGd: The initial gadolinium concentration
Gd HCh3 2: The sacrificial co