Automatic evaluation of spoken summaries: the case of language
assessment
Anastassia Loukina, Klaus Zechner, Lei Chen Educational Testing Service (ETS)
Princeton, NJ 08541, USA
[email protected], [email protected], [email protected]
Abstract
This paper investigates whetherROUGE, a popular metric for the evaluation of au-tomated written summaries, can be ap-plied to the assessment of spoken sum-maries produced by non-native speakers of English. We demonstrate that ROUGE, with its emphasis on the recall of infor-mation, is particularly suited to the as-sessment of the summarization quality of non-native speakers’ responses. A stan-dard baseline implementation ofROUGE -1 computed over the output of the au-tomated speech recognizer has a Spear-man correlation ofρ= 0.55 with experts’ scores of speakers’ proficiency (ρ = 0.51 for a content-vector baseline). Further in-creases in agreement with experts’ scores can be achieved by using types instead of tokens for the computation of word fre-quencies for both candidate and reference summaries, as well as by using multiple reference summaries instead of a single one. These modifications increase the cor-relation with experts’ scores to a Spear-man correlation ofρ= 0.65. Furthermore, we found that the choice of reference sum-maries does not have any impact on per-formance, and that the adjusted metric is also robust to errors introduced by auto-mated speech recognition (ρ= 0.67 for hu-man transcriptions vs.ρ= 0.65 for speech recognition output).
1 Introduction
In this paper we explore whether metrics com-monly used for the automated evaluation of writ-ten summaries can be used to evaluate spoken summaries in the context of language assessment. The performance of automatic summarization systems is routinely evaluated using content
met-rics such as ROUGE (Lin and Rey, 2004), which measures the n-gram overlap between the candi-date summary and a set of reference summaries (see also Rankel et al. (2013) for historical back-ground). ROUGE is a recall-oriented metric in-spired by its precision-oriented counterpartBLEU, developed to evaluate machine translations (Pap-ineni et al., 2002). Recent research in this area has been focused on identifying the most reliable vari-ants ofROUGEand best practices in the application of the metric (Owczarzak et al., 2012; Rankel et al., 2013). These studies (reviewed in more detail in Section 2.1) showed that less commonly used variants ofROUGEmay in fact be more consistent with human judgments, at least in the context of automatic summary evaluation.
Beyond the research in automatic summariza-tion systems, ROUGE has also been used to eval-uate written summaries in the context of educa-tional assessment. Madnani et al. (2013) showed that one of the variants ofROUGE, in combination with other metrics, performed consistently well for the automated scoring of written responses to summary tasks produced by middle- and high-school students. They did not investigate the effect of using other variants ofROUGE.
In this paper, we explore whetherROUGEcan be used to automatically evaluate the content cover-age of spoken summaries produced by non-native speakers in the context of language assessment. As in case of automatic text summaries, the hu-man raters who score these responses are asked to assess whether the summary accurately con-veys the information contained in the stimulus. While the length of the spoken responses is more loosely constrained than in case of automatic text summaries, human raters do not penalize for ex-traneously irrelevant language. Therefore recall-orientedROUGEis an attractive evaluation metric for this task.
At the same time, unlike automatic text
maries, spoken summaries are abstractive and of-ten contain ungrammatical sequences, repetitions, repairs, and other disfluencies. Further ‘noise’ is introduced by transcription errors generated by the automated speech recognition system. In this study, we assess whether (a) ROUGE is robust against this type of noise; (b) how many refer-ence summaries are necessary to obtain reliable evaluation; and (c) how the choice of specific ref-erence summaries affects the performance of the metric (Section 4.1). We also assess which vari-ants ofROUGEhave the most agreement with hu-man judgments on this type of summary and what adjustments can be made to mitigate the effects of disfluencies and errors introduced by automated speech recognition (Section 4.2). Finally, we test how well our adjusted variant ofROUGEcan pre-dict the human scores on unseen data (Section 4.3).
2 Related work
2.1 The application ofROUGEto evaluation
of automatic text summarization
There exist various versions ofROUGEwhich dif-fer in terms of the length of theirn-grams, the use of skip-bigrams, the application of stemming, and the exclusion of stop-words. Several studies have compared these variants to identify those most consistent with human judgments. In earlier work, Lin (2004) reported that variants based on uni-grams and skip-biuni-grams (ROUGE-SU4) or bigrams alone (ROUGE-2) performed best. ROUGE-2 was also identified as the best variant more recently by Owczarzak et al. (2012). Rankel et al. (2013) found that linear combinations of these metrics withROUGEbased on longern-grams are more ac-curate in finding significantly different systems.
Previous work also explored various methods of text pre-processing prior to the computation of ROUGE, including stemming and the removal of stop-words, neither of which had any substantial effect on the performance ofROUGE(Lin and Rey, 2004; Owczarzak et al., 2012). Owczarzak et al. (2012) reported that the agreement with human judgments was, in fact, higher if the stop-words were retained.
All applications discussed so far used ROUGE to evaluate the textual summarization of written texts. There have also been attempts to apply this metric to text summaries of speech data with mixed results (see Nenkova and McKeown (2011)
for a review). ROUGEperformed reasonably well for the evaluation of text summaries of spoken pre-sentations (Hirohata et al., 2005), but was not cor-related with the summary accuracy of summaries of meetings or conversations (although see (Penn and Zhu, 2008)).
Most of this work was performed on extractive summaries produced by summarization systems that used multiple summaries to evaluate each sys-tem. In this study, we explore the application of ROUGEto the evaluation of abstractive summaries produced by students in a language assessment context with an aim of producing a separate evalu-ation for each summary. Furthermore, the fact that these are spoken responses adds an extra layer of complexity to the analysis, therefore the results of previous studies cannot directly be applied to this new context.
2.2 Previous approaches to the content evaluation of spoken summaries for assessment purposes
of language use; therefore a random list of con-tent words is unlikely to lead to a high overall score. However, finer-grained distinctions such as negations or subject-object relationships between words are often lost.
Applications of these methods to spontaneous speech in spoken-language assessments have been conducted much more recently as this domain of language assessment relies on the output of Au-tomatic Speech Recognition systems (ASR) that typically have a fairly high word-error rate. These errors can negatively affect the accuracy of the methods developed for written responses. Fur-thermore, spoken responses differ in many proper-ties from written ones (Biber et al., 2004) and the validity of existing methods for assessing speech needs to be established before they can be used for operational scoring.
Xie et al. (2012) presented experiments using content features on spontaneous-speech data based on vector-space models, latent semantic analysis, as well as point-wise mutual information. Some of these content features showed higher correla-tions with human scores than features measuring other aspects of speaking proficiency, such as flu-ency or pronunciation. Chen and Zechner (2012) also used a vector space model for the scoring of spontaneous speech, but extended it by using the ontological information contained in WordNet. Fi-nally, Xiong et al. (2013) used a variety of ap-proaches to capture the content of spontaneous re-sponses from the same corpus that we are investi-gating in this paper. Approaches varied from com-puting the overlap between key words in the stim-uli and responses to a more traditional vector space model based on content vector analysis.
While these approaches have good correlations with human scores, they have a number of short-comings. The best performing method suggested by Xiong et al. (2013) requires the manual annota-tion of the relevant key words for each prompt be-fore the computation of the metric. Vector space models do not have this limitation, but they require a substantial number of reference summaries to achieve consistent results. Supporting this point, Chen (2013) showed that at least 50 reference re-sponses were necessary to obtain moderate agree-ment between the cosine similarity measure and human judgments, with further improvement in agreement as the number of reference responses is increased to 200. These limitations pose
prac-tical difficulties when new items are added to the tests: the computation of content metrics for each new item requires either a manual annotation or a relatively large number of reference responses.
ROUGEappears promising in this context since it does not have either of these limitations. First, the computation ofROUGEdoes not require man-ual annotation. Second, research on the evalua-tion of written summaries suggests that relatively few reference summaries may be necessary to ob-tain reliable results, e.g., only four references were used for the summary evaluation at the Text Anal-ysis Conference (Rankel et al., 2013). In addition, the recall-based nature of ROUGEis well-aligned with the evaluation criteria for these responses. Therefore in this paper, we explore whether any of the variants ofROUGEcan be successfully applied to the content scoring of spoken summaries and what modifications may be necessary to achieve optimal performance.
3 Data and methodology 3.1 Description of the corpus
The study is based on a corpus of responses collected during the pilot administration of the TOEFLJuniorR TMComprehensive test, an inter-national assessment of English proficiency tar-geted at middle-school students aged from 11 to 15 (see also Xiong et al. (2013) who used a subset of this corpus).
The corpus used in this study included 5,934 spoken responses produced by 1,611 speakers; all learners of English as a foreign language residing in different countries. In addition to a read-aloud task that was not relevant for this paper, the speak-ers were presented with four other tasks. First, the speakers were asked to describe a sequence of six pictures. For the remaining three taks, the speak-ers listened to one announcement and two frag-ments from a lecture and were then asked to sum-marize the content of what they heard. The stu-dents were provided with a list of concepts that test takers were expected to cover in their responses.
For example, a student may have listened to a teacher giving an assignment in history class.1 This assignment required the class to go to the li-brary, look up information about the water supply in old and modern cities, answer the questions on their worksheet, and write a short paragraph about
1
their findings. The students were then asked to re-spond to the following prompt:
Imagine that your classmate was not in class today. Tell your classmate about what the history teacher asked the students to do. Be sure to talk about the following:
- the library - the worksheet - the homework
The corpus contained responses to 24 different prompts with 6 different sets of prompts. Each speaker only answered one set of prompts giving 4 responses per speaker. The recording time for each response was limited to 60 seconds. The ac-tual number of words varied between participants with an average 72 words per response (σ= 29).
From the originally recorded 6,444 responses, we excluded from further analysis 510 responses (about 8%), which contained either no speech or where the quality of the recording was too low for further analysis. All remaining 5,934 responses were scored on a scale of 1-4 by two expert human raters on a holistic scale that reflects all aspects of speaking proficiency, including pronunciation, grammar, and content coverage.2For content cov-erage, the raters were asked to consider whether the key information contained in the prompt was conveyed accurately or, in case of the picture de-scription prompt, whether the story was complete. When the difference in the scores assigned by the two raters was greater than 1, the final score was assigned by an adjudicator.
The corpus was divided into non-overlapping training and testing partitions. The training par-tition contained 3,337 responses from 915 speak-ers and the test partition contained 2,597 spoken responses from 696 speakers. Both partitions in-cluded responses for the same prompts but there was no speaker overlap.
All responses were converted to text using a state-of-the-art automatic speech recognizer (ASR) with constrained vocabulary (see Evanini and Wang (2013) for further details). To evalu-ate the effect of the errors that may have been in-troduced by the ASR system, all responses were
2see http://www.ets.org/s/toefl junior/pdf/toefl junior
comprehensive speaking scoring guides.pdf for the scoring rubrics
transcribed manually by professional human tran-scribers. Comparison with the human transcrip-tion showed that the ASR word error rate for this corpus was 26.5% for picture narration tasks and 29.4% for the summarization tasks.
3.2 Computation of the metrics
Evaluation metrics. ROUGEwas computed using equation (1) as ann-gram (grn) overlap between
candidate summary and each summary (S) from the set of reference summaries (RS).
ROUGEN =
P
S∈RS
P
grn∈S
Countoverlap(grn)
P
S∈RS
P
grn∈S
Count(grn)
(1) We used n-grams whereby n was in a range from 1 to 4 (ROUGE 1-4) and a combination of unigrams with skip-bigrams with maximum step of four words (ROUGE-SU1-4). Finally, we also computed a combined measure ROUGE -ALLwhich is the geometrical mean ofROUGE-1– ROUGE-4, computed by using the same smoothing procedure as forBLEU(Papineni et al., 2002).
We used the cosine distance (CVA) between the response and reference summaries as a baseline metric as this metric is commonly used for eval-uating document similarity in the context of lan-guage assessment. CVA was computed as the co-sine distance between candidate responses and the same reference responses as used for the com-putation of ROUGE. All term frequencies were weighted usingtf-idf wheretfis the frequency of a term in a given response andidf is the inverse document frequency. idf frequencies were com-puted based on all of the responses in the corpus.
Reference summaries. The reference sum-maries were selected from responses with the highest human rater final score (4). This approach is similar to using system outputs as pseudo-models for the evaluation of machine-translation or automatic-summarization systems (cf. Louis and Nenkova (2013)). It has also been success-fully applied to the content assessment of written answers by Madnani et al. (2013) who used one randomly selected highly scored summary as a ref-erence summary.
how many summaries were necessary to achieve consistent results. We therefore computedROUGE for each response using up to 10 randomly se-lected responses with final score of 4. To inves-tigate the effect that different choices of reference summaries may have on the metrics, we repeated the analysis for 20 randomly selected sets of refer-ence responses.
The corpus did not contain a sufficient num-ber of responses with the maximum score for each prompt. Therefore, this part of the analysis was based on a subset of 1,784 responses selected from the training partition. This set included only 12 prompts for which human raters assigned a score of 4 to more than 11 responses.
Text preprocessing.For the evaluation of writ-ten summaries,ROUGEis usually computed using the raw counts of all of the terms. In addition to us-ing this classical approach usus-ing unstemmed terms (‘all’), we also computedROUGEusing three other approaches: (1) excluding all stop-words ( ‘Non-stop’); (2) setting the frequency of all n-grams within each summary to 1, that is, counting types instead of tokens (‘Types’); (3) excluding all stop-words and counting types only (‘Non-stop types’). Finally, we computed all of theseROUGEvariants using raw text as well as lemmatized text. As a re-sult, we computed 72 different variants ofROUGE for each response and each combination of refer-ence summaries: nine different types of ROUGE (eight different n-gram lengths and ROUGE-ALL) computed using four different methods of text pro-cessing and two possible approaches to lemmati-zation. All of the computations were done both on ASR and manual transcriptions.
3.3 Evaluation
We computed the Spearman’s rank correlation be-tween the metric and the holistic score assigned by the first rater to identify the best method of computingROUGEand the optimal number of ref-erences. Performance of the metric may be af-fected by properties of the prompt (cf. (Nenkova and Louis, 2008)), therefore we first analyzed each prompt separately and then selected the variants that achieved the highest performance across all of the prompts. Since correlation coefficients are not normally distributed, we used several non-parametric methods to identify significant differ-ences including non-parametric bootstrapping and non-parametric ANOVAs. These analyses were
done using the data from the training partition of the corpus.
We then evaluated how well the selected vari-ants ofROUGEpredicted human scores using a lin-ear regression model trained on all of the data from the training partition using pooled data from all of the prompts. The model was tested on an unseen test partition that had not been used for any of the analyses.
Finally, we tested whether the new metrics im-proved the performance of the automated scoring engine for spoken responses. The current system assigns scores based on the linear combination of features with empirical weights obtained by train-ing scortrain-ing models on scores assigned by expert raters (Zechner et al., 2009; Higgins et al., 2011). Current features measure various aspects of speak-ing proficiency such as fluency, pronunciation, and grammar usage. The performance of the system is evaluated with correlations and quadratic kappas between the scores assigned by the human raters and rounded predicted scores.
4 Results
All analyses were performed twice: each for met-rics computed using ASR and manual transcrip-tions. We found that although the exact values of the correlation coefficients differed across these two transcriptions, the overall pattern of results remained the same. There was also a high cor-relation in metric values between the two types of transcription (Pearson’srfor different types of ROUGEvaried between 0.81 forROUGE-4 and 0.9 forROUGE-1). Since automated scoring relies on the output of automatic speech recognition, all nu-merical results reported in the main text of this section are based on ASR output. The tables re-port the numbers for both ASR and manual tran-scriptions.
4.1 Number and choice of reference responses
Number of references. To identify the optimal number of references for each prompt and met-rics, we first found Nbest, which had the
high-est correlation with human scores and then iden-tified the lowest number of reference summaries for which the correlation coefficient was not sig-nificantly lower than the correlation coefficient for
Nbest.
were performed using the general method sug-gested by Zou (2007) for comparing overlapping correlations as implemented by Baguley (2012, p.224) but we used bootstrapped confidence inter-vals (Wilcox, 2009). Confidence interinter-vals for each correlation coefficient were constructed using pi-geonhole bootstrapping (Owen, 2007) with 1,000 samples. For each N reference, we pooled the values computed for 20 randomly selected sets of different reference summaries. We then indepen-dently sampled responses and sets of references and selected values at each bootstrap repetition at the intersection of the two samples. The con-fidence intervals were constructed using the ad-justed percentile method (Davison and Hinkley, 1997, p. 203-213). Since this analysis is more sen-sitive to Type II errors (‘false negatives’), we set the significance threshold atα= 0.15.
The optimal number of references varied be-tween prompts, metrics, and methods of compu-tation, but never exceeded 8. On average, opti-mal performance was achieved with 3 references. More references were required to achieve optimal performance for ROUGEbased on longern-grams (using the Kruskal-Wallis test, a non-parametric analysis of variance, p < 2.2×10⁻¹⁶). For
ex-ample, two references on average were required to achieve reliable results for ROUGE-1, but for ROUGE-4 this number was four references. The required number of references was also signifi-cantly dependent on the prompt (Kruskal-Wallis test,p < 2.2×10⁻¹⁶) with averages varying
be-tween two and four. When the number of ref-erences was equal to or greater than the optimal number, there were no significant differences in the correlation coefficients across the different ref-erence models.
For the analysis in the following section each of the 72 variants ofROUGEfor each prompt was computed using the optimal N references identi-fied for this variant and prompt.
4.2 Types ofROUGEand different methods of
computation
The correlation coefficients between the summa-rization metrics and human ratings depended on the length of n-grams (Kruskal-Wallis test p < 2.2×10⁻¹⁶). While all types ofROUGEwere
pos-itively correlated with human ratings, the corre-lation coefficients were the highest for ROUGE-1 andROUGE-SU2-4, which performed significantly
better than ROUGE-3-4 and the combined mea-sures ROUGE-ALL (post-hoc Tukey HSD test on ranked observations,pvaried fromp <1×10⁻¹⁰
to2.804×10−4). The average correlations across
the different types of text pre-processing for ASR and manual transcriptions are shown in Table 1.
Metrics ASR output Manual
ROUGE-1 0.616 0.637
ROUGE-SU4 0.592 0.608
ROUGE-SU3 0.595 0.609
ROUGE-SU2 0.594 0.613
ROUGE-SU1 0.598 0.619
ROUGE-ALL 0.523 0.527
ROUGE-2 0.553 0.560
ROUGE-3 0.468 0.461
[image:6.595.324.510.160.297.2]ROUGE-4 0.366 0.357
Table 1: Average correlation coefficient with hu-man scores (Spearhu-man’sρ) across different meth-ods of computation forROUGEbased onn-grams of different lengths. The table shows the results for metrics computed based on ASR and manual transcriptions.
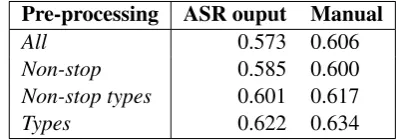
The effect of text pre-processing differed across the metrics: for metrics that relied on consecutive n-grams with n>2, the removal of stop-words led to further drops in performance (Kruskal-Wallis testp=4.4×10⁻⁵). ForROUGE
based on unigrams and skip-bigrams, counting only type frequencies led to a significant im-provement in performance (Kruskal-Wallis test,
p= 0.00017). Correlations for the different types of pre-processing for the measures that performed the best are given in Table 2. Lemmatization did not make a significant difference to metric perfor-mance.
Pre-processing ASR ouput Manual
All 0.573 0.606
Non-stop 0.585 0.600
Non-stop types 0.601 0.617
Types 0.622 0.634
[image:6.595.315.515.600.670.2]Finally, a summarization metric performed bet-ter on tasks that required the test takers to summarize an announcement or lecture (average
¯
ρ= 0.653 forROUGE-1 andROUGE-SU1-4) rather than on tasks that required them to describe a pic-ture sequence (averageρ¯= 0.437, Mann-Whitney-Wilcox test, a non-parametric test for comparing two independent samples,p <2.2×10⁻¹⁶).
4.3 Evaluation of the final model
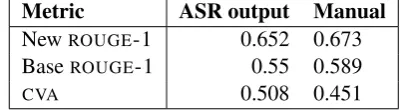
Analysis by prompt showed that the variants of ROUGEthat included unigram counts (ROUGEand ROUGE-SU1-4) had the best correlations with hu-man scores across all prompts. Further improve-ment in their performance was obtained by count-ing type frequencies only and by uscount-ing several ref-erence summaries. The optimalN references for these variants ofROUGEvaried between prompts, but never exceeded four which was therefore se-lected as the optimalNreferences for this corpus. Based on these results we computed ROUGE -1 metrics for all responses in the original train-ing partition ustrain-ing four randomly selected, highly scored responses for each prompt and ‘types’
method of pre-processing. We then compared it with two baselines: (1) cosine distance (CVA) computed using type frequencies only and the same four references, and (2) na¨ıve implementa-tion of ROUGE-1 computed using one randomly selected reference summary and raw frequencies (tokens). The newly adjusted version of ROUGE -1 metrics performed significantly above the base-lines (using Zou’s method for the comparison of overlapping correlations with confidence intervals constructed atα= 0.001). The correlation coeffi-cients are shown in Table 3.
Metric ASR output Manual
NewROUGE-1 0.652 0.673
BaseROUGE-1 0.55 0.589
CVA 0.508 0.451
Table 3: Correlation coefficients with human scores (Spearman’sρ) for the entire training parti-tion for the newly adjusted version ofROUGEand the baseline metrics. The table shows the results for metrics computed based on ASR and manual transcriptions.
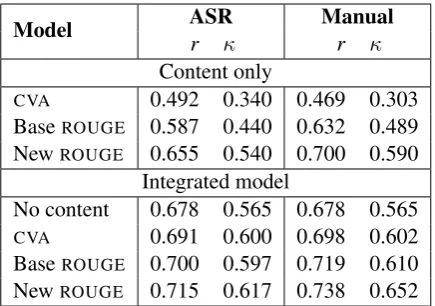
We then trained a standard linear regression model using the human scores as the dependent variables and summarization metrics as
indepen-dent variables. The accuracy of prediction was evaluated using two metrics as suggested, for ex-ample, by Williamson et al. (2012): quadratic weighted kappa (κ) and Pearson’s correlation co-efficient (r) between the observed and predicted scores. For computation ofκ, the predicted scores were trimmed to the range of human scores and rounded to the nearest integer.
Repeated 10-fold cross-validation on the train-ing partition showed that a model based on ROUGE-1 produced averages of ¯r = 0.65 (σ = 0.031) and¯κ= 0.54 (σ = 0.036). The model based on a linear combination of several ROUGE variants using longern-grams and a recursive fea-ture elimination (Kuhn and Johnson, 2013, p. 480) did not show any improvement in the performance as compared to a model based on a singleROUGE -1.
[image:7.595.79.281.562.617.2]Model ASRr κ Manualr κ Content only
CVA 0.492 0.340 0.469 0.303
BaseROUGE 0.587 0.440 0.632 0.489 NewROUGE 0.655 0.540 0.700 0.590
Integrated model
No content 0.678 0.565 0.678 0.565
CVA 0.691 0.600 0.698 0.602
BaseROUGE 0.700 0.597 0.719 0.610 NewROUGE 0.715 0.617 0.738 0.652
Table 4: Performance of the linear regression model based on one content metric and an ‘inte-grated’ model based on 11 features that measure pronunciation, fluency, and grammar before and after the addition of ‘BaseROUGE,’ ‘CVA’ or ‘New ROUGE.’ The table shows the correlation coeffi-cients (Pearson’sr) and quadratic weighted kappa kappas (κ) between the predicted scores and hu-man ratings for the unseen test set. The agree-ment between the two expert raters on this dataset isκ= 0.69.
one aspect of evaluation of automated scoring sys-tems. In addition to high agreement with hu-man scores, operational automatic scoring systems also need to show good construct representation by covering different aspects of speaker perfor-mance (Williamson et al., 2012). This requirement ensures the validity of automated scores and pre-vents future test-takers from fine-tuning their per-formance to one particular feature measured by the scoring system. Therefore the addition ofROUGE to the automated scoring model serves both goals: it improves the agreement with human raters and also expands the construct coverage of the model.
5 Discussion
Summarization metrics can be successfully used to evaluate spoken summaries in the context of language assessment. Although the na¨ıve imple-mentation ofROUGEhad good agreement with the scores assigned by human raters, several modifica-tions led to a further increase in the performance.
Some of our findings show common patterns with what has previously been reported for written summaries. ROUGE-1, ROUGE-SU4 and ROUGE -2 are the three variants of ROUGE most com-monly used for the evaluation of automatic text summaries. Our results showed that the first two
of these measures (ROUGE-1 and ROUGE-SU4) were also most suitable for content assessment of spoken responses. We note that both of these measures include unigram counts. More recently, Rankel et al. (2013) and Owczarzak et al. (2012) reported that metrics based on longer consecutive
n-grams or linear combinations of different vari-ants are more accurate. We did not find this for our data. Since our data represents abstractive sum-maries, poor performances of longer n-grams is not surprising. Finally, as in the case of written summaries, there was no effect of lemmatization while the removal of stop-words sometimes led to a decrease in performance.
Similar to written summaries, the use of more than one reference summary improved the perfor-mance. We found that the optimal number of refer-ence summaries varied between prompts and met-rics. For ROUGE-1, this number never exceeded four across all prompts in our corpus. Further-more, we found that the choice of reference sum-maries from the pool of highly scored responses had no significant effect on the performance of the metric.
In addition to good agreement with human scores, metrics used for automated scoring also need to match the construct of interest, as defined by the assessment program (Williamson et al., 2012). The scoring guidelines for the tasks used in this paper ask raters to judge whether the key information contained in the prompt has been con-veyed accurately. A notable difference between ROUGE and previously used metrics is that as a recall measure, ROUGE does not penalize for the lack of precision. Our results suggest that a recall-oriented approach has better agreement with hu-man judgments than cosine distance which com-bines both precision and recall.
[image:8.595.73.291.61.214.2]re-pairs and repetitions in spoken speech further ag-gravates this problem further. We addressed this issue by only counting type frequencies, which also improved agreement with human judgments.
The adjusted metric had better agreement with human judgments than other “bag-of-words” ap-proaches such as the cosine-based measure com-monly used for content scoring that requires a much larger set of model responses thanROUGE. It also performed equally well on human and ASR transcriptions and did not require any manual an-notation of the data. We also found that the per-formance of ROUGE depended on the task: we obtained better agreement for tasks that required the student to summarize a stimulus rather than tasks that required the student to describe a se-quence of pictures. While in both cases the stu-dents produced short summary-like texts, the pic-ture description task allowed for greater variabil-ity between the responses than the summarization task and, therefore, recall-oriented comparisons with highly-scored responses showed less agree-ment with human scores.
As a “bag-of-words” approach, ROUGE-1 has the same shortcomings as other methods discussed in Section 2.2 in that it doesn’t distinguish be-tween syntactic roles. While variants based on longer n-grams could in theory address this, our results showed that neither a linear nor a geomet-ric combination of these variants with ROUGE-1 improved agreement with human scores. This is-sue has also been acknowledged in the context of non-extractive text summarization and new met-rics such as AutoSummEng (Giannakopoulos and Karkaletsis, 2011) have been developed to address it. Future research will include the conceptualiza-tion and development of metrics that can address the content accuracy of spoken summaries beyond the ‘bag-of-words’ approach.
6 Conclusion
In this paper we applied ROUGE, a recall-based metrics for evaluation of written summaries to the automatic assessment of spoken summaries pro-duced by non-native speakers of English. We per-formed a thorough evaluation of different types of ROUGE by varying the length of n-grams, vari-ous methods of frequency computation, and text-preprocessing. We also explored the effect of the number of reference summaries. We found that the standard baseline implementation ofROUGE-1
computed over the output of the automated speech recognizer showed good agreement with expert ratings and performed better than the cosine sim-ilarity measure commonly used for the evaluation content of spoken responses. A further increase in agreement with human ratings could be achieved by using types instead of tokens for the frequency computation of both candidate and reference sum-maries. We also found that the use of several refer-ence summaries improves the performance of the metric, but only four reference summaries were necessary to achieve reliable results.
Acknowledgments
We would like to thank Keelan Evanini, Nitin Madnani, Xinhao Wang, Derrick Higgins and three anonymous reviewers for their helpful com-ments and suggestions and Ren´e Lawless for edit-ing assistance.
References
Yigal Attali and Jill Burstein. 2006. Automated essay scoring with e-rater V. 2. The Journal of Technology, Learning and Assessment, 4(3):1–30.
Thomas Baguley. 2012. Serious Stats: A guide to ad-vanced statistics for the behavioral sciences. Pal-grave Macmillan.
Douglas Biber, Susan M. Conrad, Randi Reppen, Pat Byrd, Marie Helt, Victoria Clark, Viviana Cortes, Eniko Csomay, and Alfredo Urzua. 2004. Rep-resenting language use in the university: analysis of TOEFL 2000 Spoken and Written academic lan-guage corpus. Educational Testing Service, Prince-ton.
Miao Chen and Klaus Zechner. 2012. Using an on-tology for improved automated content scoring of spontaneous non-native speech. InProceedings of the 7th Workshop on Building Educational Applica-tions Using NLP, pages 86–94, Stroudsburg, PA. As-sociation for Computational Linguistics.
Lei Chen, Klaus Zechner, and Xiaoming Xi. 2009. Im-proved pronunciation features for construct-driven assessment of non-native spontaneous speech. In
Proceedings of Human Language Technologies: The 2009 Annual Conference of the North American Chapter of the Association for Computational Lin-guistics, NAACL ’09, pages 442–449, Stroudsburg, PA, USA. Association for Computational Linguis-tics.
Anthony C. Davison and David V. Hinkley. 1997.
Bootstrap Methods and their Application (Cam-bridge Series in Statistical and Probabilistic Mathe-matics). Cambridge University Press.
Keelan Evanini and Xinhao Wang. 2013. Automated speech scoring for non-native middle school stu-dents with multiple task types. Proceedings of In-terspeech 2013, Lyon, France, pages 2435–2439.
Peter W. Foltz, Darrell Laham, and Thomas K. Lan-dauer. 1999. Automated essay scoring: applica-tions to educational technology. In B. Collis and R. Oliver, editors, Proceedings of World Confer-ence on Educational Multimedia, Hypermedia and Telecommunications 1999, pages 939–944.
George Giannakopoulos and Vangelis Karkaletsis. 2011. AutoSummENG and MeMoG in Evaluat-ing Guided Summaries. In TAC 2011 Workshop, Gaithersburg, MD, USA. NIST.
Derrick Higgins, Xiaoming Xi, Klaus Zechner, and David Williamson. 2011. A three-stage approach to the automated scoring of spontaneous spoken re-sponses. Computer Speech & Language, 25(2):282– 306, April.
Makoto Hirohata, Yousuke Shinnaka, Koji Iwano, and Sadaoke Furui. 2005. Sentence extraction-based presentation summarization techniques and evalua-tion metrics. InAcoustics, Speech, and Signal Pro-cessing, 2005. Proceedings. (ICASSP ’05). IEEE In-ternational Conference on, volume 1, pages 1065– 1068.
Max Kuhn and Kjell Johnson. 2013. Applied Predic-tive Modeling. Springer.
Chin-Yew Lin and Marina Rey. 2004. ROUGE: A package for automatic evaluation of summaries. In Stan Szpakowicz Marie-Francine Moens, edi-tor,Text Summarization Branches Out: Proceedings of the ACL-04 Workshop, pages 74–81, Barcelona, Spain. Association for Computational Linguistics.
Chin-Yew Lin. 2004. Looking for a few good metrics: Automatic summarization evaluation - how many samples are enough. In Proceedings of the NTCIR Workshop, pages 1765–1776, Tokyo.
Annie Louis and A Nenkova. 2013. Automatically assessing machine summary content without a gold standard. Computational Linguistics, 39(2):267– 300.
Nitin Madnani, Jill Burstein, John Sabatini, and Tenaha O’Reilly. 2013. Automated scoring of a summary-writing task designed to measure reading compre-hension. InProceedings of the 8th Workshop on In-novative Use of NLP for Building Educational Ap-plications, pages 163–168, Atlanta, Georgia. Asso-ciation for Computational Linguistics.
Ani Nenkova and Annie Louis. 2008. Can you sum-marize this? Identifying correlates of input difficulty for generic multi-document summarization. In Pro-ceedings of the ACL-08: HLT, pages 825–833. As-sociation for Computational Linguistics.
Ani Nenkova and Kathleen McKeown. 2011. Auto-matic summarization. Foundations and Trends in Information Retrieval, 5(2-3):103–233.
Karolina Owczarzak, John M. Conroy, Hoa Trang Dang, and Ani Nenkova. 2012. An assessment of the accuracy of automatic evaluation in summariza-tion. InProceedings of workshop on evaluation met-rics and system comparison for automatic summa-rization., pages 1–9, Stroudsburg, PA. Association for Computational Linguistics.
Art B. Owen. 2007. The pigeonhole bootstrap. The Annals of Applied Statistics, 1(2):386–411.
Kishore Papineni, Salim Roukos, Todd Ward, and Wei-jing Zhu. 2002. BLEU : a Method for Automatic Evaluation of Machine Translation. In Proceed-ings of the 40th Annual Meeting of the ACL, pages 311–318, Philadelphia, PA. Association for Compu-tational Linguistics.
Gerald Penn and Xiaodan Zhu. 2008. A Critical Reassessment of Evaluation Baselines for Speech Summarization. Inin Proceedings of RANLP work-shop on Crossing Barriers in Text Summarization Research, number June, pages 470–478, Columbus, Ohio, June. Association for Computational Linguis-tics.
Peter A. Rankel, John. M. Conroy, Hoa Trang Dang, and Ani Nenkova. 2013. A decade of automatic content evaluation of news summaries: reassessing the state of the art. In Proceedings of the 51st An-nual Meeting of the Association for Computational Linguistics, Sofia, Bulgaria, August 4-9, 2013, pages 131–136, Sofia. Association for Computational Lin-guistics.
Rand R. Wilcox. 2009. Comparing Pearson correla-tions: dealing with heteroscedasticity and nonnor-mality. Communications in Statistics - Simulation and Computation, 38(10):2220–2234.
David M. Williamson, Xiaoming Xi, and F. Jay Breyer. 2012. A framework for evaluation and use of au-tomated scoring. Educational measurement: issues and practice, 31(1):2–13.
Shasha Xie, Keelan Evanini, and Klaus Zechner. 2012. Exploring content features for automated speech scoring. In NAACL HLT ’12 Proceedings of the 2012 Conference of the North American Chapter of the Association for Computational Linguistics: Hu-man Language Technologies, pages 103–111.
spoken responses containing multiple parts with fac-tual information. In Pierre Badin, Thomas Hue-ber, G´erard Bailly, Didier Demolin, and Franc¸oise Raby, editors,Proceedings of SLaTE 2013, Greno-ble, France, pages 137–142, Grenoble.
Klaus Zechner, Derrick Higgins, Xiaoming Xi, and David M. Williamson. 2009. Automatic scoring of non-native spontaneous speech in tests of spoken English. Speech Communication, 51(10):883–895. Guang Yong Zou. 2007. Toward using confidence