R E S E A R C H
Open Access
Automatic protective ventilation using the
ARDSNet protocol with the additional monitoring
of electrical impedance tomography
Anake Pomprapa
1*, David Schwaiberger
2, Philipp Pickerodt
2, Onno Tjarks
2, Burkhard Lachmann
2and Steffen Leonhardt
1Abstract
Introduction:Automatic ventilation for patients with respiratory failure aims at reducing mortality and can minimize the workload of clinical staff, offer standardized continuous care, and ultimately save the overall cost of therapy. We therefore developed a prototype for closed-loop ventilation using acute respiratory distress syndrome network (ARDSNet) protocol, called autoARDSNet.
Methods:A protocol-driven ventilation using goal-oriented structural programming was implemented and used for 4 hours in seven pigs with lavage-induced acute respiratory distress syndrome (ARDS). Oxygenation, plateau pressure and pH goals were controlled during the automatic ventilation therapy using autoARDSNet. Monitoring included standard respiratory, arterial blood gas analysis and electrical impedance tomography (EIT) images. After 2-hour automatic ventilation, a disconnection of the animal from the ventilator was carried out for 10 seconds, simulating a frequent clinical scenario for routine clinical care or intra-hospital transport.
Results:This pilot study of seven pigs showed stable and robust response for oxygenation, plateau pressure and pH value using the automated system. A 10-second disconnection at the patient-ventilator interface caused impaired oxygenation and severe acidosis. However, the automated protocol-driven ventilation was able to solve these problems. Additionally, regional ventilation was monitored by EIT for the evaluation of ventilation in real-time at bedside with one prominent case of pneumothorax.
Conclusions:We implemented an automatic ventilation therapy using ARDSNet protocol with seven pigs. All positive outcomes were obtained by the closed-loop ventilation therapy, which can offer a continuous standard protocol-driven algorithm to ARDS subjects.
Introduction
Acute respiratory distress syndrome (ARDS) is a severe form of acute multifactorial lung injury with acute hyp-oxic respiratory failure. Despite extensive information on ARDS regarding its clinical features [1-4], pathologic find-ings [5] and prognosis [6,7], the mortality has remained unchanged for many decades [8,9]. A considerable chal-lenge in critical care medicine is therefore to rescue ARDS patients by means of ventilatory therapy in the short term and to optimize morbidity in the long term [10].
The term ARDS was first introduced in 1967 [11]. How-ever, a clear definition was not quantified and remained controversial for many decades [12]. In 1994, a standard
definition was recommended by the American–European
Consensus Conference committee [13]. The pathological state of ARDS was defined by the ratio of arterial oxygen tension (PaO2) and fraction of inspired oxygen (FiO2)
(PaO2/FiO2< 200) in the presence of bilateral
infil-trates on the chest X-ray image and pulmonary artery
wedge pressure≤18 mmHg. In 2012, the definition
of ARDS was revised and called the Berlin definition [14,15]. The criteria were similar to those of the American– European Consensus Conference, but with further clas-sification of the severity; that is, mild (200 < PaO2/FiO2≤
300), moderate (100 < PaO2/FiO2≤200) and severe (PaO2/ * Correspondence:pomprapa@hia.rwth-aachen.de
1Philips Chair of Medical Information Technology, Helmholtz-Institute for
Biomedical Engineering, RWTH Aachen University, Pauwelsstrasse 20, Aachen 52074, Germany
Full list of author information is available at the end of the article
FiO2≤100) at positive end-expiratory pressure (PEEP)≥
5 cmH2O [15].
ARDS is caused by the formation of protein-rich alveolar edema after damage to the integrity of the alveolar– capil-lary barrier [16]. Patients with ARDS generally experience shortness of breath with loss of lung compliance due to the formation of noncardiogenic pulmonary edema and inacti-vation of surfactant, leading to alveolar collapse and atelec-tasis. Progressive hypoxia and an increased work of breathing are then unavoidable. At the onset, ventilation support with mechanical ventilation is generally required.
Since 2000, protective ventilation using the Acute Re-spiratory Distress Syndrome Network (ARDSNet) proto-col has continued to be the cornerstone in intensive care for ARDS therapy. With this ventilation strategy, a reduc-tion of mortality (31% vs. 39.8%) was clearly demonstrated as compared with conventional ventilation using a higher tidal volume per kilogram of predicted body weight (PBW) of 12 ml/kg [17]. With this outstanding result, the original ARDSNet protocol was implemented in our auto-matic ventilation therapy system. The therapeutic ap-proach focuses not only on avoiding ventilator-induced lung injury by using low tidal volume per PBW (≤6 ml/kg) and restricted plateau pressure (Pplat ≤30 cmH2O), but
also on providing sufficient gas exchange with defined oxygenation targets and meeting pH goals. The goals for protective ventilation using this protocol are to improve and regulate oxygenation, to minimize Pplatand to control
pH value. Five ventilatory settings are of particular inter-est: FiO2, PEEP, tidal volume (VT), respiratory rate (RR)
and inspiratory–expiratory time ratio (I:E ratio).
To achieve these goals, the ventilation variables have to be properly adjusted during ventilatory therapy, which generally requires continuous care from clinical staff, es-pecially for patients with severe ARDS. To minimize the workload of daily clinical practice and to maintain the standard protocol of protective ventilation, we introduce automatic control of ventilation as a concept for the treatment. In this article, we describe a strategy of auto-matic ventilation in ARDS patients, including continu-ous monitoring of regional ventilation at thoracic cavity using electrical impedance tomography (EIT) images [18]. All therapeutic decisions in this context rely on the original ARDSNet protocol.
Materials and methods
In this section, we describe the concept for automatic ventilation using the ARDSNet protocol and present some details on the implementation.
System setup
The system consists of a panel PC (PPC-154 T; Advantech Co., Ltd, Taipei, Taiwan), a mechanical ventilator (SERVO 300; Marquet Critical Care AB, Solna, Sweden), and other
equipment including a capnography device with pulse
oximetry (CO2SMO+; Philips Respironics, Best, The
Netherlands), a spectrophotometry device (CeVOX; Pulsion Medical Systems SE, Feldkirchen, Germany) to measure ar-terial oxygen saturation (SaO2), a patient monitor (Sirecust
960; Siemens AG, Munich, Germany), and an EIT device (GOE-MF II; Dräger AG, Lübeck, Germany). All measured signals are transmitted directly to the panel PC including parameters from the mechanical ventilator, by which airway pressure and airway flow are converted by a 12-bit analog-to-digital converter (KPCMCIA-12AI-C; Keithley Instru-ments Inc., Cleveland, OH, USA). The computed com-mands of ventilatory variables are transmitted from the panel PC to the mechanical ventilator by a 12-bit digital-to-analog converter (PCMDA12B; SuperLogics Inc., Waltham, MA, USA). Automatic adjustment of ventila-tory settings can be made by this setup.
Communication protocol
The protocols from the different commercial devices are graphically programmed using Labview software (version 7.1; National Instruments Inc., USA). The specific bin-ary codes for each device are transmitted from the panel PC to the devices. The interfaces are based on RS-232 standard. To obtain the up-to-date measured parame-ters, the requested commands must be repeatedly sent to all devices in every sampling period of 100 millisec-onds. Once the panel PC receives a response from a de-vice, the data are decoded and saved on a regular basis within the sampling time.
Preparation for animal studies
After approval from the Department of Health and Social Services Berlin (reference number IC 113-G0151/10), all animal procedures were conducted complying with na-tional regulations and instituna-tional animal care committee guidelines. Seven female domestic pigs (29 ± 3 kg) received premedication and general anesthesia with thiopental, fen-tanyl and pancuronium, and were then tracheotomized in a supine position. A spectrophotometry catheter (CeVOX; Pulsion Medical Systems AG) was inserted into the ca-rotid artery for measuring SaO2. Noninvasive
measure-ments of peripheral oxygen saturation (SpO2) from
capnography device and from the patient monitor were placed at the left ear and at the tail, respectively. In addition, a central venous line and a pulmonary artery catheter were placed into the internal jugular vein for continuous monitoring of pulmonary artery pressure and central venous pressure and for drug and crystalloid fluid infusion. Subsequently, the pigs underwent surfactant depletion with repetitive lavages by warm (37 to 38°C) saline solution (0.9% NaCl, 40 ml/kg body weight) to
in-duce ARDS (PaO2/FiO2< 200 mmHg) at FiO2 of 1.0
times (average three times) within 5 minutes. The pigs were then ventilated in volume-controlled mode with VTof 6 ml/kg body weight and static PEEP of 5 cmH2O.
After 30 minutes, the closed-loop ventilation was started. However, after 2 hours of ventilation, a disconnec-tion from the ventilator was performed for 10 seconds, simulating involuntary patient–ventilator disconnection during patient handling.
ARDSNet protocol
To some extent, our algorithm of the ARDSNet protocol is based on earlier work of our group [20,21]. The proto-col is a ventilation strategy using low tidal volume at 6 ml/kg of the PBW based on the formulae given in Equations (1) and (2) for male and female subjects [17]:
PBW maleð Þ ¼50þ2:3ðheight inches½ −60Þ ð1Þ
PBW femaleð Þ ¼45:5þ2:3ðheight inches½ −60Þ ð2Þ In the present study, PBW was replaced with the actual measured body weight for the ventilation setting on VT.
The following goals should be fulfilled.
Oxygenation goal: PaO2for 55 to 80 mmHg or SpO2for 88
to 95%
A linear combination between PEEP and FiO2, shown in
Table 1 for lower PEEP/higher FiO2, was applied for
control of oxygenation.
Generally, PEEP is used to prevent lung collapse, while more FiO2is given in order to meet the predefined
oxy-genation goal. The increment of both ventilation vari-ables improves oxygenation for ARDS patients. Hence,
in our implementation, the lower PEEP/higher FiO2
table of the protocol [17] was used for the automatic ventilation.
Plateau pressure goal:≤30 cmH2O
Based on the recommendation, Pplat should be checked
at least every 4 hours and also after the change of PEEP or VT. In our automatic ventilation scheme, Pplat was
automatically checked every 10 minutes. The inspiratory pause was set to 0.5 seconds for five consecutive breaths, and the average of Pplat from these breaths was used to
represent the measured Pplat. Further corrective action
for VTadjustment is carried out by the following rules: if
Pplat> 30 cmH2O, tidal volume per weight (VTPW) may
be decreased by 1 ml/kg with the minimum value of 4 ml/kg; and if Pplat< 25 cmH2O and VTPW< 6 ml/kg,
VTPWmay be increased by 1 ml/kg until Pplat> 25 cmH2O
or VTPW= 6 ml/kg.
Hence, VTPW was generally set to 6 ml/kg but was
allowed to be reduced to 4 or 5 ml/kg if Pplat> 30 cmH2O.
On the other hand, VTPWwas allowed to be 7 or 8 ml/kg
if breath stacking or dyssynchrony was observed during the ventilation therapy. For the implementation, Pplatwas
regularly evaluated about every 10 minutes.
pH goal: 7.30 to 7.45
Arterial pH values were measured by arterial blood gas (ABG) analysis (ABL 5; Radiometer Copenhagen, Copenhagen, Denmark) every 30 minutes; this value was manually entered into the panel PC for further evaluation of the pH goal. The initial RR was set to approximate baseline minute ventilation, but should be limited by a maximum value of 35 breaths per minute (bpm). The initial setting of RR was computed as follows:
RR¼V MVbaseline
TPW Weight ð3Þ
Based on the averaged body weight of the pigs (29 ± 3 kg), baseline minute ventilation of 4 l/minute was chosen for the initial setting of RR. Further adjustment of RR was based on the measured pH value by the resulting acidosis or alkalosis.
Rules for acidosis management (pH < 7.30)
The following rules were followed for management of acidosis: if pH = 7.15 to 7.30, RR should be increased until pH > 7.30 or PaCO2< 25 mmHg (maximum RR =
35 bpm); if pH < 7.15, RR should be increased to 35 bpm; and if pH remains < 7.15, VTPW should be
in-creased by 1 ml/kg until pH > 7.15 (maximum VTPW=
8 ml/kg).
Rules for alkalosis management (pH > 7.45)
If pH > 7.45, RR should be decreased. A stepwise change of RR is set at ±5 bpm with the aim to control pH value.
Inspiratory–expiratory ratio goal
Generally, the I:E ratio for ARDS patients is set between 1:1 and 1:3. In the present study, the I:E ratio was fixed at 1:2.
Programming architecture
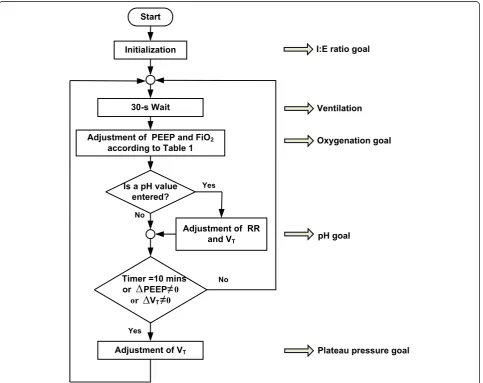
The protocol can be effectively developed by goal-oriented structural programming. The overall complexity
Table 1 PEEP and FiO2combination from the ARDSNet protocol (lower PEEP/higher FiO2)
PEEP (cmH2O) 5 5 8 8 10 10 10 12 14 14 14 16 18 18 to 24
FiO2 0.3 0.4 0.4 0.5 0.5 0.6 0.7 0.7 0.7 0.8 0.9 0.9 0.9 1.0
of the protocol is simplified by a task-based program-ming structure, presented in Figure 1. This structure in-creases efficiency in coding the program.
Once the automatic ventilation is started, the initiali-zation activates all initial settings of ventilation variables, such as PEEP, FiO2, VT, RR, and I:E ratio. Regarding the
oxygenation goal, PEEP of 14 cmH2O and FiO2 of 0.7
from the middle of the Table 1 are initially selected. These settings should be given for a number of breaths and this is represented by a 30-second waiting block or the ventilation task in Figure 1. Thereafter, SaO2is
evalu-ated for further adjustment of the PEEP and FiO2
combination.
During the experiments, a number of choices for oxy-genation goal can be made either by invasive measurement
of SaO2 from the spectrophotometry device (CeVOX;
Pulsion Medical Systems SE), or by noninvasive
measure-ment of SpO2from the capnography device (CO2SMO+;
Philips Respironics), or from the patient monitor (Sirecust
960; Siemens AG). In our experiments, SaO2 measured
from CeVOX was chosen for control of oxygenation. If SaO2falls below 88%, a higher combination of PEEP and
FiO2should be given. In contrast, if SaO2rises above 95%,
a lower combination of PEEP and FiO2should be applied
to minimize hemodynamic effects of PEEP and to reduce the risk of oxygen toxicity.
After achieving the oxygenation goal, the next step is to check for the pH goal. If there is no new pH value, a further evaluation of Pplatshould be made. However, if
a new pH value is manually given, proper adjustment of
RR and VTshould be performed for the pH goal. After
fulfilling the pH goal, the plateau pressure goal is car-ried out every 10 minutes or after a change in PEEP or
a change in VT. All new variables are applied to the
[image:4.595.58.542.322.705.2]subject for a number of breaths. This repeated process is continuously performed. Using this goal-oriented
structure, all goals of the ARDSNet protocol will be accomplished.
Results
Employing the porcine model of induced surfactant deple-tion as previously described, we now present the results of the automatic ventilation therapy using the Acute Respira-tory Distress Syndrome Network (autoARDSNet) proto-col, based on invasive measurement of SaO2in the carotid
artery, with additional EIT images.
Oxygenation goal during the autoARDSNet protocol Seven cases of porcine dynamics were studied with the protocol. As an example of the system performance, we present 4 hours of ventilation from one of the pigs (27 kg). During the lavage, the ventilation settings were set by manual operation and the automatic mode was subsequently turned on for ventilation therapy after
PaO2/FiO2< 200 mmHg for 15 minutes. The
[image:5.595.57.540.537.692.2]oxygen-ation was kept within the range between 88 and 95%, hence satisfying the oxygenation criterion. Using Table 1, the knowledge-based controller was able to stabilize and regulate the SaO2value.
Figure 2 shows the response of lung lavage in the first 30 minutes and the automatic ventilation for stabilization and regulation of SaO2 by adjusting PEEP and FiO2
re-ferred to in Table 1. At 2.5 hours, or 2 hours after auto-matic ventilation, a disconnection of ventilation was made for 10 seconds, simulating a clinical scenario of airway suction or accidental disconnection. The controller was able to recover the critical situation of low oxygenation by step-by-step change for the values of PEEP and FiO2, until
PEEP of 24 cmH2O and FiO2 of 1.0. Subsequently, an
automatic titration of suitable PEEP and FiO2was carried
out again to fulfill the oxygenation goal.
Plateau pressure during the autoARDSNet protocol
To minimize ventilator-induced lung injury, the Pplat
goal should be kept below 30 cmH2O by the adjustment
of VT [13]. During the time 0.5 to 2.5 hours shown in
Figure 3, Pplat was definitely less than 25 cmH2O while
VTPWwas maintained at 6 ml/kg.
During the time between 2.5 and 3.25 hours (hypoxia as presented in Figure 2 due to disconnection at the pa-tient–ventilator interface at 2.5 hours), Pplat was >30
cmH2O and VTPWwas reset from 6 to 5 ml/kg and from
5 to 4 ml/kg, respectively, while the PEEP and FiO2
combination was increased to possible maximum values. At 3.25 hours, when Pplat< 25 cmH2O and VTPW< 6 ml/
kg, VTPWwas automatically increased stepwise by 1 ml/kg
increments to 5 ml/kg. Using this approach, the goal of Pplat is satisfied with the main objective to minimize
Pplat≤30 cmH2O.
pH goal during the autoARDSNet protocol
Figure 4 shows the result of pH control for the 27 kg pig. The pH values were regularly measured every 30 mi-nutes. At 0.5, 1 and 1.5 hours, the pH value was <7.30, and RR was increased by 5 bpm after entering the pH value into the system. At 2 and 2.5 hours, the pH goal was satisfied and RR remained unchanged. At 2.5 hours, ABG was measured before the 10-second disconnection at the patient–ventilator inter-face. At the next ABG (3 hours), the pH value falls below 7.15. RR was immediately set at 35 bpm to treat
severe acidosis due to disconnection at the patient–
ventilator interface. With the maximum limit of RR at 35 bpm, this resulted in an increase of the pH value to >7.15. At 3.5 and 4 hours, the pH value was 7.15 to 7.30 and RR should be increased. How-ever, RR was already at its limit set at 35 bpm.
Monitoring of carbon dioxide
Figure 5 shows arterial carbon dioxide tension (PaCO2)
from ABG and end-tidal carbon dioxide (etCO2) during
the 4 hours of ventilation. PaCO2 significantly
in-creased after lung lavage, which indicates poor gas ex-change or partial lung collapse (atelectasis). This is also
confirmed by the SaO2curve and the EIT images in the
next subsection. After turning on the protocol for 2 hours during 0.5 to 2.5 hours, gas exchange was
gradually improved due to the ventilation therapy. Again, at 2.5 hours, poor gas exchange recurred during hyp-oxia because of disconnection at the patient–ventilator
interface for 10 seconds. Since PaCO2 was taken
be-fore disconnection at the patient–ventilator interface, severe hypercapnia was later detected (at 3 hours). However, the automatic ventilation improved gas ex-change and severe hypercapnia was relieved in a timely manner.
0 0.5 1 1.5 2 2.5 3 3.5 4
15 20 25 30 35 40
R
R
[bpm
]
0 0.5 1 1.5 2 2.5 3 3.5 4
7 7.1 7.2 7.3 7.4
pH
Time [h]
Lavage Automatic ventilation using ARDSNet Protocol
Alkalosis management: pH > 7.45
Acidosis management: pH < 7.30
10-s disconnection
10-s disconnection
Severe acidosis: pH < 7.15
Figure 4Control of the pH value for the 27 kg pig.Circles on the pH curve indicate manual arterial blood gas measurements. ARDSNet, Acute Respiratory Distress Syndrome Network; RR, respiratory rate.
[image:6.595.56.539.410.704.2]By monitoring carbon dioxide parameters, physio-logical dead space can be estimated by Bohr–Enghoff’s equation [22]:
VD
VT ¼
PaCO2−etCO2
PaCO2 ð
4Þ
where VD denotes physiological dead space. Based on
the dataset of 4-hour ventilation, the average fraction of physiological dead space for this pig was 0.39. In the other words, approximately 60% of the tidal volume took part in the gas exchange.
Electrical impedance tomography
[image:7.595.55.539.91.304.2]EIT allows non-invasive monitoring of electrical imped-ance within the thoracic cavity in a two-dimensional and cross-sectional plane in order to assess regional ventilation [23]. Pathophysiological changes of the lung can be observed from the EIT images in real time at the bedside. Sixteen electrodes were used for the voltage measurement and the backprojection algorithm [24] was implemented for image reconstruction. A 32 pixel × 32 pixel EIT image is captured at the end of inspiration, as shown in Figure 6. Based on the attachment of the EIT belt in the predefined arrangement of the elec-trodes shown in Figure 6 (left image), ventral and dorsal
Figure 6Orientation of electrical impedance tomography belt with 16 electrodes and the reconstructed 32 pixel × 32 pixel EIT image after induction of ARDS in the rainbow-color coding scheme.ARDS, Acute Respiratory Distress Syndrome; EIT, electrical impedance tomography; L, left; R, right.
0 0.5 1 1.5 2 2.5 3 3.5 4
0 20 40 60 80
et
C
O2
[mmH
g
]
0 0.5 1 1.5 2 2.5 3 3.5 4
40 60 80 100
Pa
C
O2
[mmH
g
]
Time [h]
Lavage Automatic ventilation using ARDSNet Protocol
10-s disconnection
10-s disconnection Manual ABG measurement
10-s disconnection
1 min 15 min
2.5 2.55 2.6 2.65 2.7 2.75
0 20 40 60 80
et
C
O2
[m
m
H
g
]
[image:7.595.60.538.547.695.2]Time [h]
parts of the animal are situated at the top (electrode position 1) and at the bottom (electrode position 9) of the EIT image, respectively. The position of the left and right lungs can therefore be determine in the specified position as shown and similar to the standard interpret-ation, obtained from a computed tomography scan image.
All seven female pigs (weighing 29 ± 3 kg) were venti-lated using the autoARDSNet protocol; the results of their EIT images are summarized in Figure 7. These results show the EIT images before and after lavage, and after 2 hours and 4 hours of ventilation using the protocol. The area of high electrical impedance corresponds to the movement of air, which is designated by tones of orange and yellow. After lavage, a loss of lung volume and poor dorsal ventilation can be observed by the images in all cases. After 2 hours and 4 hours of ventilation, a progres-sive improvement of dorsal ventilation can be seen com-pared with the EIT images after lavage.
Regarding pig #7, pneumothorax was observed by EIT image after 2 hours of ventilation demonstrating that only the left lung was ventilated. A corrective action was made at 2.75 hours to release excess pressure at the right lung, which improved lung compliance, oxygenation, hemodynamics and carbon dioxide exchange. Based on this experience, we believe that the EIT device is useful for practical decision-making at the bedside.
Regional analysis of ventilation [25] was carried out for six pigs (excluding pig #7 due to the pneumothorax), as shown in Figure 8. Horizontal bars represent the me-dian of regional ventilation in percent at each specific pixel, while the whiskers are the outliers of extreme
regional ventilation. Before lavage, median regional ventilation at the 15th pixel contributed the most to ventilation (55%). After lavage, the 13th pixel occupied the leading median regional ventilation of 48%, reflect-ing atelectasis in dorsal lung sections. After 2 hours and 4 hours of automated ventilation, the 14th pixel contributed the most to median regional ventilation of 45% and 50%, respectively, signifying the recruitment of previously atelectatic surface.
Significant parameters during the autoARDSNet protocol Box-and-whisker plots indicating the median (25th to 75th percentiles) are shown in Figure 9. These plots quantitatively describe various significant parameters for all seven pigs. The parameters are presented before lav-age, after lavage and every 0.5 hours. During the process
of lavage inducing ARDS, PaO2/FiO2 was evaluated by
ABG. The median of PaO2/FiO2was 70 mmHg and all
cases were below 100 mmHg, representing severe ARDS. By regulating SaO2at 88 to 95% in Figure 9a, PaO2/FiO2
values were improved for all cases by the protocol as shown in Figure 9b. At 2.5 hours, disconnection at the patient–ventilator interface was carried out and the me-dian of PaO2/FiO2was 94 mmHg. The 4 hours of
venti-lation using the protocol increased PaO2/FiO2 and the
ARDS condition generally improved from severe ARDS to moderate ARDS based on the Berlin definition [15].
In Figure 9c, the Pplatgoal≤30 cmH2O was satisfied in
[image:8.595.59.540.89.314.2]may increase from 4 to 5 l/minute to improve the pH value at the beginning of automatic ventilation.
Based on PaCO2measured from ABG every 0.5 hours,
Figure 9e represents permissive hypercapnia with an ap-proximate value of 60 mmHg. Whilst Figure 9f shows etCO2of an average 43 mmHg during ventilation therapy,
etCO2 differed significantly from PaCO2, indicating a
diffusion problem.
Discussion
To achieve the oxygenation goal, two parameters (PaO2
in the range 55 to 80 mmHg and SaO2between 88 and
95%) can be selected for the control objective. PaO2was
not chosen for this control objective because no com-mercial device for continuous measurement currently exists. In our setup, a change in PEEP and FiO2translates
to changes of SaO2at the carotid artery in about 7 seconds,
whereas it takes about 40 seconds for a change of SpO2at
the pig tail. SaO2would also be valid even if circulation
centralizes. However, technically both the SaO2 and the
SpO2 signals can be used in our system. Because of the
more stable and faster SaO2response time, we chose this
signal for establishing our automatized ARDSNet proto-col. From a clinical perspective, SaO2measurements will
need to be replaced by high-quality SpO2measurements.
PEEP also plays a vital role to prevent atelectasis. Several tables for lower and higher PEEP have been proposed as a guideline for ventilating a patient [17,18]. However, the proposed PEEP value might not be optimal: if PEEP is too high, it will cause regional hyperinflation: if PEEP is too low, it will cause dorsal end-expiratory collapse and ex-cessive cyclic shear forces between atelectatic and non-atelectatic areas [26]. To optimize PEEP, many titration techniques have been developed; for instance, using the stress index [27,28], the assessment of transpulmonary pressure [29], or the optimization of ventilation homo-geneity by EIT [30]. Owing to possible oxygen toxicity
[image:9.595.59.539.90.489.2]by excess FiO2 [31], a feedback control system for
regulating oxygenation to prespecified targets using
FiO2[32] may thus use any combination of the
proto-cols described above for PEEP titration. Hyperoxia shall then be avoided. Hence, many options to reach the oxy-genation goal are available for a new formulation of PEEP–FiO2combination.
Pplat was measured during an end-inspiratory pause
for 0.5 seconds and represents alveolar pressure. Pplat>
30 cmH2O is associated with a higher mortality rate
[17]. To fulfill the second goal of protective ventilation,
VTPW should be reduced in stepwise increments of 1
cmH2O, with a lowest limit of 4 ml/kg. For severe ARDS
patients, PEEP should be set relatively high enough to satisfy oxygenation goal. Hence, VTPWshould
automatic-ally be minimized to either 5 or 4 ml/kg, so that Pplatis
forced to be less than 30 cmH2O. During ventilation
therapy using the autoARDSNet protocol, Pplat may not
be able to meet the goal at all times. With automatic ventilation, Pplat was regularly evaluated and discrete
(sampling) control of the Pplatvalue is implemented.
The pH goal can be achieved by adjusting of RR and
VT based on ABG taken every 30 minutes. With this
time frame, perfect control of the pH value may not al-ways be satisfied. Better control of the pH value can (theoretically) be improved by introducing continuous measurement of the pH value; however, no device is cur-rently available to achieve this. Additionally, during the animal studies, an I:E ratio of 1:2 was fixed for the entire
period of ventilation. A change of I:E ratio can influence carbon dioxide elimination [33]. For an adult, a range of 1:1 to 1:3 is considered acceptable for mechanical venti-lation. Further studies are needed to examine changes in the I:E ratio and their correlation with the pH goal dur-ing automatic ventilation therapy. Carbon dioxide con-trol based on adjustment of the I:E ratio would add another dimension of algorithmic flexibility; however, it would also increase the complexity of the rule base.
The three main goals, namely oxygenation, pH and plateau pressure, are targeted during the therapy. The oxygenation goal is considered highest priority, and in our algorithm the evaluation of this goal is carried out every 30 seconds. Owing to a rather slow response of the underlying physiological dynamics, the delay time of
30 seconds was chosen for acquiring the SaO2response
for a particular setting of ventilatory variables. Plateau pressure and pH goals were considered of secondary and tertiary priority and thus their evaluation periods were chosen to be 10 minutes and 30 minutes, respectively. Remember that in the original ARDSNet protocol the advice was to measure Pplat at least every 4 hours [17].
For the pH goal, measurements were based on 30-minute ABG analysis.
The monitoring of carbon dioxide (PaCO2and etCO2)
[image:10.595.56.539.90.342.2]provides useful physiological information for gas exchange and physiological dead space. During 4 hours of ventila-tion, dead space was relatively constant, and in such cases Figure 9Box-and-whisker plots for significant parameters during automatic ventilation therapy using the Acute Respiratory Distress Syndrome Network protocol. (a)Arterial oxygen saturation (SaO2).(b)Arterial oxygen tension/fraction of inspired oxygen (PaO2/FiO2).
etCO2could be used to estimate PaCO2, even in the case
of inhomogeneous lung condition in such cases as ARDS. The adjustment of RR therefore leads to a regulation of etCO2and PaCO2[34]. Based on a mass balance, Equation
(4) assumes that all the expired carbon dioxide comes from the alveolar gas. For the impaired alveolar gas exchange, there are a number of possible causes; for example, perfusion deficiency, diffusion barriers due to pulmonary edema, and reduced alveolar ventilation due to bronchial obstruction [35]. All of these problematic sources influence the computation of dead space. Using this animal model, dead space calculation reflects true dead space before the lavage, but after the lavage this computation may reveal only impaired diffusion in the presence of an induced pulmonary edema.
With successive lung lavages, pulmonary surfactant was removed from the pig’s lungs, causing atelectasis and ARDS. Theoretically, during the course of 4 hours of ventilation, endogenous surfactant reproduction from the remaining pneumocyte type II cells could weaken the ARDS condition. Hence, the respiratory system com-pliance would gradually be restored. However, as dem-onstrated in Figure 3, the dynamic lung compliance was stable at 0.92 ml/kg/cmH2O for 2 hours after the
ther-apy and even decreased to 0.6 and 0.76 ml/kg/cmH2O
after a 10-second disconnection for the last 1.5 hours. From this, endogenous surfactant production seemed not to play a significant role in our ARDS model. How-ever, further research on endogenous surfactant produc-tion in such animal models could be useful as background information for the ventilation management.
During the experiments, the supine position was set up and poor dorsal ventilation was expected. EIT images can be used to analyze the lung conditions; for example, improved dorsal ventilation, atelectasis or a detection of pneumothorax. This noninvasive measurement gives more insight into the lung pathophysiology during ventilation therapy at the bedside.
Considering the Berlin ARDS definition [15] and Figure 9b, after the lung lavage all of our animals were
classified as severe ARDS (PaO2/FiO2≤100 mmHg).
To meet the oxygenation goal, PaO2/FiO2was
improv-ing from severe to moderate ARDS durimprov-ing the 4 hours of automatic ventilation therapy in most cases (PaO2/
FiO2≤200 mmHg), indicating an effective
perform-ance of the automatic ventilation. Simultaneously, the
plateau pressure (Pplat≤30 cmH2O) and the pH goals
were fulfilled, as shown in Figure 9c and Figure 9d, respectively.
Clinically, other adjunct therapies are available when conventional lung-protective ventilation is not sufficient: proning, nitric oxide, or extracorporeal membrane oxy-genation. The most severe cases should be transferred to ARDS centers when conventional ventilation measures
fail. Yet most ARDS patients have not received lung-protective ventilation [36]. The autoARDSNet protocol may thus help to foster protocol adherence.
One characteristic of this lavage-induced ARDS model, originally proposed by our group [19], is the high recruitability of the injured lung in conjunction with the concomitant changes in physiological variables (airway pressure, compliance, PaO2or PaCO2). This model thus
allowed us to maximize the changes brought about by our ventilatory protocol. Whereas the other lung injury models, such as oleic acid infusion or hydrochloric acid aspiration, may be more comparable with the human disease [37], our model is nearly ideal to study the ef-fects of mechanical ventilation on lung injury. Hence, it would be worthwhile to also examine the performance of the closed-loop control concept in these animal models in future projects.
In clinical practice, the proposed automatic ventilation therapy system could continuously provide a standard protocol-driven ventilation for patients with ARDS. The system’s benefits include a guaranteed consistency of care, especially during night shifts or other periods of staff shortages (like epidemias). In any case, both auto-ARDSNet ventilation and manual intervention by clinical staff must ensure that there is no failure of measuring equipment, which is crucial in decision-making during the therapy. Reliable measurements of vital parameters are a prerequisite. At present, our system does not represent clinically applicable devices and sensors because it does not yet have any fault-tolerance measures–this must be dealt with by future manufacturers prior to any market approval by legal authorities. One should, however, emphasize that a recent study demonstrated the safety and feasibility of closed-loop ventilation in 100 patients with ARDS for 392 days [38].
Conclusion
The primary goal of this study was to develop auto-ARDSNet, a prototype of fully automated ventilation therapy using the ARDSNet protocol. This protocol is known to minimize the mortality rate by 8.8% and is used in daily clinical practice worldwide. A patient with ARDS requires much attention during ventilation ther-apy, especially in a critical state of hypoxia. To reduce the workloads of clinical staff and to maintain the standard of ventilation therapy, automatic ventilation is a promising assistance mechanism for patients and clin-ical staff. Based on animal experiments, the protocol was found to be feasible and safe and can be used for patients with ARDS in the ICU.
patient safety. In addition, EIT images can noninvasively be used for assessing the distribution of ventilation and monitoring other complications, such as pneumothorax, at the bedside in real time. Although the ARDSNet proto-col is evidence based, it is not yet in general practice worldwide. Hence, the proposed automatic ventilation therapy system using the ARDSNet protocol may be beneficial for those centers that do not have the staff to implement the protocol, especially during night shifts, or are located in remote areas.
Key messages
Automatic closed-loop ventilation using the ARDSNet protocol is feasible and safe in operation. A patient–ventilator disconnection should be
omitted by any means; but autoARDSNet ventilation was able to implement an immediate corrective and lung-protective ventilatory strategy in lavage-induced ARDS pigs.
EIT images can be noninvasively used for assessing regional ventilation and monitoring pneumothorax at the bedside in real time.
Abbreviations
ABG:arterial blood gas; ARDS: acute respiratory distress syndrome; ARDSNet: Acute Respiratory Distress Syndrome Network;
autoARDSNet: automatic ventilation therapy using the Acute Respiratory Distress Syndrome Network; bpm: breaths per minute; EIT: electrical impedance tomography; etCO2: end-tidal carbon dioxide; FiO2: fraction of inspired oxygen; I:E ratio: inspiratory–expiratory ratio; PaCO2: arterial carbon dioxide tension; PaO2: arterial oxygen tension; PBW: predicted body weight; PEEP: positive end-expiratory pressure; Pplat: plateau pressure; RR: respiratory rate; SaO2: arterial oxygen saturation; SpO2: peripheral oxygen saturation; VT: tidal volume; VTPW: tidal volume per weight.
Competing interests
The authors declare that they have no competing interests.
Authors' contributions
AP was responsible for the programming, experimental design and conceptualization and data analysis and drafted the manuscript. DS was responsible for the application for animal experiments and experimental design and conceptualization. PP and OT participated in the data analysis and interpretation. BL and SL supervised the animal experiments and involved in design and conceptualization. All authors performed the animal experiments and read, critically revised and approved the final manuscript.
Acknowledgments
The authors acknowledge device support from Pulsion Medical Systems AG, and clinical assistance from Mr Henrik Steinkraus during the animal experiments at Charité University Hospital Berlin.
Author details
1Philips Chair of Medical Information Technology, Helmholtz-Institute for
Biomedical Engineering, RWTH Aachen University, Pauwelsstrasse 20, Aachen 52074, Germany.2Department of Anesthesiology and Intensive Care Medicine, Campus Charité Mitte and Campus Virchow-Klinikum, Charité– University Medicine Berlin, Campus Virchow-Klinikum, Augustenburger Platz 1, Berlin 13353, Germany.
Received: 14 January 2014 Accepted: 5 June 2014 Published: 23 June 2014
References
1. Dantzker DR, Brook CJ, Dehart P, Lynch JP, Weg JG:Ventilation–perfusion distributions in the adult respiratory distress syndrome.Am Rev Respir Dis 1979,120:1039–1052.
2. Gattinoni L, Presenti A, Torresin A, Baglioni S, Rivolta M, Rossi F, Scarani F, Marcolin R, Cappelletti G:Adult respiratory distress syndrome profiles by computed tomography.J Thorac Imag1986,1:25–30.
3. Hudson LD, Milberg JA, Anardi D, Maunder RJ:Clinical risks for
development of the acute respiratory distress syndrome.Am J Respir Crit Care Med1995,151:293–301.
4. Kao SJ, Yeh DY, Chen HI:Clinical and pathological features of fat embolism with acute respiratory distress syndrome.Clin Sci (Lond)2007,113:279–285. 5. Esteban A, Fernández-Segoviano P, Frutos-Vivar F, Aramburu JA, Nájera L,
Ferguson ND, Alía I, Gordo F, Ríos F:Comparison of clinical criteria for the acute respiratory distress syndrome with autopsy findings.Ann Intern Med2004,141:440–445.
6. Davidson TA, Caldwell ES, Curtis JR:Reduced quality of life in survivors of acute respiratory distress syndrome compared with critically ill control patients.JAMA1999,281:354–360.
7. Herridge MS, Cheung AM, Tansey CM:One-year outcomes in survivors of the acute respiratory distress syndrome.N Engl J Med2003,348:683–693. 8. Zambon M, Vincent JL:Mortality rates for patients with acute lung injury/
ARDS have decreased over time.Chest2008,133:1120–1127.
9. Phua J, Badia JR, Adhikari NKJ, Friedrich JO, Fowler RA, Singh JM, Scales DC, Stather DR, Li A, Gattas DJ, Hallett D, Tomlinson G, Stewart TE, Ferguson ND: Has mortality from acute respiratory distress syndrome decreased over time?Am J Respir Crit Care Med2009,179:220–227.
10. Silversides JA, Ferguson ND:Clinical review: Acute respiratory distress syndrome–clinical ventilator management and adjunct therapy.Crit Care2013,17:225.
11. Ashbaugh DG, Bigelow DB, Petty T, Levine BE:Acute respiratory distress in adults.The Lancet1967,2:319–323.
12. Murray JF, Matthay MA, Luce JM, Flick MR:An expanded definition of the adult respiratory distress syndrome.Am Rev Respir Dis1988,138:720–723. 13. Bernard GR, Artigas A, Brigham KL, Carlet J, Falke K, Hudson L, Lamy M,
Legall JR, Morris A, Spragg R:The American–European Consensus Conference on ARDS. Definitions, mechanisms, relevant outcomes, and clinical trial coordination.Am J Respir Crit Care Med1994,149:818–824. 14. Ranieri VM, Rubenfeld GD, Thompson BT, Ferguson ND, Caldwell E, Fan E,
Camporota L, Slutsky AS:Acute respiratory distress syndrome: the Berlin Definition.JAMA2012,307:2526–2533.
15. Ferguson ND, Fan E, Camporota L, Antonelli M, Anzueto A, Beale R, Brochard L, Brower R, Esteban A, Gattinoni L, Rhodes A, Slutsky AS, Vincent J-L, Rubenfeld GD, Thompson BT, Ranieri VM:The Berlin definition of ARDS: an expanded rationale, justification, and supplementary material. Intensive Care Med2012,38:1574–1582.
16. Piantadosi CA, Schwartz DA:The acute respiratory distress syndrome.Ann Intern Med2004,141:460–470.
17. The Acute Respiratory Distress Syndrome Network:Ventilation with lower tidal volume as compared with traditional tidal volumes for acute lung injury.N Engl J Med2000,342:1301–1308.
18. Leonhardt S, Lachmann B:Electrical impedance tomography–the holy grail for ventilation and perfusion monitoring?Intensive Care Med2012, 38:1917–1929.
19. Lachmann B, Robertson B, Vogel J:In vivo lung lavage as an experimental model of the respiratory distress syndrome.Acta Anaesthesiol Scand1980, 24:231–236.
20. Meier T, Luepschen H, Grossherr M, Karsten J, Leonhardt S:Automated mechanical ventilation based on the ARDS Network protocol in porcine acute lung injury.Crit Care2007,11:185.
21. Pomprapa A, Schwaiberger D, Lachmann B, Leonhardt S:Comparison of a fully automatic ARDSNet protocol and a feedback-controlled open lung management concept.Crit Care2013,17:97.
22. Suwa K, Bendixen HH:A mathematical analysis of physiological dead space in a lung model.J Appl Physiol1968,24:549–555.
23. Bodenstein M, David M, Markstaller K:Principles of electrical impedance tomography and its clinical application.Crit Care Med2009,37:713–724. 24. Barber DC, Seagar AD:Fast reconstruction of resistance images.Clin Phys
Phisiol Meas1987,8:A:47–A:54.
tomography: a comparison with ventilation scintigraphy in pigs.Chest 2003,124:314–322.
26. Lachmann B:Open up the lung and keep the lung open.Intensive Care Med1992,18:319–321.
27. Grasso S, Stripoli T, De Michele M, Bruno F, Moschetta M, Angelelli G, Munno I, Ruggiero V, Anaclerio R, Cafarelli A, Driessen B, Fiore T:ARDSnet ventilatory protocol and alveolar hyperinflation: role of positive end-expiratory pressure.Am J Respir Crit Care Med2007,176:761–767. 28. Terragni PP, Rosboch GL, Lisi A, Viale AG, Ranieri VM:How respiratory
system mechanics may help in minimising ventilator-induced lung injury in ARDS patients.Eur Respir J2003,42:15s–21s.
29. Talmor D, Sarge T, Malhotra A, O'Donnell CR, Ritz R, Lisbon A, Novack V, Loring SH:Mechanical ventilation guided by esophageal pressure in acute lung injury.N Engl J Med2008,359:2095–2104.
30. Zhao Z, Steinmann D, Frerichs I, Guttmann J, Möller K:PEEP titration guided by ventilation homogeneity: a feasibility study using electrical impedance tomography.Crit Care2010,14:R8.
31. Clark JM:The toxicity of oxygen.Am Rev Respir Dis1974,110:40–50. 32. Pomprapa A, Alfocea S, Goebel C, Misgeld B, Leonhardt S:Funnel control
for oxygenation during artificial ventilation therapy.InProceedings of the 19th IFAC World Congress.Cape Town: 2014.
33. Pomprapa A, Schwaiberger D, Lachmann B, Leonhardt S:A mathematical model for carbon dioxide elimination: an insight for tuning mechanical ventilation.Eur J Appl Physiol2014,114:165–175.
34. Pomprapa A, Misgeld B, Lachmann B, Walter M, Leonhardt S:Closed-loop ventilation of oxygenation and end-tidal CO2.InProceedings of the IEEE
International Conference on Systems, Man and Cybernetics (SMC).Manchester; 2013.
35. Silbernagl S, Despopoulos A:Color Atlas of Physiology.Stuttgart: Georg Thieme Verlag KG; 2009:120–121.
36. Needham DM, Colantuoni E, Mendez-Tellez PA, Dinglas VD, Sevransky JE, Dennison Himmelfarb CR, Desai SV, Shanholtz C, Brower RG, Pronovost PJ: Lung protective mechanical ventilation and two year survival in patients with acute lung injury: prospective cohort study.BMJ2012,344:e2124. 37. Matute-Bello G, Downey G, Moore BB, Groshong SD, Matthay MA, Slutsky AS, Kuebler WM, Acute Lung Injury in Animals Study Group:An official American Thoracic Society workshop report: features and measurements of experimental acute lung injury in animals.Am J Respir Cell Mol Biol 2011,44:725–738.
38. Arnal JM, Garnero A, Novonti D, Demory D, Ducros L, Berric A, Donati SY, Corno G, Jaber S, Durand-Gasselin J:Feasibility study on full closed-loop control ventilation (IntelliVent-ASV™) in ICU patients with acute respiratory failure: a prospective observational comparative study.Crit Care2013,17:R196.
doi:10.1186/cc13937
Cite this article as:Pomprapaet al.:Automatic protective ventilation using the ARDSNet protocol with the additional monitoring of electrical impedance tomography.Critical Care201418:R128.
Submit your next manuscript to BioMed Central and take full advantage of:
• Convenient online submission
• Thorough peer review
• No space constraints or color figure charges
• Immediate publication on acceptance
• Inclusion in PubMed, CAS, Scopus and Google Scholar
• Research which is freely available for redistribution