User profiling with geo-located posts and demographic data
Adam Poulston, Mark Stevenson and Kalina Bontcheva
Department of Computer Science University of Sheffield
Sheffield S1 4DP, UK
{ARSPoulston1, k.bontcheva, mark.stevenson}@sheffield.ac.uk
Abstract
This paper presents a novel method for user profiling in social media that makes use of geo-location information associated with so-cial media posts to avoid the need for self-reported data. These posts are combined with two publicly available sources of de-mographic information to automatically cre-ate data sets in which posts are labelled with socio-economic status. The data sets are linked by identifying each user’s ‘home loca-tion’. Analysis indicates that the nature of the demographic information is an important fac-tor in performance of this approach.
1 Introduction
Previous research has shown that the language a person uses on-line can be indicative of a wide range of personal characteristics, including gender, age (Schler et al., 2006), personality (Schwartz et al., 2013), political ideology (Sylwester and Purver, 2015) and occupational class (Preot¸iuc-Pietro et al., 2015a). Severaluser profiling models that predict these characteristics have been developed, some of which have accuracy that exceeds human perfor-mance (Burger et al., 2011; Youyou et al., 2015). User profiling models have applications such as gen-dered behaviour analysis (Purohit et al., 2015) and bias reduction in predictive models (Culotta, 2014).
Previous work on user profiling has traditionally relied on profiles annotated with self-reported char-acteristics for training data. This can be difficult to acquire in large quantities and forms a bottle-neck in the development of user profiling systems.
Recently, approaches have attempted to build user profiling datasets through other means. Preot¸iuc-Pietro et al. (2015a)(2015b) extracted known job titles from Twitter profile descriptions to annotate users with occupational class and income. Crowd-sourcing techniques have been used to annotate data—in Kosinski et al. (2013) users were invited to complete a personality quiz and then asked if they wanted to share their data for research purposes. In a similar fashion, Nguyen et al. (2014) provided an application which attempts to guess user’s age and gender based on their Twitter profile and then asks for the correct answer afterwards. Profile informa-tion has also been collected from websites; such as blogs (Schler et al., 2006; Burger et al., 2011) or re-view sites (Hovy et al., 2015).
Many countries regularly conduct surveys of their population that provide large-scale demographic in-formation, some of which is made freely avail-able. For example, the United Kingdom conducts a mandatory census every decade. Although the full information collected is not made publicly available for a century, aggregated information is made freely available. In addition, governments are increasingly making data available for research purposes, some of which may be relevant to user profiling1. This
data has the advantage of providing population-level information gathered using reliable methods.
This paper explores how demographic informa-tion can be used to assist with the development of user profiling models. It describes an approach to the generation of annotated training data by com-bining located social media profiles with
geo-1e.g.http://data.gov.uk/
graphically linked demographic data. This approach is applied using publicly available demographic data describing socio-economic status (Section 2). A set of geo-located tweets is collected and the ‘home lo-cation’ of each user identified using a clustering ap-proach so that each profile can be mapped onto the regions in the demographic data, thereby providing labelled data (Section 4) which is used to create a user profiling system (Section 5).
2 Data Sources
This work makes use of data from two sources: de-mographic data provided by the UK Office for Na-tional Statistics demographic data and Twitter posts.
Demographic data provides information about characteristics of a population within a specified area. The UK government provides open datasets containing information about a range of demo-graphic variables including highest qualification, job category and unemployment rates.
This paper makes use of geodemographic seg-mentation datasets in which an area, or individ-ual’s, demographics are generalised into a single socio-economic category. These types of data sets are often used for marketing purposes (Troy, 2008). The United Kingdom’s Office for National Statis-tics (ONS)2 provides a range of data sets including
the Output Area Classification (OAC) and Local Au-thority Classification (LAC) datasets. Unlike com-mercial datasets, such as MOSAIC3and Acorn4, the
methodology used to develop the OAC and LAC datasets is fully documented.
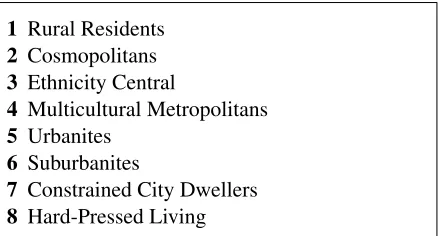
The OAC data set is organised around output ar-eas, regions of around 200 households in England and Wales. The OAC dataset places residents of ev-ery Output Area into a hierarchy of socio-economic groups based on responses to the 2011 UK Cen-sus. The dataset consists of a hierarchical classifica-tion scheme with three layers: supergroups (shown in Figure 1), groups and subgroups. For example, the Output Area E00124315 is associated with the ‘7-constrained city dwellers’ supergroup , the ‘7a-challenged diversity’ group, and the ‘7a2-hampered aspiration’ subgroup.
2http://www.ons.gov.uk
3http://www.experian.co.uk/mosaic/ 4http://acorn.caci.co.uk/
1 Rural Residents
2 Cosmopolitans
3 Ethnicity Central
4 Multicultural Metropolitans
5 Urbanites
6 Suburbanites
7 Constrained City Dwellers
[image:2.612.319.538.60.178.2]8 Hard-Pressed Living
Figure 1:OAC supergroups
1 English and Welsh Countryside
2 Scottish and Northern Irish Countryside
3 London Cosmopolitan
4 Suburban Traits
5 Business and Education Centres
6 Coast and Heritage
7 Prosperous England
8 Mining Heritage and Manufacturing
Figure 2:LAC supergroups
The LAC dataset is organised in a similar way to the OAC dataset, with eight supergroups (shown in Figure 2) and two layers of subgroups, but is gener-alized to cover Local Authorities (also provided by the UK Data service describing areas governed by a single council covering the whole of the UK), which are larger than Output Areas. Despite some similar-ities in names, the two datasets use different clas-sification strategies leading to categories not being directly comparable.
3 Home location identification
Demographic data provides information about indi-viduals based on their residential address, making it important to make sure that a user is associated with that location rather than where they happened to be when sending a particular tweet. Consequently all users in the dataset were assigned a ‘home location’ in the form of a latitude-longitude coordinate.
Our approach assumes that each social media user commonly posts from a limited set of locations. It is further assumed that the location posted from the most often is the user’s home location. The task of assigning ‘home location’ given a collection of geo-located posts is then approached as a clustering problem based on geo-location information associ-ated with their tweets. Other approaches for assign-ing home location were considered, such as as those that consider textual (Han et al., 2014) and social network (Jurgens et al., 2015) cues, but these typ-ically only produce accurate judgements at the city level, whereas demographic datasets often operate at a finer scale.
The coordinates of each user’s geo-located posts are clustered using k-means, with k set using the ‘jump’ method (Sugar and James, 2011). (A range of alternative clustering algorithms were also ex-plored but were not found to significantly improve performance.) The most populous cluster was then identified and the point closest to the cluster cen-troid taken as the home location. Cluster ‘density’ was calculated; defined as the average Vincenty tance (Vincenty, 1975) (a model of geographic dis-tance) in miles between each data point and the clus-ter centroid. This provides the option to exclude users with highly uncertain home location (i.e low density home cluster).
3.1 Evaluating Home Location Assignment
Our method for home location identification was as-sessed by comparing self-reported locations from the ‘location’ field with those assigned by cluster-ing. Only 728 of the 82,519 profiles include a self-reported location. Of these, 176 were discarded as being clearly fictitious; leaving 552 profiles for eval-uation. These were further cleaned by manually re-moving extraneous information such as emoticons.
Varying levels of granularity were present in the
declared location fields, ranging from street level to country, with the majority at town or city level, e.g. ‘Edinburgh’. A number of the location fields also included a single coordinate location. The Nomi-natim geocoding tool5was used to convert the
self-reported locations to geographical coordinates. Vin-centy distance between these coordinates and the as-signed home location was calculated.
The majority of distances (69.7%) were accurate to within 10 miles, more than half (56.9%) accu-rate to within 5 miles and 30.8% within 1 mile. The home location gained from the location text field is only expected to be accurate to within 5 or 10 miles because the majority of self-reported locations are towns or cities. The results given here therefore sug-gest that the clustering approach presented here can identify the home location of a Twitter user with rea-sonable accuracy.
4 Demographically Labelling Data
A data set was created in which each social me-dia profiles were associated with their corresponding OAC and LAC supergroup. A home location was assigned to each of the 82,519 profiles identified of Section 2 using the approach described in Section 3. Point-in-polygon tests then linked each profile with its relevant Output Area and Local Authority. Once a profile was allocated an associated boundary, de-mographic linking is a simple look-up task.
Two user profiling datasets were created by link-ing users with their local demographics; users in England and Wales were labelled with one of eight OAC supergroups associated with that user’s local Output Area, and users across the whole of the UK were labelled with one of eight LAC supergroups as-sociated with their Local Authority. These datasets are referred to as ‘OAC-P and ‘LAC-P’, respectively.
5 User demographic prediction
We approach our analysis as a classification prob-lem, aiming to use the content of a user’s tweets to predict their LAC-P and OAC-P from the eight pos-sible classifications in each data set.
A classification pipeline was created, taking each user’s corpus of tweets as input, tokenized using a
Twitter aware tokenizer (Gimpel et al., 2011). TF-IDF transformed word n-grams (1- and 2-grams) were used as features for a multi-class Support Vec-tor Machine (SVM) with a linear kernel. n-grams and SVMs were chosen as they have been shown to consistently perform well at user profiling tasks, both for social media (Rao and Yarowsky, 2010; Rout et al., 2013; Schwartz et al., 2013) and other types of text (Boulis and Ostendorf, 2005; Garera and Yarowsky, 2009), and are as such a useful tool to establish baseline performance. Balanced sets were extracted from the OAC-P and LAC-P datasets with 2000 members per label in both cases. 10-fold cross-validation was used for all experiments.
5.1 Results
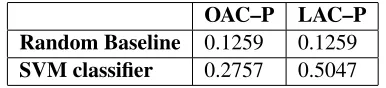
The results of the SVM classifier are presented in Table 1, compared with results from a random base-line. Prediction of both OAC and LAC outper-form the random baseline, indicating that the train-ing dataset described in this article can be used to create valuable user profiling systems. Results for LAC are encouraging and indicate that it is possi-ble to achieve promising results while using a sim-ple classifier. The OAC predictions are noticeably worse than LAC but still outperform the baseline.
The large difference in performance obtained us-ing the two data sets may be down to differences in their nature. Analysis revealed that the regions de-fined in the OAC-P dataset are smaller than those in the LAC-P dataset; the average length of the diag-onal of the minimum bounding rectangle for each region is 0.93 miles for Output Areas, whereas it is 34.5 miles for Local Authorities. It seems proba-ble that profiles are more likely to be mis-classified when assigned to more fine-grained regions in the OAC-P data set, resulting in a noisier data set.
Another difference between the data sets is that the OAC scheme aims to model ‘geographically in-dependent socio-economic status’ in contrast to the LAC categories which are region dependent (e.g. ‘London Cosmopolitan’). Examination of the high-est ranked features by SVM coefficient for each LAC supergroup revealed a connection between groups and geography. The most important fea-tures for many classes are words or phrases refer-encing specific areas in the UK as well as several stereotypical dialect features. For example, the
‘3-OAC–P LAC–P Random Baseline 0.1259 0.1259
[image:4.612.329.522.60.104.2]SVM classifier 0.2757 0.5047
Table 1:Accuracy for OAC–P and LAC–P prediction
London Cosmopolitan’ supergroup’s highest ranked features relate exclusively to London, its surround-ing boroughs and public transport system. In con-trast, the OAC’s feature coefficients are not as lo-cation dependent; for example, ‘1-Rural Residents’ contains features such as ‘Severn’ (a river), ‘stables’, ‘mountain bike’ and ‘emmerdale’ (a UK soap opera set in the countryside). Similarly, ‘4-Multicultural Metropolitans’ is the only group identified that has non-English phrases and the Islamic holidays Eid and Ramadan as important features—a promising sign given the supergroup title.
6 Conclusion
This paper explored the use of population-level de-mographic information for user profiling. It pre-sented a novel approach to the generation of auto-matically labelled data by making use of geo-located social media posts. The ‘home location’ for a user is identified using clustering and then combined with publicly available information from two previously unexplored demographic datasets. A simple classi-fier based solely on tweet content was able to pre-dict socio-economic status with promising results for one data set.
Analysis indicated that the properties of the de-mographic data are important. Key factors include the granularity of the output area and degree to which the groupings are based on socio-economic, rather than geographic, characteristics rather than geographic features.
The demographic data sets used in this work have the advantages that they are large-scale and collected using sound methodologies. However, the informa-tion they contain is aggregated and is updated infre-quently. Our future work will explore the extent to which these disadvantages can be overcome. Accu-rate identification of home location is important for the approach presented here. We will also explore its effect on overall performance and approaches for identifying home location more accurately.
References
Constantinos Boulis and Mari Ostendorf. 2005. A quan-titative analysis of lexical differences between gen-ders in telephone conversations. In Proceedings of the 43rd Annual Meeting on Association for Compu-tational Linguistics, pages 435–442. Association for Computational Linguistics.
John D Burger, John Henderson, George Kim, and Guido Zarrella. 2011. Discriminating gender on twitter. In
Proceedings of the Conference on Empirical Methods in Natural Language Processing, pages 1301–1309. Association for Computational Linguistics.
Zi Chu, Steven Gianvecchio, Haining Wang, and Sushil Jajodia. 2012. Detecting automation of twitter ac-counts: Are you a human, bot, or cyborg? Depend-able and Secure Computing, IEEE Transactions on, 9(6):811–824.
Stefano Cresci, Roberto Di Pietro, Marinella Petroc-chi, Angelo Spognardi, and Maurizio Tesconi. 2015. Fame for sale: efficient detection of fake twitter fol-lowers.Decision Support Systems, 80:56–71.
Aron Culotta. 2014. Reducing sampling bias in social media data for county health inference. InJoint Sta-tistical Meetings Proceedings.
Nikesh Garera and David Yarowsky. 2009. Modeling la-tent biographic attributes in conversational genres. In
Proceedings of the Joint Conference of the 47th An-nual Meeting of the ACL and the 4th International Joint Conference on Natural Language Processing of the AFNLP: Volume 2-Volume 2, pages 710–718. As-sociation for Computational Linguistics.
Kevin Gimpel, Nathan Schneider, Brendan O’Connor, Dipanjan Das, Daniel Mills, Jacob Eisenstein, Michael Heilman, Dani Yogatama, Jeffrey Flanigan, and Noah A Smith. 2011. Part-of-speech tagging for twit-ter: Annotation, features, and experiments. In Pro-ceedings of the 49th Annual Meeting of the Associa-tion for ComputaAssocia-tional Linguistics: Human Language Technologies: short papers-Volume 2, pages 42–47. Association for Computational Linguistics.
Bo Han, Paul Cook, and Timothy Baldwin. 2014. Text-based twitter user geolocation prediction. Journal of Artificial Intelligence Research, pages 451–500. Dirk Hovy, Anders Johannsen, and Anders Søgaard.
2015. User review sites as a resource for large-scale sociolinguistic studies. In Proceedings of the 24th International Conference on World Wide Web, pages 452–461. ACM.
David Jurgens, Tyler Finethy, James McCorriston, Yi Tian Xu, and Derek Ruths. 2015. Geolocation prediction in twitter using social networks: A critical analysis and review of current practice. In
Proceed-ings of the 9th International AAAI Conference on We-blogs and Social Media (ICWSM).
Michal Kosinski, David Stillwell, and Thore Graepel. 2013. Private traits and attributes are predictable from digital records of human behavior. Proceedings of the National Academy of Sciences, 110(15):5802–5805. Dong Nguyen, Dolf Trieschnigg, and Theo Meder. 2014.
Tweetgenie: Development, evaluation, and lessons learned.COLING 2014, pages 62–66.
Daniel Preot¸iuc-Pietro, Vasileios Lampos, and Nikolaos Aletras. 2015a. An analysis of the user occupational class through Twitter content.Proceedings of the 53rd Annual Meeting of the Association for Computational Linguistics and the 7th International Joint Conference on Natural Language Processing (Volume 1: Long Pa-pers), pages 1754–1764.
Daniel Preot¸iuc-Pietro, Svitlana Volkova, Vasileios Lam-pos, Yoram Bachrach, and Nikolaos Aletras. 2015b. Studying user income through language, behaviour and affect in social media. PloS one, 10(9):e0138717. Hemant Purohit, Tanvi Banerjee, Andrew Hampton, Va-lerie L Shalin, Nayanesh Bhandutia, and Amit P Sheth. 2015. Gender-based violence in 140 characters or fewer: A# bigdata case study of twitter.arXiv preprint arXiv:1503.02086.
Delip Rao and David Yarowsky. 2010. Detecting latent user properties in social media. InProc. of the NIPS MLSN Workshop. Citeseer.
Dominic Rout, Kalina Bontcheva, Daniel Preot¸iuc-Pietro, and Trevor Cohn. 2013. Where’s@ wally?: a classification approach to geolocating users based on their social ties. InProceedings of the 24th ACM Con-ference on Hypertext and Social Media, pages 11–20. ACM.
Jonathan Schler, M Koppel, S Argamon, and J Pen-nebaker. 2006. Effects of age and gender on blogging. InProceedings of AAAI Spring Symposium on Com-putational Approaches for Analyzing Weblogs: Papers from the AAAI Spring Symposium, pages 199–205. H. Andrew Schwartz, Johannes C. Eichstaedt,
Mar-garet L. Kern, Lukasz Dziurzynski, Stephanie M. Ra-mones, Megha Agrawal, Achal Shah, Michal Kosin-ski, David Stillwell, Martin E. P. Seligman, and Lyle H. Ungar. 2013. Personality, gender, and age in the language of social media: The open-vocabulary approach.PLoS ONE, 8(9):e73791, 09.
Catherine A Sugar and Gareth M James. 2011. Find-ing the number of clusters in a dataset. Journal of the American Statistical Association.
Austin Troy. 2008. Geodemographic segmentation. In
Encyclopedia of GIS, pages 347–355. Springer US. T. Vincenty. 1975. Direct and inverse solutions of
geodesics on the ellipsoid with application of nested equations.Survey Review, 23(176):88–93.