Karen M. Griffin, Christoph W. Blau, Michael E. Kelly, Colm O’Herlihy, P.R. O’Connell, James F.X. Jones, Christian M. Kerskens
PII: S1053-8119(10)00294-6
DOI: doi:10.1016/j.neuroimage.2010.03.024
Reference: YNIMG 7143 To appear in: NeuroImage
Received date: 7 January 2010 Revised date: 19 February 2010 Accepted date: 9 March 2010
Please cite this article as: Griffin, Karen M., Blau, Christoph W., Kelly, Michael E., O’Herlihy, Colm, O’Connell, P.R., Jones, James F.X., Kerskens, Christian M., Propofol allows precise quantitative arterial spin labelling functional magnetic resonance imaging in the rat,NeuroImage(2010), doi: 10.1016/j.neuroimage.2010.03.024
ACCEPTED MANUSCRIPT
Propofol allows precise quantitative arterial spin labelling
functional magnetic resonance imaging in the rat
Karen M. Griffin 1, Christoph W. Blau 2, Michael E. Kelly 2, Colm O’Herlihy3, P.R.
O’Connell4, James F.X. Jones 1*, Christian M. Kerskens 2.
1
School of Medicine and Medical Sciences, Health Sciences Centre, University College Dublin, Belfield, Dublin 4.
2
Trinity College Institute of Neuroscience, Trinity College Dublin, Dublin 2.
3
Department of Obstetrics and Gynecology, University College Dublin, Belfield,
Dublin 4.
4
Surgical Professorial Unit, St Vincent’s University Hospital, Elm Park, Dublin 4, Ireland.
* Author for Correspondence
Dr. James F. X. Jones M.D., Ph. D.
Room C236
Discipline of Physiology
School of Medicine and Medical Sciences,
University College Dublin,
Belfield,
Dublin 4.
Phone: 01 716 6622
Fax: 01 716 7417
ACCEPTED MANUSCRIPT
AbstractFunctional magnetic resonance imaging (fMRI) techniques highlight cerebral vascular
responses which are coupled to changes in neural activation. However, two major
difficulties arise when employing these techniques in animal studies. First is the
disturbance of cerebral blood flow due to anaesthesia and second is the difficulty of
precise reproducible quantitative measurements. These difficulties were surmounted
in the current study by using propofol and quantitative arterial spin labelling (QASL)
to measure relative cerebral blood volume of labelled water (rCBVlw), mean transit
time (MTT) and capillary transit time (CTT). The ASL method was applied to
measure the haemodynamic response in the primary somatosensory cortex following
forepaw stimulation in the rat. Following stimulation an increase in signal intensity
and rCBVlw was recorded, this was accompanied by a significant decrease in MTT
(1.97 ± 0.06s to 1.44 ± 0.04s) and CTT (1.76 ± 0.06s to 1.39 ± 0.07s). Two animals
were scanned repeatedly on two different experimental days. Stimulation in the first
animal was applied to the same forepaw during the initial and repeat scan. In the
second animal stimulation was applied to different forepaws on the first and second
day. The control and activated ASL signal intensities, rCBVlw on both days were
almost identical in both animals. The basal MTT and CTT during the second scan
were also very similar to the values obtained during the first scan. The MTT recorded
from the animal that underwent stimulation to the same paw during both scanning
sessions was very similar on the first and second day. In conclusion, propofol induces
little physiological disturbance and holds potential for longitudinal QASL fMRI
ACCEPTED MANUSCRIPT
IntroductionFunctional magnetic resonance imaging (fMRI) is a non invasive method of
registering cerebral vascular responses resulting from changes in neural activity
following activation. Blood oxygen level dependent (BOLD) fMRI is the most
commonly used technique in this field and arterial spin labelling (ASL) is also
employed. Functional MRI techniques are based on the close relationship between
local neural activity, metabolism and changes in the cerebral blood flow (CBF)
(Raichle and Mintun, 2006). A major advantage offered by these techniques is the
possibility for non invasive longitudinal studies of brain plasticity (Dijkhuizen and
Nicolay, 2003) and functional recovery processes in models of brain injury (Mueggler
et al., 2001; Schroeter et al., 2009). The tight coupling of regional CBF and neuronal
activity was remarked upon by Roy and Sherrington more than a century ago (Roy
and Sherrington, 1890). In 1948, Kety and Schmidt first described a method for
quantification of CBF in humans using N2O as a freely diffusible tracer (Kety and
Schmidt, 1948). In 1979 Leniger-Follert and Hossmann, using a hydrogen clearance
method, showed that stimulation of the cat forepaw resulted in an increase in the
microcirculatory blood flow to the relevant sensory cortical area which accompanies
enhanced neuronal activity (Leniger-Follert and Hossmann, 1979). This hyperaemia
was later shown to be correlated to an increase in neuronal metabolism (Raichle,
1994).
When various peripheral nerves are stimulated electrically corresponding regions of
the primary somatosensory cortex are activated. By applying stimulation to different
areas of the body the somatosensory cortex can be mapped topographically. Previous
studies of electrical mapping of the exposed brain have been confirmed using fMRI
for cortical localisation of the body’s surface. In the rat, fMRI has been successfully
used for the mapping of the forepaw (Hyder et al., 1994; Masamoto et al., 2007; Van
Camp et al., 2006), the hindpaw (Bock et al., 1998), the tail (Spenger et al., 2000) and
the barrel zones of the whiskers (Lu et al., 2005) .
Blood oxygenation level-dependent (BOLD) contrast, first described by Ogawa and
colleagues (Ogawa et al., 1990), is the most widely used fMRI technique. BOLD
ACCEPTED MANUSCRIPT
signal relies on the blood concentration ratio of oxyhemoglobin to deoxyhemoglobin.
During stimulation there is an increase in activation of the cerebral cortex, this leads
to an increase in metabolic activity and an increase in the cerebral blood flow. Due to
a mismatch between the cerebral blood flow and the metabolic rate, an increase in the
ratio of oxygenated to deoxygenated haemoglobin occurs; this causes an increase in
the BOLD signal. BOLD contrast is dependent upon many physiological parameters
including cerebral blood flow, cerebral blood volume, venous system, vessel drainage,
vessel size and oxygen consumption in a complex fashion (Kim et al., 1997).
Arterial spin labeling (ASL) is an MRI technique capable of providing a more
quantitative assessment of cerebral perfusion. The technique uses either inversion or
saturation pulses to label the magnetization of the water molecules of cerebral arterial
blood (Detre et al., 1992; Williams et al., 1992). Labelled water molecules arrive by
perfusion to the slice of the brain being imaged where they undergo capillary
exchange with interstitial fluid. Consequently, the longitudinal magnetization of brain
tissue is altered and contrast is provided between perfused and stationary tissue. In
order to remove the contribution of tissue to the labelled image, a control image of the
plane of interest is acquired in which the inflowing arterial blood is not labelled.
Labelled and control images are generally acquired in a temporally interleaved
fashion and difference images are obtained by subtracting adjacent pairs of control
and labelled images. These difference images provide a qualitative assessment of
perfusion (Petersen et al., 2006). ASL has been applied to functional imaging of the
rat somatosensory cortex forelimb region (S1FL) during electrical stimulation of the
forepaw under alpha chloralose anaesthesia (Kerskens et al., 1996).
ASL has advantages over other functional imaging methods; it has been reported to
provide better localised mapping of neural activity compared to BOLD (Lee et al.,
2002; Wang et al., 2003). ASL may also be superior to BOLD in tasks lasting longer
than 1-2 minutes (Aguirre et al., 2002). Slow temporal drifts in BOLD signals are not
seen with ASL signals, due to the interleaved nature of the acquisition of labelled and
control images with this latter technique (Wang et al., 2003). One of the main
advantages of ASL is its ability to provide quantitative measurements of cerebral
blood flow changes (Detre and Alsop, 1999). It has been suggested that ASL methods
ACCEPTED MANUSCRIPT
recently developed method of bolus tracking ASL yielded data on mean transit time
(MTT) and capillary transit time (CTT) (Kelly et al., 2010). MTT has been interpreted
as the time taken for the labelled spins to traverse the vasculature. The CTT
encompasses the effects that cause dispersion of the labelled bolus on its transit from
the labelled plane to the imaging site (such as pseudo-diffusion within the
microvasculature and water exchange between the capillaries and tissue). As all fMRI
techniques are highly reliant on the blood perfusion state of the brain, the animal must
be kept in a stable physiological state. With the employment of Kelly’s methods the
relative cerebral blood volume of the labeled water (rCBVlw) can also be measured.
The labelled water that is measured is dispersed in both intra and extra vascular
spaces.
Under general anaesthesia blood pressure, respiration, and heart rate are depressed
compared to the conscious state (Sicard et al., 2003). General anaesthetics also
depress the metabolic activity of the central nervous system (CNS) and therefore
reduce basal CBF (Ueki et al., 1992). Many inhalational anaesthetics cause cerebral
vasodilatation, and therefore tend to increase CBF (Van Hemelrijck et al., 1993). All
these factors frustrate the objective of imaging functional hyperaemic responses. One
of the main difficulties of using fMRI is lack of a suitable anaesthetic agent.
Alpha chloralose is a commonly used anesthetic in ASL (Franke et al., 2000;
Kerskens et al., 1996); it preserves neural activity and hemodynamic coupling (Ueki
et al., 1992), and has been widely used during forepaw stimulation (Duong et al.,
2000; Mandeville et al., 1998; Silva et al., 1999). However it decreases cerebral blood
flow (Austin et al., 2005), and due to its toxic nature it cannot be used for recovery
experiments making it unsuitable for longitudinal studies (Silverman and Muir, 1993).
Urethane has been used during electrical whisker stimulation in the rat (He et al.,
2007), but while it preserves neuronal activation it has adrenoceptor agonist action
that disturbs CBF and, like alpha chloralose, it is non suitable for recovery
experiments. Ketamine has been used in the monkey during hypercapnic challenges
(Zhang et al., 2007), but when used alone it causes muscle hypertonicity and has
undesirable effects on blood flow and blood pressure. Rat forepaw stimulation has
ACCEPTED MANUSCRIPT
minutes after sedative administration (Weber et al., 2006). Isoflurane has been used
during forepaw stimulation in the rat (Liu et al., 2004), but it acts as a cerebral
vasodilator and raises basal CBF (Hendrich et al., 2001). Studies using only
Mivaurium, a neuromuscular blocker, have been carried out in rats (Peeters et al.,
2001) but paralysis without concomitant anaesthesia is unethical and prohibited by
law. Experiments have also been carried out on restrained conscious animals using
BOLD imaging (Ferris et al., 2001; Lahti et al., 1998; Logothetis et al., 1999;
Wyrwicz et al., 2000) and ASL imaging (Sicard et al., 2003), in an attempt to preserve
neuronal coupling. Not only can motion artefact can cause a problem with this
approach, but there is also associated neural activation from stress and motor cortical
activation (Willis et al., 2001).
Propofol is an intravenous short-acting anaesthetic agent (Vasileiou et al., 2009)
introduced in the 1980’s and positively modulates gamma-aminobutyric acid
(GABAA) receptors (Dong and Xu, 2002; Trapani et al., 2000). In a recent study, four
anaesthetics; isoflurane, propofol, ketamine, and alpha chloralose, were studied for
their effect on cerebral blood perfusion in the striatum. Both alpha chloralose and
propofol anaesthesia decreased cerebral perfusion by more than the other two
anaesthetics (Bruns et al., 2009). BOLD studies have been carried out using propofol
anesthesia during hindpaw stimulation in the rat (Lahti et al., 1999), medial nerve
stimulation (Scanley et al., 1997) and during visual stimulation in dogs (Willis et al.,
2001), but there are no reports of its application to ASL imaging.
The aim of this study was to develop an optimal anaesthetic protocol for longitudinal
animal fMRI studies. Both ASL and BOLD were employed during this study: BOLD
provided qualitative evaluation of the activation, whereas ASL provided both
qualitative and quantitative assessment of the haemodynamic response to neuronal
activation. The quantitative ASL approach, when combined with a recoverable
anaesthetic protocol, permits changes in perfusion parameters to be tracked over time.
Materials and Methods
ACCEPTED MANUSCRIPT
All experiments were conducted in accordance with protocols approved by the animal
ethics committees of both University College Dublin and Trinity College Dublin.
These procedures were licensed by the Irish Department of Health and Children. A
total number of 5 adult female Wistar rats (230 - 250 g) were used in the study.
Animals were kept at a 12/12 hr light/dark cycle and had access to water and a
standard diet ad libitum.
Animal preparation
All animals were anaesthetised with 5% isoflurane (Isoflo, Abbott, Queenboro,
England) in oxygen (1L/min) and maintained with 1.5-2% isoflurane. The level of
anaesthesia was regularly monitored throughout the procedure using the pedal
withdrawal reflex to toe pinch and the corneal reflex. The tail vein was cannulated
with a 22G intravenous cannula. The isoflurane was discontinued and the animal was
allowed to recover from its effects before i.v. bolus administration of propofol
(7.5mg/kg) (Rapinovet ®, Schering - Plough). Six minutes following the loading dose
the animals were started on continuous infusion of the drug (45mg/kg/hr i.v.).
Under a full and stable surgical plane of anaesthesia, the femoral artery was
cannulated. This allowed blood gas samples to be taken throughout the experiment.
The femoral artery was not cannulated in the animals used for the repeat study. Once
surgery was complete the animals were placed prone in a Plexiglas cradle with a three
point-fixation system (tooth-bar and ear pieces). Electrodes (Grass subdermal
electrodes, grass technologies, Rhode Island, US) were placed between the 2nd and 5th
digit of the animal’s right forepaw. Electrocardiographic electrodes (SA Instruments
Inc., Stony Brook, New York, USA) were placed on the animal’s chest and the
animal’s heart rate was monitored throughout the experiment. Temperature was
monitored with a rectal thermometer and maintained constant at 37°C using a
warming surface controlled by a water pump-driven temperature regulator. The
respiration signal was monitored using custom hardware and software (SA
Instruments Inc., Stony Brook, NY, USA). The animals where then placed in a 7T, 30
cm bore animal MRI system (Biospec 70/30, Bruker Biospin, Ettlingen, Germany)
scanner with a circular polarized 1H rat brain RF coil (Bruker, BioSpin). A 7cm
diameter volume coil was used for transmission of the ASL and FLASH excitation
ACCEPTED MANUSCRIPT
Repeat studyTwo animals were included in a repeat study and prepared as described above; study
A and study B. A slightly higher bolus dose of propofol was administered in the
repeat study (8mg/kg i.v), the infusion rate was the same as the first day (45mg/kg/hr
i.v). The femoral artery was not cannulated on the first day; however arterial blood
samples were only taken during the second study. Following the first scan, the
animals were rescanned 72 hours later. Stimulation was applied to the right forepaw
during the first and second scan in study A. Stimulation was applied to the right
forepaw of the animal included in study B during the initial scan, the stimulation in
the repeat scan was applied to the left paw. Only the QASL fMRI protocol was run on
the second day of scanning, previous work carried out has shown that BOLD is not
reliable for longitudinal studies (Siewert et al., 1996)
Stimulation protocols
In each experiment an ASL protocol was run during right forepaw stimulation, this
was followed by a BOLD protocol during the same stimulation.
ASL forepaw stimulation A square pulse nerve and muscle stimulator (Grass
Technologies Inc., West Warwick, RI, USA) was used to electrically stimulate the
right forepaw (10V ± 0.5v, 10 Hz, 1 ms duration pulses) for the duration of the
labelling phase of the ASL protocol (approx. 45 s). The current applied was
approximately 2.3mA.
BOLD forepaw stimulation The same apparatus was used to electrically stimulate the
right forepaw. A paradigm of 30 seconds resting period (10 images) followed by 30
seconds of an activation period (10 images) was used. This protocol was repeated 3
times resulting in acquisition time of 3 minutes.
Previous studies carried out using QASL methods tested various frequencies along
with a range of voltages. The optimal stimulation protocol was applied in this study.
Similar pulse duration and frequency was applied during direct nerve stimulation,
with no effect on the physiological parameters of the animal (Cho et al., 2007).
A further study was carried out on the bench to determine the fibre type stimulated
with the above protocol. One female Wistar rat was anesthetised with urethane (20%
ACCEPTED MANUSCRIPT
technologies, Rhode Island, US) were placed in the same position as described above.
The brachial plexus was exposed; the nerve was place on a bipolar silver recording
electrode. The velocity of the nerve was recorded following stimulation of 10V, 20V,
30V, 40V, 50V and 60V. As the length from the stimulation sight to the recording
sight was 40mm latencies exceeding 20ms were considered to be associated with
unmyelinated C-fibres (velocity <2m/s). Stimulation at 10V activated fibres with a
latency of 1.04ms indicating that at this voltage myelinated fibers are stimulated
(figure 1A). The voltage was increased by increments of 10V, at 30V all fibers
stimulated have latencies shorter than 10ms, again indicating their myelinated nature
(figure 1B). Only with application of 60 volts were long latency C-fibres recruited
(figure 1C).
High Resolution Anatomical Scan
Forepaw somatosensory cortex (S1FL) was located in all animals using a rapid
acquisition with relaxation enhancement (RARE) (Hennig et al., 1986) high resolution
anatomical scan and compared to a rat brain atlas in order to locate the slice with
optimal S1FL coverage (Paxinos and Wartson, 2005). Scan protocol: slice thickness =
2 mm, TE = 12 ms, TR = 3.134 s, FOV = 3.0 x 3.0 cm, image matrix = 256 x 256,
RARE factor = 6. This imaging slice was then used for the subsequent ASL sequence.
ASL MRI sequence
The bolus-tracking ASL sequence was used to provide ASL signal-time curves (Kelly
et al., 2009) The sequence consisted of a 5 s preparation interval containing the
inversion pulse, followed by snapshot fast low angle shot (FLASH) gradient echo
image acquisition. The protocol consisted of an inversion pulse and two varied delays
(Kelly et al., 2009), allowing the signal-time curve to be plotted (Figure 2 ). The
inversion pulse had a bandwidth of 2.8 kHz and the gradient strength was set to 14mT
m-1, this provided an inversion region thickness of 4.7mm. The imaging slice was
centred on the S1FL region, at 0.2mm anterior to Bregma (Paxinos and Wartson,
2005). The tagging location was 2cm proximal to the imaging slice, and the pulse
frequency was offset by -12kHz. The control image had an offset of +12kHz. The
labelled images were subtracted from the control images to provide a perfusion map.
ACCEPTED MANUSCRIPT
6.66 s, echo time (TE) = 2.99 s, RF flip angle = 300, field of view = 3.0 x 3.0 cm,
image matrix = 128 x 64, receiver bandwidth = 50 kHz.
T1 measurement
The RARE sequence (Hennig et al., 1986) with variable repetition time (VTR) was
used to generate T1 maps at the same imaging location as the ASL images. Maps
from n=5 similar animals to those used in the ASL measurements were generated and
subsequently averaged to provide an average T1 value of 1.74 s for the S1FL region.
This T1 value was used when fitting the modified Focker-Planck equation (Kelly et
al., 2010) to the btASL data. The following parameters were used for the RARE-VTR
acquisitions: slice thickness = 2 mm, VTR = 0.3 s, 0.59 s, 0.94 s, 1.40 s, 2.03 s, 3.10 s
and 8.00 s, TE = 25.27 ms, FOV = 3.0 × 3.0 cm, image matrix = 128 × 64, RARE
factor: 6.
Qualitative ASL Data analysis
Arterial spin images were analysed using Scion image (Scion corporation). For each
experiment 16 images were captured, 8 images with spin labelling and 8
corresponding control images. The two stacks were averaged and the average labelled
image subtracted from the average control image. The signal intensity within the
S1FL region was calculated during activation and in the resting state.
Quantification of ASL
The region of activation from forepaw stimulation was selected using ImageJ ROI
tool (Rasband W.S., Bethesda, MD, USA). The mean transit time and capillary
transit time were quantified in the presence and absence of forepaw stimulation using
the bolus tracking ASL method recently described by Kelly (Kelly et al 2009b).
Briefly, a non-compartmental model of cerebral perfusion was fitted to the bolus
tracking ASL data. The MTT and CTT were calculated from the first and second
statistical moment of the signal-time curves, respectively (Figure 2). The relative
cerebral blood volume of labelled water was also calculated from figure 1. The
amplitude of the fitted curve is directly proportional to the area under the curve (Kelly
et al., 2010). This parameter was therefore used to estimate the rCBVlw during resting
ACCEPTED MANUSCRIPT
BOLD MRI sequenceA coronal T2*-weighted fast gradient echo (FLASH) sequence was acquired using the
following parameters: 1.5mm, repetition time (TR) = 50ms, echo time (TE) = 10ms,
RF flip angle = 300, field of view = 3cmx3cm, image matrix = 128 x 64, receiver
bandwidth = 25,000Hz. Giving a resolution of 0.234 x 0.469 x 1.5mm3 and a total
acquisition time of 3mins 12 sec.
BOLD Data analysis
BOLD data was analysed using Interactive Data Language (IDL; ITTVIS, Boulder,
CO, USA); the percentage signal intensity change was calculated by averaging T2*
signal intensity during activation (iterations 11-19, 31-39 and 51-59) and normalised
to the signal intensity during rest (iterations 4-9, 21-29 and 41-49). Statistical
parametric maps were generated by thresholding difference images between activated
and resting repetitions of the same scan.
Statistical analysis
All statistical analysis was carried out using GraphPad prism (GraphPad software
Inc., Avebuda de la playa, La Jolla, CA, USA). All results are presented as mean ±
SEM unless otherwise stated. Statistical analysis was performed using Student’s
two-tailed paired t test, unless otherwise stated. The criterion for statistical significance
was p<0.05.
Results
Cardio respiratory indices
The heart rate (HR), respiration rate (RR), and arterial blood gases were monitored
during each experiment. The mean HR and RR in the animals were HR= 339.7 ± 19.3
(all results presented as mean ± S.E.M.) beats per minute, RR = 71.7 ± 2.7 breaths per
minute. The arterial blood gases in the same animals were pCO2 = 44.6 ± 1.1mmHg,
pO2 = 105.2 ± 3.3mmHg and pH = 7.4 ± 0.007. All animals were stable for the
duration of the experiment and indices were within the normal physiological range.
There was no change is respiration rate or heart rate during stimulation.
ACCEPTED MANUSCRIPT
This study employed both ASL and BOLD fMRI techniques to locate the activated
region. Both of these methods successfully showed activation in the forepaw
representation of the somatosensory 1 cortex following stimulation of the right
forepaw, figure 3. Reproducible ASL activation maps were acquired approximately 5
minutes following the start of the continuous propofol infusion. Figure 4 shows the
BOLD and ASL maps for all five animals. Four of the five animals scanned showed
BOLD activation. Figure 5 shows the BOLD signal intensity graph for animal 2. The
average percentage BOLD signal intensity increase following stimulation in the four
animals that showed activation was 4.2%.
Signal intensity changes
The signal intensity in control image was 0.09 ± 0.004 (mean ± SEM) following
stimulation, this intensity increased to 0.13 ± 0.003 (p<0.0002; Student’s two-tailed
paired t test) (figure 6). A percentage increase of 45% was recorded following
activation. The percentage co-efficient of error for the signal intensity following
activation was 29%.
Relative cerebral blood volume of labelled water
The rCBVlw increased following neuronal activation, from 0.106 ± 0.002 to 0.130 ±
0.003, (p<0.0039; Student’s two-tailed paired t test) (figure 7). An average percentage
increase of 12% following forepaw stimulation was recorded.
Mean Transit time and Capillary transit time
Both the MTT and the CTT decreased in all animals during forepaw stimulation. The
MTT decreased from 1.97 ± 0.06 s to 1.44 ± 0.04 s (p = 0.0012, two-tailed paired
Student’s t test) and the CTT decreased during stimulation from 1.76 ± 0.06 s to 1.39
± 0.07 s (p = 0.0214). The MTT decreased by 30% following activation and the CTT
decreased by 21% following activation (figure 8).
Longitudinal study
The baseline values for signal intensity, rCBVlw, MTT and CTT were remarkably
similar when the same animals were re scanned after 72 hours under propofol
anaesthesia (tables 1, 2 and 3). The signal intensity of both animals following
ACCEPTED MANUSCRIPT
were both slightly slower following activation in the second day compared to the
results gathered during the first scan.
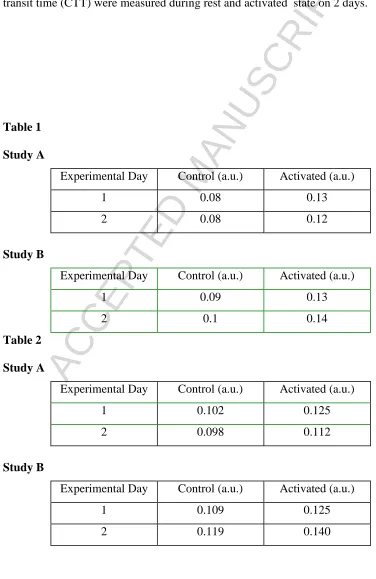
The rCBVlw in study A (same forepaw was stimulated during the first and second
scan) increased from 0.102 a.u. to 0.126 a.u. following forepaw stimulation, a
percentage increase of 23.5%. During the second the second scan day this increase
was slightly lower: (14.3% an increase from 0.098 a.u. to 0.112 a.u). The animal in
study B (different forepaws were stimulated during the first and second scan) also
reflected a similar trend, during the first scan day the rCBVlw increased from 0.109
a.u. to 0.125 a.u. (14.7 % increase). The degree of change in the same animal on the
second day was very similar (17.6% increase). The rCBVlw increased from 0.019 a.u.
to 0.140 a.u.
The MTT in study A decreased from 2.10s to 1.48s, a decrease of 29.5% on the
second day this decrease was slightly less at 25.9%, a decrease from 2.04s to 1.51s.
The CTT during the first scan decreased from 1.90s to 1.41s a decrease of 25.7%.
This degree of change was smaller on the second scan; the CTT decreased from 1.63s
to 1.60s, a change of 1.8%.
The second animal (study B) included in the longitudinal study also shows a smaller
degree of change in both the MTT and CTT on the second day of scanning compared
to the first. The MMT during the initial scan decreased from 1.98s to 1.36s following
activation a percentage decrease of 31.3%. Following stimulation on the second day,
the MTT was slightly lower; a decrease from 1.90s to 1.66s a percentage decrease of
12.6%. The CTT in the same animal also showed a similar pattern, during the first
day of scanning the time transit time decreased from 1.65s to 1.21s following
activation a percentage decrease of 27.1%. The second day of scanning showed a
decreased transit time: (1.70s to 1.56s) following activation, a decrease of 8.2%
Discussion
To the authors’ knowledge this is the first report of ASL fMRI during propofol
anaesthesia in the rat. Both ASL and BOLD fMRI data were acquired and compared
in the same animal. In each of the five animals an ASL protocol was run during right
ACCEPTED MANUSCRIPT
activated images, the region of activation is well localised to the somatosensory 1
forelimb region of the contra lateral side of stimulation. ASL activation is present in
all animals, images A-E. Bold activation is only present in images F-I. Previous
studies have indicated that perfusion imaging techniques show a greater sensitivity to
the hemodynamic response, compared to BOLD (Aguirre et al., 2002; Wang et al.,
2003).
It has been suggested that ASL is more sensitive to feeding arteries in the capillary
bed compared to BOLD which is influenced by large draining vessels (Tjandra et al.,
2005; van Gelderen et al., 2005). Perfusion fMRI and BOLD has previously been
compared in the human (Aguirre et al., 2002; Lee et al., 2002; Wang et al., 2003) and
in isoflurane anaesthetised rats during forepaw stimulation (Liu et al., 2004), where it
was reported that perfusion based fMRI provided better localisation of neuronal
activation than BOLD.
The perfusion maps show low variability in signal intensity in the resting state, and
the increase in signal intensity in response to activation is also consistent. This finding
is in agreement with previous studies (Tjandra et al., 2005) that have shown low
inter-subject variability when using perfusion fMRI. The MTT and CTT were both found to
decrease significantly during electrical stimulation of the forepaw. The MTT is
proportional to 1/CBF and the CTT is proportional to 1/CBF2(Kelly et al., 2010). It
follows that a decrease in both transit times is indicative of an increase in CBF. These
findings are in agreement with previous studies, both MRI and non-MRI, that have
shown focal increases in CBF during neuronal activation (Jones et al., 2001; Li et al.,
2000). The consistency in these perfusion indices in both the resting and activated
state suggests that the animals are maintained in a stable physiological plane, a fact
borne out by the cardio respiratory parameters measured, which remained within
normal limits. An advantage of this protocol is the very low variability between
subjects across all measurable parameters (signal intensity, relative cerebral blood
volume of labelled, MTT and CTT), this indicates that the use of this drug provides
reproducible basal and evoked ASL states. A previous study employed the same
quantitative arterial spin method which is described here, during fMRI acquisition the
sedative, medetomidine was administered to the animal (Kelly et al., 2010). The
ACCEPTED MANUSCRIPT
0.003a.u. which is less than the value in animals anesthetised with propofol: (0.106 ±
0.002a.u.). Kelly’s study recorded an increase of in rCBVlw from 0.086 ± 0.003 a.u. to
0.096 ± 0.005a.u during forepaw stimulation. The work that is presented in the
present study shows the rCBVlw is slightly higher when compared to the
medetomidine study; an increase from 0.106 ± 0.002 a.u. to 0.130 ± 0.003 a.u. The
MTT during the resting state under medetomidine was 1.94 ± 0.08s, following
forepaw stimulation, this decreased to 1.62 ± 0.09s, a reduction of 16%. The CTT
decreased from 1.76 ± 0.13s to 1.30 ± 0.09s following peripheral stimulation, a
decrease of 26%. The MTT and the CTT during rest and activation recorded in
Kelly’s paper were very similar to the results presented here. The results presented
here suggest that medetomidine causes a decrease in relative cerebral blood volume of
labelled water during resting and activated states. The low rCBVlw in the control scan
may be due to vasoconstriction caused by medetomidine, this constriction may also be
sustained during stimulation. It also should be noted that different stimulation
protocols were employed during both studies, this may also have an effect on the
significant difference in rCBVlw following stimulation during both experiments. One
of the main advantages of using propofol over medetomidine is that propofol provides
better success rates during the acquisition of ASL data (unpublished observations).
The longitudinal study presented in this current study under propofol yielded very
similar signal intensity changes. The signal intensity reflects the volume of labelled
water in the activated S1FL, which is in turn an indicator of the blood volume in that
region. The rCBVlw was quantified in both animals on both scan days and varied little
from the initial scan to the repeat scan, during rest and activated states. In both
animals there was an increase in the rCBVlw following peripheral stimulation. The
rCBVlw recorded in both animals on both days were very similar. These results
indicate good reproducibility in both basal and activated states over time. As
previously mentioned; MTT is proportional to 1/CBF and the CTT is proportional to
1/CBF2 (Kelly et al., 2010). The MTT and the CTT were also similar in the resting
state during the first and second day of scanning. This indicates that propofol kept the
animal in a stable physiological condition during repeat doses of the drug. Both the
MTT and the CTT decreased following stimulation to the forepaw, this decrease was
ACCEPTED MANUSCRIPT
suggests that the use of MTT might be a good parameter for tracking subjects over
time. Interestingly the degree of CTT change in the same animal during the initial and
the repeat scan was quite different. One possibility is that brain capillary permeability
to water varies more than cerebral blood flow. The results recorded in study B on the
second day of scanning show a smaller change in MTT and CTT compared to the
initial scan. The mostly likely reason for the difference recorded following stimulation
on both days is that different forepaws where stimulated. What is interesting at this
point is the increase in signal change on both days is identical, along with the volume
of labelled water delivered to the region of interest. This indicates no difference in
blood volume during activation in the left or right somatosensory cortex, but a smaller
functional hyperaemic response to the right hemisphere compared to the left. It should
be noted at this point that the rats were administered with a loading bolus that was
slightly higher on the second day (8mg/kg), although the infusion rate of propofol on
both days was the same. It is unlikely that this had an effect on the results, as the
animal signal intensity, MTT and CTT at rest were very similar on both days. The
BOLD protocol was only run on the first day, previous work carried out has shown
that BOLD is not reliable for longitudinal studies (Siewert et al., 1996)
In the past propofol has been used in BOLD fMRI studies. In 1999, a study was
performed which compared cortical responses in conscious and propofol-anesthetized
rats. There was a 1-6% increase in cortical signal compared to a 6-26% increase in the
conscious animals, indicating some dampening of response by propofol (Lahti et al.,
1999). The medial nerve in rats has also been stimulated and the cortical response
imaged using a BOLD protocol, 2-2.7 % change was seen in signal intensity (Scanley
et al., 1997). A study carried using visual stimulation during BOLD fMRI in dogs
recorded no qualitative differences in images obtained in three anaesthetics;
isoflurane, propofol and fentanyl (Willis et al., 2001).
Propofol anaesthesia preserves cardio respiratory status during experimentation and
this may explain the high success rate with ASL fMRI imaging. The drug exhibits
many useful properties including a rapid onset with minimal side effects (Glen, 1980)
and is rapidly eliminated from the body. When continuously infused at a slow rate
there is little change to heart rate and respiration rate (Koizumi et al., 2002). Propofol
ACCEPTED MANUSCRIPT
al., 1993), but rather propofol induces vasoconstriction, decreases cerebral blood
volume (Cenic et al., 2000; Werner et al., 1993) and relative cerebral blood flow
(Kaisti et al., 2002). This latter effect possibly enhances the signal to noise ratio of
functional hyperaemic responses as blood flow is elevated from a lower basal level.
Propofol also decreases the cerebral metabolic rate of O2 (Enlund et al., 1997) and
cerebral metabolism (Alkire et al., 1995; Dam et al., 1990). However, it does not
accumulate and this facilitates long term use (Hedenquist, Hellebrkers, 2003) and
places it as the drug of choice for prospective animal fMRI studies. Currently
propofol is used in longitudinal paediatric neuro-imaging; it has been described as a
safe and effective method of sedation (Amundsen et al., 2005).
The use of anaesthesia in fMRI is not ideal as it suppresses basal cerebral blood flow
(Sicard et al., 2003; Ueki et al., 1992), but without anaesthetics the images would be
subject to movement artefact particularly in perfusion imaging. The user must be
aware of the disadvantages when using anaesthetics; alpha chloralose decreases
cerebral blood flow (Austin et al., 2005) and along with respiratory depression.
Isoflurane acts as a cerebral vasodilator (Hendrich et al., 2001) and reduces the CBF
response following peripheral stimulation (Masamoto et al., 2007).
Conclusion
This study has established a protocol for propofol anaesthesia during both ASL and
BOLD fMRI in a spontaneously breathing rat during peripheral nerve stimulation.
The protocol which has been described in this study may allow rCBVlw, MTT and
CTT to be tracked in longitudinal studies to investigate changes in the haemodynamic
response to neuronal activation over time over time. The protocol holds much promise
for future studies of cerebrovascular studies.
Acknowledgments
The authors would like to thanks Mrs. Lynne Hughes MVB, DiplECVAA, DVA,
FCARCSI, MRCVS, University Veterinary Hospital, UCD Veterinary Sciences
Centre for her most helpful advice during this study. We would also like thank Dr.
Oliviero Gobbo, School of Pharmacy and Pharmaceutical Sciences for all his help and
ACCEPTED MANUSCRIPT
Griffin), Irish Research Council for Science, Engineering & Technology (Michael
Kelly) and GlaxoSmithKline plc (Christoph Blau).
Reference
Aguirre, G.K., Detre, J.A., Zarahn, E., Alsop, D.C., 2002. Experimental design and the relative sensitivity of BOLD and perfusion fMRI. NeuroImage 15, 488-500. Alkire, M.T., Haier, R.J., Barker, S.J., Shah, N.K., Wu, J.C., Kao, Y.J., 1995. Cerebral metabolism during propofol anesthesia in humans studied with positron emission tomography. Anesthesiology 82, 393-403; discussion 327A.
Amundsen, L.B., Artru, A.A., Dager, S.R., Shaw, D.W., Friedman, S., Sparks, B., Dawson, G., 2005. Propofol sedation for longitudinal pediatric neuroimaging research. J Neurosurg Anesthesiol 17, 180-192.
Austin, V.C., Blamire, A.M., Allers, K.A., Sharp, T., Styles, P., Matthews, P.M., Sibson, N.R., 2005. Confounding effects of anesthesia on functional activation in rodent brain: a study of halothane and alpha-chloralose anesthesia. NeuroImage 24, 92-100.
Bock, C., Krep, H., Brinker, G., Hoehn-Berlage, M., 1998. Brainmapping of alpha-chloralose anesthetized rats with T2*-weighted imaging: distinction between the representation of the forepaw and hindpaw in the somatosensory cortex. NMR Biomed 11, 115-119.
Bruns, A., Kunnecke, B., Risterucci, C., Moreau, J.L., von Kienlin, M., 2009. Validation of cerebral blood perfusion imaging as a modality for quantitative pharmacological MRI in rats. Magn Reson Med 61, 1451-1458.
Cenic, A., Craen, R.A., Howard-Lech, V.L., Lee, T.Y., Gelb, A.W., 2000. Cerebral blood volume and blood flow at varying arterial carbon dioxide tension levels in rabbits during propofol anesthesia. Anesth Analg 90, 1376-1383.
Cho, Y.R., Pawela, C.P., Li, R., Kao, D., Schulte, M.L., Runquist, M.L., Yan, J.G., Matloub, H.S., Jaradeh, S.S., Hudetz, A.G., Hyde, J.S., 2007. Refining the sensory and motor ratunculus of the rat upper extremity using fMRI and direct nerve stimulation. Magn Reson Med 58, 901-909.
Dam, M., Ori, C., Pizzolato, G., Ricchieri, G.L., Pellegrini, A., Giron, G.P., Battistin, L., 1990. The effects of propofol anesthesia on local cerebral glucose utilization in the rat. Anesthesiology 73, 499-505.
Detre, J.A., Alsop, D.C., 1999. Perfusion magnetic resonance imaging with continuous arterial spin labeling: methods and clinical applications in the central nervous system. Eur J Radiol 30, 115-124.
Detre, J.A., Leigh, J.S., Williams, D.S., Koretsky, A.P., 1992. Perfusion imaging. Magn Reson Med 23, 37-45.
Dijkhuizen, R.M., Nicolay, K., 2003. Magnetic resonance imaging in experimental models of brain disorders. J Cereb Blood Flow Metab 23, 1383-1402.
Dong, X.P., Xu, T.L., 2002. The actions of propofol on gamma-aminobutyric acid-A and glycine receptors in acutely dissociated spinal dorsal horn neurons of the rat. Anesth Analg 95, 907-914, table of contents.
Duong, T.Q., Silva, A.C., Lee, S.P., Kim, S.G., 2000. Functional MRI of calcium-dependent synaptic activity: cross correlation with CBF and BOLD measurements. Magn Reson Med 43, 383-392.
ACCEPTED MANUSCRIPT
Ferris, C.F., Snowdon, C.T., King, J.A., Duong, T.Q., Ziegler, T.E., Ugurbil, K., Ludwig, R., Schultz-Darken, N.J., Wu, Z., Olson, D.P., Sullivan Jr, J.M., Tannenbaum, P.L., Vaughan, J.T., 2001. Functional imaging of brain activity in conscious monkeys responding to sexually arousing cues. Neuroreport 12, 2231-2236. Franke, C., van Dorsten, F.A., Olah, L., Schwindt, W., Hoehn, M., 2000. Arterial spin tagging perfusion imaging of rat brain: Dependency on magnetic field strength. Magnetic Resonance Imaging 18, 1109-1113.
Glen, J.B., 1980. Animal studies of the anaesthetic activity of ICI 35 868. Br J Anaesth 52, 731-742.
He, J., Devonshire, I.M., Mayhew, J.E.W., Papadakis, N.G., 2007. Simultaneous laser Doppler flowmetry and arterial spin labeling MRI for measurement of functional perfusion changes in the cortex. NeuroImage 34, 1391-1404.
Hendrich, K.S., Kochanek, P.M., Melick, J.A., Schiding, J.K., Statler, K.D., Williams, D.S., Marion, D.W., Ho, C., 2001. Cerebral perfusion during anesthesia with fentanyl, isoflurane, or pentobarbital in normal rats studied by arterial spin-labeled MRI. Magn Reson Med 46, 202-206.
Hennig, J., Nauerth, A., Friedburg, H., 1986. RARE imaging: a fast imaging method for clinical MR. Magn Reson Med 3, 823-833.
Hyder, F., Behar, K.L., Martin, M.A., Blamire, A.M., Shulman, R.G., 1994. Dynamic magnetic resonance imaging of the rat brain during forepaw stimulation. J Cereb Blood Flow Metab 14, 649-655.
Jones, M., Berwick, J., Johnston, D., Mayhew, J., 2001. Concurrent Optical Imaging Spectroscopy and Laser-Doppler Flowmetry: The Relationship between Blood Flow, Oxygenation, and Volume in Rodent Barrel Cortex. NeuroImage 13, 1002-1015. Kaisti, K.K., Metsahonkala, L., Teras, M., Oikonen, V., Aalto, S., Jaaskelainen, S., Hinkka, S., Scheinin, H., 2002. Effects of surgical levels of propofol and sevoflurane anesthesia on cerebral blood flow in healthy subjects studied with positron emission tomography. Anesthesiology 96, 1358-1370.
Kelly, M.E., Blau, C.W., Griffin, K.M., Gobbo, O.L., Jones, J.F., Kerskens, C.M., 2010. Quantitative functional magnetic resonance imaging of brain activity using bolus-tracking arterial spin labeling. J Cereb Blood Flow Metab.
Kelly, M.E., Blau, C.W., Kerskens, C.M., 2009. Bolus-tracking arterial spin labelling: theoretical and experimental results. Phys Med Biol 54, 1235-1251.
Kerskens, C.M., Hoehn-Berlage, M., Schmitz, B., Busch, E., Bock, C., Gyngell, M.L., Hossmann, K.A., 1996. Ultrafast perfusion-weighted MRI of functional brain activation in rats during forepaw stimulation: comparison with T2 -weighted MRI. NMR Biomed 9, 20-23.
Kety, S.S., Schmidt, C.F., 1948. The nitrous oxide method for the quantitative determination of cerebral blood flow in man; theory, procedure and normal values. J Clin Invest 27, 476-483.
Kim, S.G., Tsekos, N.V., Ashe, J., 1997. Multi-slice perfusion-based functional MRI using the FAIR technique: comparison of CBF and BOLD effects. NMR Biomed 10, 191-196.
Koizumi, T., Maeda, H., Hioki, K., 2002. Sleep-time variation for ethanol and the hypnotic drugs tribromoethanol, urethane, pentobarbital, and propofol within outbred ICR mice. Exp Anim 51, 119-124.
ACCEPTED MANUSCRIPT
Lahti, K.M., Ferris, C.F., Li, F., Sotak, C.H., King, J.A., 1998. Imaging brain activity in conscious animals using functional MRI. J Neurosci Methods 82, 75-83.
Lahti, K.M., Ferris, C.F., Li, F., Sotak, C.H., King, J.A., 1999. Comparison of evoked cortical activity in conscious and propofol-anesthetized rats using functional MRI. Magn Reson Med 41, 412-416.
Lee, S.P., Silva, A.C., Kim, S.G., 2002. Comparison of diffusion-weighted high-resolution CBF and spin-echo BOLD fMRI at 9.4 T. Magn Reson Med 47, 736-741. Leniger-Follert, E., Hossmann, K.A., 1979. Simultaneous measurements of microflow and evoked potentials in the somatomotor cortex of the cat brain during specific sensory activation. Pflugers Arch 380, 85-89.
Li, T.Q., Haefelin, T.N., Chan, B., Kastrup, A., Jonsson, T., Glover, G.H., Moseley, M.E., 2000. Assessment of hemodynamic response during focal neural activity in human using bolus tracking, arterial spin labeling and BOLD techniques. NeuroImage 12, 442-451.
Liu, Z.M., Schmidt, K.F., Sicard, K.M., Duong, T.Q., 2004. Imaging oxygen consumption in forepaw somatosensory stimulation in rats under isoflurane anesthesia. Magn Reson Med 52, 277-285.
Logothetis, N.K., Guggenberger, H., Peled, S., Pauls, J., 1999. Functional imaging of the monkey brain. Nat Neurosci 2, 555-562.
Lu, H., Soltysik, D.A., Ward, B.D., Hyde, J.S., 2005. Temporal evolution of the CBV-fMRI signal to rat whisker stimulation of variable duration and intensity: a linearity analysis. NeuroImage 26, 432-440.
Mandeville, J.B., Marota, J.J., Kosofsky, B.E., Keltner, J.R., Weissleder, R., Rosen, B.R., Weisskoff, R.M., 1998. Dynamic functional imaging of relative cerebral blood volume during rat forepaw stimulation. Magn Reson Med 39, 615-624.
Masamoto, K., Kim, T., Fukuda, M., Wang, P., Kim, S.G., 2007. Relationship between neural, vascular, and BOLD signals in isoflurane-anesthetized rat somatosensory cortex. Cereb Cortex 17, 942-950.
Mueggler, T., Baumann, D., Rausch, M., Rudin, M., 2001. Bicuculline-induced brain activation in mice detected by functional magnetic resonance imaging. Magn Reson Med 46, 292-298.
Ogawa, S., Lee, T.M., Kay, A.R., Tank, D.W., 1990. Brain magnetic resonance imaging with contrast dependent on blood oxygenation. Proc Natl Acad Sci U S A 87, 9868-9872.
Paxinos, G., Wartson, C., 2005. The rat brain in sterotaxic coordinates. Academic press
Peeters, R.R., Tindemans, I., De Schutter, E., Van der Linden, A., 2001. Comparing BOLD fMRI signal changes in the awake and anesthetized rat during electrical forepaw stimulation. Magn Reson Imaging 19, 821-826.
Petersen, E.T., Zimine, I., Ho, Y.C., Golay, X., 2006. Non-invasive measurement of perfusion: a critical review of arterial spin labelling techniques. Br J Radiol 79, 688-701.
Raichle, M.E., 1994. Visualizing the mind. Sci Am 270, 58-64.
Raichle, M.E., Mintun, M.A., 2006. Brain work and brain imaging. Annu Rev Neurosci 29, 449-476.
Roy, C.S., Sherrington, C.S., 1890. On the Regulation of the Blood-supply of the Brain. J Physiol 11, 85-158 117.
ACCEPTED MANUSCRIPT
Schroeter, M.L., Ettrich, B., Menz, M., Zysset, S., 2009. Traumatic brain injury affects the frontomedian cortex-An event-related fMRI study on evaluative judgments. Neuropsychologia.
Sicard, K., Shen, Q., Brevard, M.E., Sullivan, R., Ferris, C.F., King, J.A., Duong, T.Q., 2003. Regional cerebral blood flow and BOLD responses in conscious and anesthetized rats under basal and hypercapnic conditions: implications for functional MRI studies. J Cereb Blood Flow Metab 23, 472-481.
Siewert, B., Bly, B.M., Schlaug, G., Darby, D.G., Thangaraj, V., Warach, S., Edelman, R.R., 1996. Comparison of the BOLD- and EPISTAR-technique for functional brain imaging by using signal detection theory. Magn Reson Med 36, 249-255.
Silva, A.C., 2005. Perfusion-based fMRI: insights from animal models. J Magn Reson Imaging 22, 745-750.
Silva, A.C., Lee, S.P., Yang, G., Iadecola, C., Kim, S.G., 1999. Simultaneous blood oxygenation level-dependent and cerebral blood flow functional magnetic resonance imaging during forepaw stimulation in the rat. J Cereb Blood Flow Metab 19, 871-879.
Silverman, J., Muir, W.W., 3rd, 1993. A review of laboratory animal anesthesia with chloral hydrate and chloralose. Lab Anim Sci 43, 210-216.
Spenger, C., Josephson, A., Klason, T., Hoehn, M., Schwindt, W., Ingvar, M., Olson, L., 2000. Functional MRI at 4.7 tesla of the rat brain during electric stimulation of forepaw, hindpaw, or tail in single- and multislice experiments. Exp Neurol 166, 246-253.
Tjandra, T., Brooks, J.C., Figueiredo, P., Wise, R., Matthews, P.M., Tracey, I., 2005. Quantitative assessment of the reproducibility of functional activation measured with BOLD and MR perfusion imaging: implications for clinical trial design. NeuroImage 27, 393-401.
Trapani, G., Altomare, C., Liso, G., Sanna, E., Biggio, G., 2000. Propofol in anesthesia. Mechanism of action, structure-activity relationships, and drug delivery. Curr Med Chem 7, 249-271.
Ueki, M., Mies, G., Hossmann, K.A., 1992. Effect of alpha-chloralose, halothane, pentobarbital and nitrous oxide anesthesia on metabolic coupling in somatosensory cortex of rat. Acta Anaesthesiol Scand 36, 318-322.
Van Camp, N., Verhoye, M., Van der Linden, A., 2006. Stimulation of the rat somatosensory cortex at different frequencies and pulse widths. NMR Biomed 19, 10-17.
van Gelderen, P., C, W.H.W., de Zwart, J.A., Cohen, L., Hallett, M., Duyn, J.H., 2005. Resolution and reproducibility of BOLD and perfusion functional MRI at 3.0 Tesla. Magn Reson Med 54, 569-576.
Van Hemelrijck, J., Verhaegen, M., Van Aken, H., 1993. Cerebral effects of inhalational anaesthetics. Baillière's Clinical Anaesthesiology 7, 1035-1055.
Vasileiou, I., Xanthos, T., Koudouna, E., Perrea, D., Klonaris, C., Katsargyris, A., Papadimitriou, L., 2009. Propofol: A review of its non-anaesthetic effects. European Journal of Pharmacology 605, 1-8.
Wang, J., Aguirre, G.K., Kimberg, D.Y., Roc, A.C., Li, L., Detre, J.A., 2003. Arterial spin labeling perfusion fMRI with very low task frequency. Magn Reson Med 49, 796-802.
ACCEPTED MANUSCRIPT
Werner, C., Hoffman, W.E., Kochs, E., Schulte am Esch, J., Albrecht, R.F., 1993. The effects of propofol on cerebral and spinal cord blood flow in rats. Anesth Analg 76, 971-975.
Williams, D.S., Detre, J.A., Leigh, J.S., Koretsky, A.P., 1992. Magnetic resonance imaging of perfusion using spin inversion of arterial water. Proc Natl Acad Sci U S A 89, 212-216.
Willis, C.K., Quinn, R.P., McDonell, W.M., Gati, J., Parent, J., Nicolle, D., 2001. Functional MRI as a tool to assess vision in dogs: the optimal anesthetic. Vet Ophthalmol 4, 243-253.
Wyrwicz, A.M., Chen, N., Li, L., Weiss, C., Disterhoft, J.F., 2000. fMRI of visual system activation in the conscious rabbit. Magn Reson Med 44, 474-478.
Zhang, X., Nagaoka, T., Auerbach, E.J., Champion, R., Zhou, L., Hu, X., Duong, T.Q., 2007. Quantitative basal CBF and CBF fMRI of rhesus monkeys using three-coil continuous arterial spin labeling. NeuroImage 34, 1074-1083.
Figure 1. Brachial plexus compound action potential. An Electroneurogram was
recorded from the brachial plexus following stimulation applied to the forepaw of the
rat. Trace A illustrates the action potential following 10V, B is an action potential
recorded following 30V and trace C is following stimulation of 60V. The conduction
distance was 40mm and therefore velocity measurements for individual peaks of the
compound potential were calculated and shown in all 3 traces.
Figure 2. ASL signal-time curve. Least-squares fit of the ASL signal-time data
(yellow and red asterisks for control and activation experiments respectively) to the
non-compartmental model of cerebral perfusion (blue and green solid lines for control
and activation experiments respectively).
Figure 3. Functional MRI of somatosensory cortex
(A) ASL fMRI activation in forepaw representation in the somatosensory cortex. (B)
BOLD fMRI activation in forepaw representation in the somatosensory cortex. (C)
High resolution image acquired following forepaw stimulation. Activation in both the
ASL fMRI and BOLD fMRI are both in the same slice. Image coordinates: -0.2mm
from bregma. (D) Coronal plate from “The Rat Brain” (Paxinos et al., 1998). Plate
coordinates: -0.2mm from bregma. Both the activation in the ASL and BOLD fMRI
image is in the forelimb representation in somatosensory 1 cortex.
ACCEPTED MANUSCRIPT
Images A – E Arterial spin labelling fMRI images in 5 animals during forepaw
activation. Images F-J BOLD fMRI images in same 5 animals during forepaw
stimulation. ASL protocol was run first immediately followed by BOLD protocol.
ASL activation is present in all animals. BOLD activation is present in animals F-I.
Figure 5. BOLD Signal intensity graph during rest and activated state.
This graph represents the BOLD signal intensity change of animal two during control
and activate state, there was a 7.7% increase in the signal following stimulation to the
forepaw.
Figure 6. Signal intensity change in control and activated image following
forepaw stimulation using arterial spin labelling. Horizontal bar indicates the
mean, n=5.
Figure 7. Transit times during activation of somatosensory cortex. MTT (A) and
CTT (B) in propofol anesthetised animal during control and activated states.
Horizontal bar indicates the mean.
Figure 8. Relative cerebral blood volume of labelled water. Horizontal bar
indicates the mean, n=5.
Table 1. Singal intensity in the longitudinal study (n=2, study A and B); both
animals were initially scanned at time point 0 and following 72 hours the animal was
rescanned. The animal include in study A underwent electrical stimulation of the right
forepaw on both days. The animal included in study B, underwent right paw
stimulation on the first day and left paw stimulation on the second day. The signal
intensity during the control image and activated image on both days were similar in
value. These values correspond closely to the average group data.
ACCEPTED MANUSCRIPT
relative cerebral blood volume of labelled water was measured during rest and
activated state on 2 days.
Table 3. MTT and CTT in the longitudinal study (study A and B corresponds to
the same animal in the previous table). The mean transit time (MMT) and capillary
transit time (CTT) were measured during rest and activated state on 2 days.
Table 1
Study A
Experimental Day Control (a.u.) Activated (a.u.)
1 0.08 0.13
2 0.08 0.12
Study B
Experimental Day Control (a.u.) Activated (a.u.)
1 0.09 0.13
2 0.1 0.14
Table 2
Study A
Experimental Day Control (a.u.) Activated (a.u.)
1 0.102 0.125
2 0.098 0.112
Study B
Experimental Day Control (a.u.) Activated (a.u.)
1 0.109 0.125
2 0.119 0.140
[image:25.595.87.463.173.752.2]ACCEPTED MANUSCRIPT
Study AMTT CTT
Day Control (s) Activated (s) Control (s) Activated (s)
1 2.10 1.48 1.90 1.41
2 2.04 1.51 1.63 1.60
Study B
MTT CTT
Day Control (s) Activated (s) Control (s) Activated (s)
1 1.98 1.36 1.65 1.21