Munich Personal RePEc Archive
Is South Africa’s inflation target too
persistent for monetary policy conduct?
Faul, Joseph and Khumalo, Bridgette and Pashe, Mpho and
Khuzwayo, Miranda and Banda, Kamogelo and Jali, Senzo
and Myeni, Bathandekile and Pule, Retlaodirela and Mosito,
Boitshoko and Jack, Lona-u-Thando and Phiri, Andrew
Department of Business Studies, CTI Potchefstroom Campus, South
Africa, Department of Business Studies, CTI Potchefstroom
Campus, South Africa, Department of Business Studies, CTI
Potchefstroom Campus, South Africa, Department of Business
Studies, CTI Potchefstroom Campus, South Africa, Department of
Business Studies, CTI Potchefstroom Campus, South Africa,
Department of Business Studies, CTI Potchefstroom Campus, South
Africa, Department of Business Studies, CTI Potchefstroom
1 September 2014
Online at
https://mpra.ub.uni-muenchen.de/58233/
IS SOUTH AFRICA’S INFLATION TARGET TOO
PERSISTENT FOR MONETARY POLICY CONDUCT?
Joseph Faul
Department of Business Studies, CTI Potchefstroom Campus,
South Africa
Bridgette Khumalo Department of Business Studies,
CTI Potchefstroom Campus, South Africa
Mpho Pashe
Department of Business Studies, CTI Potchefstroom Campus,
South Africa
Miranda Khuzwayo Department of Business Studies,
CTI Potchefstroom Campus, South Africa
Kamogelo Banda Department of Business Studies,
CTI Potchefstroom Campus, South Africa
Senzo Jali
Department of Business Studies, CTI Potchefstroom Campus,
South Africa
Bathandekile Myeni Department of Business Studies,
CTI Potchefstroom Campus, South Africa
Department of Business Studies, CTI Potchefstroom Campus,
South Africa
Boitshoko Mosito Department of Business Studies,
CTI Potchefstroom Campus, South Africa
Andrew Phiri
Department of Economics and Management Sciences,
School of Economics, North West University, Potchefstroom, South Africa
ABSTRACT: Can the South African Reserve Bank‟s (SARB) substantially control inflation
within their set target of 3-6 percent? We sought to investigate this phenomenon by
examining multiple threshold effects in the persistence levels of quarterly aggregated
inflation data collected between 2003 and 2014. To this end, we employ the three-regime
threshold autoregressive (TAR) model of Hansen (2000). We favour this approach over other
conventional linear econometric models as it permits us to test for varying persistency within
the autoregressive (AR) components of the inflation process. Our empirical explorations
reveal that the SARB‟s set target does indeed lie within a range in which inflation is found to
be most persistent. Overall and more importantly, our results suggest that the SARB should
either consider revising their set inflation target by redefining the inflation target range to
accommodate higher inflation rates or the Reserve Bank should consider abandoning the
inflation targeting regime altogether.
Keywords: Inflation persistence, TAR, Monetary Policy, South African Reserve Bank
(SARB), Inflation Targeting, Developing Economy.
JEL Classification Code: C22, E30, E31, E52, E58.
A substantial body of literature advocates on the pre-assumed advantages of inflation
targeting as a superior framework for monetary policy in comparison to other policy
alternatives (Levin et. al., 2004; Gurkaynak et. al., 2006; and Goncalves and Salles, 2006).
One widely accredited view as to why inflation targeting has gained so many adherents is
based upon the perception of monetary policy being unable to simultaneously attain capital
mobility, a fixed exchange rate and independent monetary policy. This phenomenon is
popularly referred to as a monetary policy „tri-lemma‟ and implies that an open economy can achieve only two of the three stated goals at a given time (Zaidi, 2006). Following the Asian
crisis in 1998, the International Monetary Fund (IMF) recommended monetary authorities
worldwide to adopt a combination of free float exchange rates and inflation rate targets as a
means of lessening the probability of a currency crisis while pursuing policy objectives
focused on the stability in domestic prices (Ito, 2007). For the specific case of South Africa,
financial liberalization and a diluted relationship between the growth in money supply, output
growth and prices made previously employed monetary growth targets less useful as policy
objectives (Levin et. al., 2004). Moreover, South Africa‟s financial integration on an
internationally platform has resulted in high levels of international capital flows over the last
couple of decades or so. This has made it extremely challenging for the SARB to gear
monetary policy by targeting monetary aggregates, or by pegging an exchange rate without
harming employment and output growth. In light of the aforementioned macroeconomic
developments, inflation targets were therefore deemed as being the ideal monetary policy
framework.
Within the design of an inflation targeting framework, Central Banks are not only
concerned with stabilizing actual inflation around a pre-determined inflation range; but they
are also challenged with selecting a pre-determined inflation rate which they could effectively
control. It is thus crucial for Central Banks to select an optimal inflation target after
conducting a rigorous and comprehensive analysis of inflation dynamics (Odhiambo, 2011).
If policymakers, for instance, mistakenly adopt a specific optimal inflation target without a
proper understanding of the dynamics of inflation persistence, then any prolonged financial
instability associated with the inability to control inflation rates would be an outcome of
chasing overambitious policy targets (Orphandes, 2001). By examining specific statistical
properties of the autoregressive (AR) process of a univariate series of the inflation rate,
policymakers can measure the extent to which the inflation rate is persistent. The underlying
sufficient control over the inflation rate, such that any shock to the inflation variable will
result in disequilibrium from the long-run steady-state path. In the opposite case of a lowly
persistent process, central banks can be deemed as exerting a controlling influence over the
inflation rate since the time series reverts back to long-run equilibrium, even in the face of
macroeconomic shocks.
From an academic perspective, a plethora of studies have sought to investigate
persistence within inflation data either by adopting a single-country approach (Rangasamy,
2009, and Kang et. al., 2009) or through panel data methods (Kumar and Okimoto, 2007).
And even more recently, an accumulating amount of empirical evidence has advocated for
nonlinearity existing in the data generating process of the inflation variable. This observation
holds true for both developing economies (Khadaroo, 2005 and Mourelle et. al., 2011, Arize
and Malindretos, 2012) as well as industrialized countries (Cuestas and Harrison, 2010 and
Zhou, 2013). The policy ramifications of nonlinear inflation dynamics are quite intriguing as
they imply that the levels of persistence differ at various ranges of the inflation rate. For
instance, Khadaroo (2005) employs Hansen‟s (1996) two-regime self-exciting threshold
autoregressive (SETAR) model to investigate the threshold effects in the inflation process for
Indian, Singaporean and South African consumer price index (CPI) data between the periods
of 1976-2002. Inflation threshold estimates of 3.4%, -1.3% and 14% are obtained for India,
Singapore and South Africa respectively. Above the defined inflation threshold point for
South African data, the SARC is lower in comparison to inflation rates below this threshold.
Conversely, for the cases of both Indian and Singaporean data, the SARC is lower below the
established thresholds and turns higher above the threshold. In effect, the implications of the
results obtained for South African data puts in question the effectiveness of the SARB‟s
inflation target and whether the specified target of 3-6% creates an economic environment for
desirably lower levels of persistence in the inflation process.
And yet it should be noted that the empirical analysis of Khadaroo (2005) was
conducted for periods prior to the adoption of the inflation target mandate, a shortcoming
which this study attempts to overcome. Our paper hence extends upon the work of Khadaroo
(2005) by investigating threshold effects in the AR properties of the inflation process within
the context of Hansen‟s (2000) three-regime TAR framework for aggregated and disaggregated measures of South African monthly inflation data collected between
directly plug-in the 3 and 6 percent target zones as double inflation thresholds within the
TAR model specification. Thereafter we are able to subjectively estimate the SARC of the
TAR model for the range of 3-6 percent as well as being further enabled to identify whether
persistence is lower or higher in regimes outside the 3-6 percent range. Hence the novelty of
our contribution becomes apparent as we are able to directly assess whether the 3-6 inflation
target range as set by the SARB indeed encompasses a highly persistence inflation range for
both aggregated as well as disaggregated measures of inflation. Therefore, against this
backdrop, we structure the remainder of the paper as follows. Section 2 is the literature
review which is further divided into two sub sections. Section 3 outlines the empirical
three-regime SETAR framework. Section 4 introduces the utilized inflation data and also presents
our empirical findings; the paper is concluded in the fifth section of the paper in the form of
associated policy implications derived from the empirical analysis.
2
INFLATION TARGETING IN SOUTH AFRICA
A dominant trend in the practice of monetary policy has been its dedication to price
stability as well as Central Bank independence. Monetary authorities worldwide have
undertaken these commitments, either by statutory mandates issued from their governments
or by exercises of discretion granted to them by relevant monetary authorities. Amongst a
host of other Central Banks, the South African Reserve Bank (SARB) has demonstrated its
commitment to both price stability and Central Bank independence through the adoption of
an „inflation-targeting‟ regime. According to Epstein (2003), an inflation targeting framework is a neo-liberal approach to central banking in which monetary authorities attempt to; keep
inflation at a defined low level; reduce central bank support for government deficits; help
manage the country‟s integration into world trade and financial markets; and vigorously
reduce the influence of democratic social and political forces on central bank policy. Other
commentators, such as Mishkin and Schmidt-Hebbel (2001), have outlined the key elements
of a „full-fledged‟ inflation targeting regime, as consisting of an institutional commitment to price stability; in the absence of nominal anchors and fiscal dominance; yet dependent on
policy instrument independence as well as on policy transparency and policy accountability.
As an operative policy instrument for policy conduct in South Africa, the SARB has been
granted, at its discretion, the manipulation of short-term nominal interest rates which it uses
environment has been explicitly defined by the SARB as inflation rates ranging between 3-6
percent. So even though financial stability may not exclusively be a panacea for overall
economic development, it is highly recognized that without financial stability the sustainment
of a conducive economic environment for growth cannot be attained (Swanepoel, 2004).
In February 2000, the former governor of the Reserve Bank, Tito Mboweni,
announced the SARB‟s adoption of formal inflation targeting regime. The pre-announced inflation-target was set at a range of between 3 to 6 percent and this target was to be first met
in 2002. The adoption of the inflation targeting (IT) framework has clearly strengthened the
SARB‟s mandate which is primarily built upon four policy pillars namely; policy focus,
policy co-ordination, transparency and accountability. Generally, these pillars contribute to
the SARB‟s move away from the previously eclectic monetary policy frameworks. By outlaying an inflation target range, the SARB is granted greater flexibility when
implementing monetary policy. Generally under an inflation targeting regime, a particular
index must fall within the bands of a specific target range and within a specific time frame as
determined by the Minister of Finance. The inflation objective is also publically announced
and a clear commitment to achieve this objective is spelt out; thus helping to shape the
public‟s inflation expectations. Ultimately, the forward-looking inflation targeting strategy helps planning as well as providing an anchor for expectations of future inflation to influence
price and wage setting decisions (Naraidoo and Gupta, 2010). Moreover, the SARB has opted
for a price index that is comprehensive in terms of item and geographical coverage. The
chosen CPIX measure covers metropolitan and other urban areas where prices are surveyed,
also ensuring a wide geographical coverage of price information as possible (Casteleijn,
1999). The 3-6 inflation target range was established by the government but only after
consultation with the SARB and it is believed that the chosen target is not too narrow thus
enhancing monetary policy credibility. All-in-all, the selected target demonstrates the
Reserve Bank re-owned desire for the inflation process in the new millennium to move the
country in a direction of price stability.
Nonetheless, disputes have risen as to the effectiveness of the current design of the
inflation targeting regime. Two separate arguments have been put forward by academic
researchers, on one hand, as well as by structuralist-based groups such as COSATU, on the
other hand. The latter group argues for the complete abandonment of the inflation targeting
targets, unemployment targets and dual/mixed policy frameworks. This structuralist argument
is that fundamental processes such as openness, political instability and tax policy play a
large role in promoting economic growth in developing countries like South Africa as
opposed to macroeconomic policy of price stability (Epstein, 2003). Conversely, a handful of
research connoisseurs have not necessarily called for the abandonment of inflation targets,
but rather advocate for a revision of the current inflation target to accommodate a wider
target range. The argument put forth by group of academic connoisseurs is that a wider
inflation target may be a more viable policy option for Reserve Bank. All in all, it is
noteworthy that both groups commonly argue/contend that current monetary policy conduct
in South Africa is too restrictive on the macroeconomy and ultimately such arguments place
criticism on the price stabilization orthodox approach of the South African Reserve Bank
(SARB) in its conduct of monetary policy. Henceforth, the presented criticism on the
effectiveness of the adopted inflation-target regime can be empirically addressed on the basis
of whether the current inflation target range set by the Reserve Bank does encompass an
inflation range which is highly persistent.
3
STYLIZED FACTS OF INFLATION IN SOUTH AFRICA
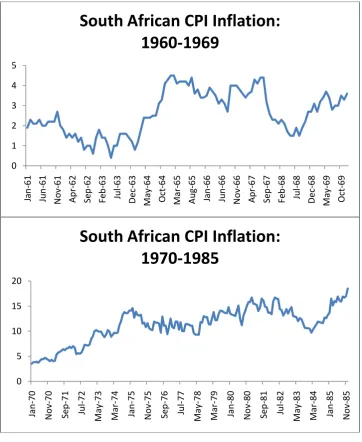
Nell (2000) succinctly summarizes South Africa‟s inflationary experiences into five distinct regimes which he conveniently classifies as; periods of low inflation (1960-1970);
periods of accelerating inflation (1971-1985); high inflation periods1 (1986-1993);
single-digit inflation periods (1994-2001) and the post-inflation targeting era (2002-2014). Table 1
provides a summary of the CPI inflation rate descriptive statistics associated with these
periods (whilst Figures 1-5 are the associated time series plots of these inflation periods).
1
Table 1: Descriptive statistics of CPI inflation: 1960-2014
Date/period Mean minimum 1st quartile Median 3rd quartile Maximum
1960-1970 2.62 0.400 1.675 2.500 3.525 4.500
1971-1985 11.27 3.500 9.60 11.70 13.70 18.50
1986-1993 14.41 8.900 13.10 14.70 15.70 20.90
1994-2001 7.098 1.700 5.650 7.050 9.000 11.100
2002-2014 5.917 0.200 3.900 5.700 7.000 13.700
Source: Authors own calculation based on data obtained from the South African Reserve Bank (SARB) database.
0 1 2 3 4 5 Jan -61 Ju n -61 N ov -61 Ap r-62 Se p -62 Fe b -63 Ju l-63 De c-63 Ma y -64 Oct -64 Ma r-65 Au g -65 Jan -66 Ju n -66 N o v -66 Apr -67 Se p -67 Fe b -68 Ju l-68 De c-68 Ma y -69 Oct -69
South African CPI Inflation:
1960-1969
0 5 10 15 20 Jan -70 N o v -70 Se p -71 Ju l-72 Ma y -73 Ma r-74 Jan -75 N o v -75 Se p -76 Ju l-77 Ma y -78 Ma r-79 Jan -80 N o v -80 Se p -81 Ju l-82 Ma y -83 Ma r-84 Jan -85 N o v -85South African CPI Inflation:
0 5 10 15 20 25 Jan-86 Jun-86 Nov-86 Apr-87 Sep-87 Feb-88 Jul-88 Dec-88 May-89 Oct-89 Mar-90 Aug-90 Jan-91 Jun-91 Nov-91 Apr-92 Sep-92 Feb-93 Jul-93 Dec-93
Sou
th
Afr
ic
an
CPI In
fla
tion
:
1986
-1993
0 2 4 6 8 10 12
Jan-94 Jun-94 Nov-94 Apr-95 Sep-95 Feb-96 Jul-96 Dec-96 May-97 Oct-97 Mar-98 Aug-98 Jan-99 Jun-99 Nov-99 Apr-00 Sep-00 Feb-01 Jul-01 Dec-01
Sou
th
Afr
ic
an
CPI In
fla
tion
:
1994
-2001
0 2 4 6 8 10 12 14 16
The 1960‟s were characterized by periods of low inflation rates which coincided with inflation rates experienced by South Africa‟s industrialized trading partners. According to Nell (2000), exchange rate devaluations during the early 1970‟s and the oil price shock of
1973 and 1979 led to accelerating inflation in the 1970‟s. An increase in the gold price in
1979 and the legalisation of black trade unions in 1980 also contributed to high inflation rates
experienced in the early 1980‟s (Akinboade et. al., 2002). Following the de Kock
Commission‟s report in 1986, M3 money supply targets became the anchor of monetary
policy conduct in South Africa. Concerning inflation in the 1980‟s and early 1990‟s, Luca
(2006) points out that whilst South Africa‟s main trading partners experienced decreasing
rates of inflation during this period, weaker monetary policy stance and political instability
within the economy lead to higher inflation rates. Abolishment of trade sanctions, increased
financial liberalization and political settlement contributed largely to the decline of inflation
in the 1990‟s (Aron and Meullbauer, 2007). Casteleijn (2002) also highlights that resulting structural developments associated with the stabilizing of the economy weakened the
correlation between money supply growth, inflation and output in the 1990‟s, thereby probing
monetary authorities to question the use of monetary targets as policy guidelines.
Eventually in 2000, the South African Reserve Bank (SARB) announced its adoption
of a formal inflation target framework with set targets of 3-6 percent which was then planned
to be met in 2002. The post inflation targeting era has been characterized by a record low
inflation rate of 0.21 percent in January 2004 to a peak of 13.7 percent in July 2008. The
increasing trend of inflation experienced in the South African economy subsequent to
adopting the IT framework can be attributed to a number of factors inclusive of rising food,
oil and other commodity prices over a period of strong global demand and economic growth.
Moreover, the sharp depreciation of local currency experienced from early 2006 to January
2009 further contributed to rising inflation transmitted through an increase in import prices.
With the exception of these post-IT era supply shock episodes, inflation has since remained
within single-digit figures and has been characterized by unprecedented fluctuations within
and outside the target boundaries. Rationally speaking, it is easy to understand why the
Reserve Bank choose a relatively low inflation target since high inflation can have an adverse
effect on certain accounting measures and taxes, it negatively affects the poor, distorts
relative prices and slightly discourages savings and investments, which tends to make
economic decisions more difficult in the long run. But the Reserve Bank cannot seem to be
the inflation rate is at 6.60 percent, which is approximately 0.60 percent above the target
ceiling. Within the 6 month period of observation, the inflation rate has been operating within
the upper boundary of the inflation target and has not operated around the lower end of the
target a few months prior to that observation. This basically stipulates that the Reserve Bank
has barely managed to keep the inflation rate under control for a sustainable period of time;
an observation which puts into question as to whether the SARB‟s inflation target range
encompasses a highly persistent inflation range. Our paper empirically addresses this concern
using a 3 regime TAR model introduced in the following section of our paper.
4
EMPIRICAL CONSIDERATIONS
Consider a univariate time series yt whose data generating process evolves as a
three-regime SETAR similarly to that documented in Hansen (2000):
𝑦𝑡 =
𝜑11𝑦𝑡−1 +𝜑12𝑦𝑡−2+𝜑13𝑦𝑡−3+⋯+𝜑1𝑝𝑦𝑡−𝑝𝐼. (𝑦𝑡−1 < 𝜆1) 𝜑21𝑦𝑡−1+𝜑22𝑦𝑡−2+𝜑23𝑦𝑡−3+⋯+𝜑2𝑝𝑦𝑡−𝑝𝐼. (𝜆1 < 𝑦𝑡−1)≤ 𝜆2)
𝜑31𝑦𝑡−1+𝜑32𝑦𝑡−2+𝜑33𝑦𝑡−3+⋯+𝜑3𝑝𝑦𝑡−𝑝𝐼. (𝑦𝑡−1 > 𝜆2)
(1)
Alternatively, equation (1) can be re-specified in the following compact regression
specification:
𝑦𝑡 = 𝛺𝑡 𝜆1,𝜆2 +𝜀𝑡 (2)
Where:
𝛺𝑡 = (𝑦𝑡−1,𝑦𝑡−2,…,𝑦𝑡−𝑝)
𝛺𝑡 𝜆1,𝜆2 = 𝛺𝑡𝐼. 𝑦𝑡−1 <𝜆1 ; 𝛺𝑡𝐼. 𝜆1 <𝑦𝑡−1 ≤ 𝜆2 ; 𝛺𝑡𝐼. (𝑦𝑡−1 >𝜆2)) 𝜑1𝑖 =𝜑11,𝜑12,…,𝜑1𝑝
In referring to regression equations (1) and (2), the threshold variables (i.e. λ1, λ2)
which govern the regime switching behaviour of the time series are ordered such that λ1 < λ2. Essentially, the SETAR model, as represented in equations (1) and (2), is piecewise
econometric specification which allows the slope coefficients (φ1i, φ2i, φ3i) to differ
depending upon the values of λ1 and λ2. Since, in our case study, the threshold values are known a prior, as in Tong and Lim (1980), then the coefficient values of the regime slope
coefficients can be directly estimated via ordinary least squares (OLS) yielding estimates of:
𝛽 𝜆1,𝜆2 = ( 𝛺𝑡(𝜆1,𝜆2)𝛺𝑡(𝜆1,𝜆2)′)−1( 𝑥𝑡 𝜆1,𝜆2 𝑦𝑡 𝑛
𝑖=1 𝑛
𝑖=1
(3)
The regression residuals are extracted as:
𝜀 𝜆1,𝜆2 =𝑦𝑡 − 𝛺𝑡(𝜆1,𝜆2)′𝛽 𝜆1,𝜆2 (4)
And the sample variance is defined as:
𝜍𝑛2 𝜆1,𝜆2 =
𝜀 (𝜆1,𝜆2)2 𝑛 − 𝑘+𝑚 𝑛
𝑡=1
(5)
For empirical purposes we re-specify the three-regime SETAR model by placing an
inflation series (πt) as the observable time series consisting of two known inflation thresholds
of values 3 and 6, such that λ1 = 3, λ2 = 6. The resulting estimation SETAR regression can thus be depicted as follows:
𝜋𝑡 = ( 𝑎𝑘𝜋𝑡−𝑘 𝑝
𝑗=1
)𝐼.3%>𝜋𝑡 + ( 𝑏𝑘𝜋𝑡−𝑘 𝑝
𝑗=1
)𝐼.3%≤𝜋𝑡<6% + ( 𝑐𝑘𝜋𝑡−𝑘 𝑝
𝑗=1
)𝐼. 𝜋𝑡>6% (6)
Conventionally, inflation persistence is measured as the SARC of each of the
individual regimes of the SETAR process such that inflation persistence under the first
regime is given by (𝜌1 = 𝑝𝑗=1𝑎𝑘); whereas in the corridor regime persistence is measured as
within each of the regimes is considered or rendered as being persistent if it satisfies the
condition (𝜌𝑖≥ 1). As conveniently explained by Rangasamy (2009), when the SARC is
above unity, then this implies that the series behaves as a non-mean reverting process which
does not return back to its equilibrium path in the event of a shock to the variable.
Conversely, when the SARC is found to be less than unity (i.e. 𝜌𝑖 < 1), then shocks to
inflation will dissipate and the time series will revert to its equilibrium level.
5
EMPIRICAL ANALYSIS
5.1 DATA EMPIRICAL
Our empirical dataset comprises of monthly data which has been collected from the
SARB website for the periods of between 2003:01 to 2014:04; thus yielding a total of 136
observations for each observed time series. Our dataset includes 4 aggregated measures of
inflation, 8 measures of disaggregated time series of commodities and 6 measures of
disaggregated measures of service prices. In particular:
The aggregated measures of inflation are: total consumer prices; total consumer prices of commodities and total consumer prices of services.
The disaggregated measures of commodities are: food and non-alcoholic beverages;
housing and utilities; household contents, equipment and maintenance; health,
transport; communication; recreation and culture; and miscellaneous items.
The disaggregated measures of services: housing and utilities; household contents, equipment and maintenance; transport; communication; recreation and culture; and
miscellaneous items.
5.2 EMPIRICAL RESULTS
Table 2 presents the estimation results of the three-regime SETAR regressions for
aggregated measures of inflation. By definition ρ1 represents a measure of inflation
persistence for observations below the lower margin of the inflation target (i.e. π < 3%), whereas ρ2 measures persistence of the inflation process within the target (i.e. 3% < π < 6%)
and ρ3 measures persistence for inflation rates above the upper margin of the inflation target
(i.e. π > 6%). In defining these different measures of persistence, we are able to conveniently
inflation target mandate. Bearing this analogy in mind, two main conclusions can thus be
drawn from our empirical results reported in Table 1. Firstly, it should be noted that for all
aggregated measures of inflation, the SARC is above unity in the corridor regime of the
SETAR specification (i.e. 3% < π < 6%). In other words, our results emphasize the fact that the Reserve Bank‟s set target range of 3-6 percent has indeed encompassed a persistent inflation range. Moreover, we observe that inflation persistence is highest within the corridor
regime of the SETAR models, that is, with the sole exception of total CPI in which we
discover that inflation is most persistent in the lowest regime of the SETAR model (i.e. π <
3%). As a second conclusion, we also observe that the lowest levels of inflation persistence
occur within the third regime of the SETAR model specifications (i.e. π > 6%). This finding
holds true for all aggregated measures of inflation with the exception of persistence in the
inflation of commodity goods in which we find that inflation is least persistence within the
lower regime of the SETAR specification (i.e. π < 3%). Moreover, we note that within the
third regime of the SETAR model, all SARC estimates are significantly below unity, a
finding that indicates that inflation within aggregated items is not persistence. Thus in
collectively, summarizing the results reported in Table 2, it would be safe to assume that the
Reserve Bank would be more effective at administering inflation rates which are above the
[image:16.595.68.530.489.736.2]upper target zone of 6 percent.
Table 2: Persistence at aggregated inflation
time series
SARC AIC MAPE Residual
variance 𝜍𝑛2 𝜆1,𝜆2
DW statistic ρ1
π < 3%
ρ2 3% ≤ π ≤
6%
ρ3 π > 6%
CPIX excl. petrol 0.969 [26.67%] 1.073 [51.11%] 0.764 [22.22%]
-133 15.06% 0.344 1.965
total cpi 1.074
[12.59%]
1.024
[53.33%]
0.967
[34.07%]
-140 15.14% 0.3269 2.254
total commodities 0.962 [16.3%] 1.015 [51.11%] 0.988 [32.59%]
-33 13.14% 0.7174 2.014
total services 0.973
[13.33%]
1.069
[45.19%]
0.784
[41.48%]
-72 14.58% 0.5402 1.987
Source: Authors using data from the South African Reserve Bank (SARB) database
In proceeding with our analysis, we turn now to our attention to the estimation results
reported for disaggregate measures of inflation as provided in Table 3 for commodities and
Table 4 for services. In firstly referring to the results reported in Table 3, we note a biasness
in the results obtained for disaggregated measures of commodities in comparison to the
results obtained for the aggregated measure of total commodities as previously reported in
Table 2. In particular, we observe that with the exception of recreation and miscellaneous
items, the remaining disaggregated measures of commodity inflation have SARC estimates
which are well below unity within all regimes of the SETAR processes. However, in
attempting to identify the regime of the SETAR processes which contain the highest SARC,
our results then become partially mixed. For instance, we observe that half (4 out of the 8) of
the disaggregated measures of commodity prices have the lowest SARC‟s at inflation rates
above 6 percent. These items are clothing, maintenance, communication and recreational
goods. Furthermore, we are able to only identify two item in which inflation persistence is
minimized in the corridor regime for disaggregated measures of commodities, (i.e. transport
and miscellaneous items) and only another two items is inflation persistence minimized in the
lower regimes (i.e. food and health items). Conversely, we find that the highest values of the
SARC in the lowest regime are found maintenance, transport and communication in the
lowest regime; for clothing, health and recreation in the middle regime; and for food and
miscellaneous items in the upper regime of the SETAR processes. All-in-all, as a general
finding, we find persistence to be relatively lower for disaggregated measures of commodity
Table 3: Persistence at disaggregated inflation (commodities)
time series
SARC AIC MAPE Residual
variance 𝜍𝑛2 𝜆1,𝜆2
DW statistic ρ1
π < 3%
ρ2 3% < π <
6%
ρ3 π > 6%
food 0.743
[28.15%]
0.771
[20%]
0.960
[51.85%]
-39 13.94% 0.6878 1.879
housing 0.931
[2.0%]
0.9778
[15.04%]
0.508
[82.96%]
22 5.678% 1.105 1.968
maintenance 0.946
[83.7%]
0.856
[10.37%]
0.283
[5.93%]
-123 55.28% 0.3699 2.015
health 0.761
[20.74%]
0.930
[48.89%]
0.893
[30.37%]
15 15.21% 1.025 1.865
transport 0.950
[61.48%]
0.721
[24.44%]
0.727
[14.07%]
96 72.88% 1.859 2.154
communication 0.994
[82.22%]
0.800
[8.15%]
0.632
[9.63%]
86 30.91% 1.72 2.014
recreation 1.000
[80.74%]
2.064
[10.37%]
0.985
[8.89%]
62 42.85% 1.449 2.001
miscellaneous 0.911
[54.81%]
0.847
[28.15%]
1.008
[17.04%]
-44 36.24% 0.6623 1.879
Note: percentage of observations in each regime is reported in []. DW represents the Durbin Watson test statistic for autocorrelation.
Source: Authors using data from the South African Reserve Bank (SARB) database
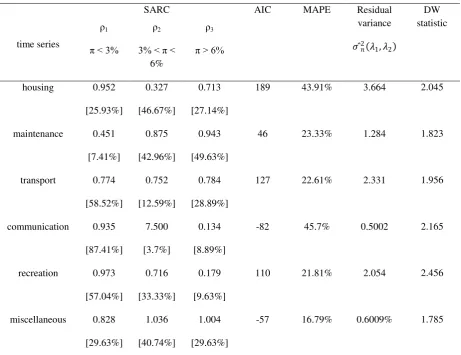
In diverting our attention to the empirical estimates obtained for the disaggregate
measures of services, as reported in Table 4, our estimation results become even more mixed
as well as less definitive. In this regard, our attempts in identifying the overall regimes of the
SETAR processes which contain the highest and lowest SARC for disaggregated measures of
services becomes futile since we observe that the number of items containing the lowest and
highest SARC‟s are exactly the same for each of the SETAR regimes. For instance, we find
that the highest SARC in the lower regime are found for two items (i.e. housing and
recreation); the highest SARC in corridor regime are also found for two items (i.e.
similarly found for two items (maintenance and transport). Conversely, we find that the
lowest SARC in the lower regime is found for two items (i.e. maintenance and
miscellaneous); the lowest SARC in the middle regime are found for two items (i.e. housing
and transport) and the lowest SARC in the upper regime are found for two items (i.e.
communication and recreation). Given the general ambiguous nature of the aforementioned
results, we are left with no option but to conclude that disaggregate measures of inflation
persistence tend to be less in comparison to aggregate measures. Such reasoning can be
deemed as being plausible as it is reminiscent of Backecby et. al. (2008) who suggest that
inflation persistence experienced at the aggregate level may arise, to certain extent, due to
aggregation bias and due to the fact that idiosyncratic shocks will tend to disappear when a
[image:19.595.68.530.343.698.2]substantial number of series are aggregated.
Table 4: Persistence at disaggregated inflation (services)
time series
SARC AIC MAPE Residual
variance
𝜍𝑛2 𝜆1,𝜆2
DW statistic ρ1
π < 3%
ρ2
3% < π < 6%
ρ3
π > 6%
housing 0.952
[25.93%]
0.327
[46.67%]
0.713
[27.14%]
189 43.91% 3.664 2.045
maintenance 0.451
[7.41%]
0.875
[42.96%]
0.943
[49.63%]
46 23.33% 1.284 1.823
transport 0.774
[58.52%]
0.752
[12.59%]
0.784
[28.89%]
127 22.61% 2.331 1.956
communication 0.935
[87.41%]
7.500
[3.7%]
0.134
[8.89%]
-82 45.7% 0.5002 2.165
recreation 0.973
[57.04%]
0.716
[33.33%]
0.179
[9.63%]
110 21.81% 2.054 2.456
miscellaneous 0.828
[29.63%]
1.036
[40.74%]
1.004
[29.63%]
-57 16.79% 0.6009% 1.785
Note: percentage of observations in each regime is reported in []. DW represents the Durbin Watson test statistic for autocorrelation.
6
CONCLUSION
The purpose of our current study was to observe threshold effects in the persistence of
the inflation process for South Africa between the monthly periods 2003-2014 for both
aggregate and disaggregated data series. To this end, we employ Hansesn‟s (2000) 3-regime
SETAR model with two known thresholds. We allow these two threshold points to coincide
with the SARB‟s set inflation target mandate of 3 and 6 percent. As an application of this
empirical strategy, we are able to evaluate as to whether or not the SARRB‟s inflation target
encompasses a highly persistent inflation range. Generally, we consider this empirical
endeavor as being worthwhile since it bears direct relevance towards monetary policy
conduct in the sense of permitting us to determine as to whether the SARB has been able to
effectively control inflation within its designated inflation target of 3 to 6 percent.
The overall findings obtained from our empirical analysis can be summarized as
follows. Concerning aggregated price measures, we establish that inflation within the time
series is highly persistent within the 3-6 percent range as stipulated by the Reserve Bank. In
particular, we observe that inflation is most persistent at rates of between 3 and 6 percent for
total commodities as well as total services and at rates of below 3 percent for total CPI.
Moreover, we also find that the lowest levels of persistent are found at rates above 6 percent
concerning all price indices. Collectively, these results imply that when aggregate inflation is
within the SARB‟s inflation target or at rates lower than its lower margin, then monetary
authorities have to rely on a more forceful application of interest rates in order to ensure that
inflation stays within its target range. Concerning the disaggregated measures of inflation, we
note that persistence within these time series substantially diminishes; a result which can be
attributed to the existing aggregation biasness in the persistence of South African inflation.
In drawing a final conclusion to our empirical study, our overall results emphasize on
the fact that the South African Reserve Bank has not been very successful in stabilizing
aggregate inflation subsequent to the adoption of the inflation targeting regime. This fact
holds true from both a practical as well as empirical perspective. Hence, our paper joins a
host of observers, commentators and other academic connoisseurs in calling for either the
abandonment or the revision of the inflation target. In the event that the Reserve Bank opts to
accommodate higher levels of inflation. Practically speaking, this could be achieved by
amending both the lower and upper margins of its current target range. And yet, it could still
be questioned, that if the Reserve Bank does opt to alter the margins of the inflation target, at
what range(s) should it modify it to? We thus leave such concerns for future research, which
we encourage to focus on identifying inflation rates which would stabilize exchange rates,
maximize economic growth and minimize unemployment rates.
REFERENCES
Akinboade, O., Niedermeier, E., Siebrits, F.(2002), “The dynamics of inflation in South Africa: Implications for policy”, South African Journal of Economics, Vol. 70, No. 3, pp. 213-233.
Aron J., Meullbauer J. (2007), “Review of monetary policy in South Africa since 1994,
Journal of African Economies, Vol. 16, No. 5, pp. 705-744.
Arize, A., Malindretos, J.(2012), “Nonstationary and nonlinearity in inflation rate: Some further evidence”, International Review of Economics and Finance, Vol. 24, pp. 224-234.
Babecky, J., Coricelli, F., Horvath, R.(2009), “Assessing inflation persistence: Micro
-evidence on an Inflation Targeting economy”, CEPR Discussion Papers No. 7268.
Casteleijn, A.(1999), “The viability of implementing an inflation targeting monetary policy
framework in South Africa”, South African Reserve Bank Quarterly Bulletin, June.
Cuestas, J., Harrison, B.(2010), “Inflation persistence and nonlinearities in Central and Eastern European countries”, Economic Letters, Vol. 106, pp. 81-83.
Epstein, G.(2003), “Alternatives to inflation targeting monetary policy for stable and egalitarian growth: A brief summary”, PERI Working Paper No. 62.
Goncalves, C., Salles, J. (2008), “Inflation targeting in emerging economies: What do the
Gurkaynak, S., Levin, A., Swanson, T.(2006), “Does inflation targeting anchor long-run
inflation expectations? Evidence from long-term bond yields in the US, UK and Sweden”,
Federal Reserve Bank of San Francisco Working Paper No. 2006/09.
Hansen, B.(1996), “Inference when a nuisance parameter is not identified under the null
hypothesis”, Econometrica, Vol. 64, No. 2, pp. 413-430.
Hansen, B.(2000), “Sample splitting and threshold estimation”, Econometrica, Vol. 68, No.
3, pp. 575-604.
Khadaroo, A.(2005), “A threshold in inflation dynamics: Evidence from emerging
countries”, Applied Economics, Vol. 37, No. 6, pp. 719-723.
Kumar M., Okimoto, T.(2007), “Dynamics of persistence in international inflation rates”,
Journal of Money, Credit and Banking, Vol. 39, No. 6, pp. 1457-1479.
Ito, T. (2007), “The role of the exchange rate in inflation targeting”, In: Challenges To
Inflation Targeting In Emerging Market Countries, Proceedings Of An International
Symposium Organized By The Bank Of Thailand, Bank Of Thailand, Bangkok, pp. 243-275,
November.
Kang K, Kim C., Marley, J.(2009), “Changes in US inflation persistence”, Studies in
Nonlinear Dynamics and Econometrics, Vol. 13, No. 4, pp. 1-21.
Levin, A., Natalucci F. , Piger, J.(2004), “The macroeconomic effects of inflation targeting”, Federal Reserve Bank Of St. Louis Review, Vol. 86, No. 4, pp. 51-80.
Mishkin, F., Schmidt-Hebbel, K.(2001), “One decade of inflation targeting in the world: What do we know and what do we need to know?”, NBER Working Paper No. 8397, July.
Naraidoo, R., Gupta, R. (2010), “Modelling monetary policy in South Africa: Focus on
Inflation Targeting era using a simple learning rule”, International Business and Economics
Research Journal, Vol. 9, No. 12, pp. 89-98.
Nell, K.(2000), “Is low inflation a precondition for faster growth? The case of South Africa”,
University of Kent, Department of Economics, Working Paper No. 00/11.
Odhiambo, N.(2011), “Twenty years of inflation targeting: What can African countries learn from this policy?” Africagrowth Agenda, No. 11-12, January-March.
Orphandes, A.(2001), “Monetary policy rules, macroeconomic stability and inflation: A view from the trenches”, ECB Working Paper, No. 115, December.
Rangasamy, L.(2009), “Inflation persistence ad core inflation: The case of South Africa”,
South African Journal of Economics, Vol. 77, No. 3, pp. 430-444.
Swanepoel, J.(2004), “The monetary-fiscal policy mix in South Africa”, South African
Journal of Economics, Vol. 72, No. 4, pp. 730-758.
Tong, H., Lim, K.(1980), “Threshold autoregression, limit cycles and cyclical data”,
Journal of the Royal Statistical Society Series B (Methodological), Vol. 42, No. 3, pp.
245-292.
Zaidi, I.(2006), “Exchange rate flexibility and monetary policy framework in Pakistan”, SBP
Research Bulletin, Vol. 2, No. 1, pp. 115-140.
Zhou, S.(2013), “Nonlinearity and stationarity of inflation rates: Evidence from the euro